2356
Using 18F-FDG PET-MR to compare and analyze the value of SUVmax and IVIM parameters in evaluating lung squamous and adenocarcinoma1Department of Radiology, Henan University People’s Hospital & Henan Provincial People’s Hospital, Zhengzhou, China, 2Department of Radiology, Zhengzhou University People’s Hospital & Henan Provincial People’s Hospital, Zhengzhou, China, 3Department of Radiology, Henan Provincial People’s Hospital, Zhengzhou, China, 4Central Research Institute, UIH Group, Shanghai, China, 5Central Research Institute, UIH Group, Beijing, China, 6UIH America, Inc, Houston, TX, United States
Synopsis
PET-MR is a new multi-modal imaging system that organically integrates PET and MRI. SUVmax is the most commonly used semi-quantitative index to measure how much 18F-FDG is taken up by the lesion. Intravoxel incoherent motion (IVIM), including D, D*, f values, provide parameters for the movement of tissue water molecules and parameters for the degree of tissue perfusion. Our results show that SUVmax and IVIM have similar diagnostic performance in the diagnosis of lung squamous and adenocarcinoma.
Introduction
Lung cancer is one of the most common malignant tumors, with the highest incidence and fatality rate among malignant tumors 1. As the most advanced imaging equipment, integrated PET/MR provides cross-modality imaging results such as anatomy, physiology, metabolism, and molecules, allows for more accurate clinical diagnosis and quantitative tumor analysis 2,3. 18F-FDG used in PET imaging can help diagnose and differentiate tumors by distinguishing the difference in imaging agent uptake by normal tissues and tumor tissues 4. Intravoxel incoherent motion (IVIM) technique in MRI is based on the biexponential exponential model and multi-b value acquisition of images, which can obtain the physiological information of perfusion and diffusion more intuitively 5. At present, many studies have explored the possibility of using SUVmax or IVIM alone to diagnose lung squamous and adenocarcinoma, but there are few comparative studies on the SUVmax and IVIM in lung disease. This study aims to explore the possibility of applying SUVmax and IVIM acquired by PET/MR to identify and diagnose lung squamous and adenocarcinoma, and to compare which method is more effective in diagnosis.Material and Methods
The study protocol was reviewed and approved by the local ethics committee and written informed consent was obtained. Taking pathological results as the gold standard, 23 cases were selected in this study (13 males, 10 females), including 15 cases of adenocarcinoma and 8 cases of squamous carcinoma. Studies were conducted on a hybrid 3.0T PET/MR scanner (uPMR790, UIH, Shanghai, China) with a 12 channels phased-array body coil. The PET tracer was 18F‑FDG, prepared by the laboratory, with radiochemical purity >95%. The patients were suggested not to exercise vigorously within 24 hours before the examination, fast for at least 6 hours, and fasting blood glucose less than 8mmol/L in the morning. The patients were asked to lie and rest for 5-10 minutes before injection, and then intravenously injected according to the standard dose of 0.15 mCi/kg. The image acquisition was performed 40-60 minutes of quiet rest after injection. SUVmax measurement was measured by VOI analysis of pet-images. The IVIM sequence was set with the following parameters: TR = 1620 ms, TE = 69.6 ms; b-values = 0, 25, 50, 100, 150, 200, 400, 600, 800, and 1000 s/mm 2, number of averages = 1, 1, 2, 2, 4, 4, 6, 6, 8, 10. The ROI was placed to cover as many solid tumor parts as possible to avoid large vessels, obvious bleeding, necrosis, and cystic area. SPSS 23.0 and Medcalc 15.0 were used for data analysis. The independent sample t-test was applied for between-group analyses. The correlation between SUVmax and D, D*, f were analyzed by using the Pearson correlation coefficient. The ROC curve was generated to evaluate each parameter’s diagnostic accuracy. The Delong method was used to compare the AUCs of different parameters. P<0.05 is considered statistically significant.Results
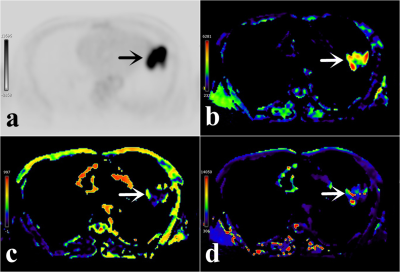
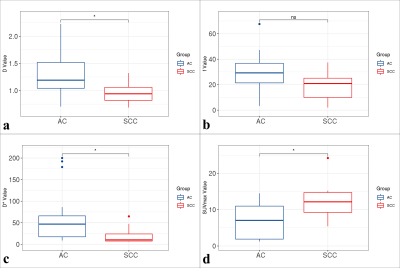
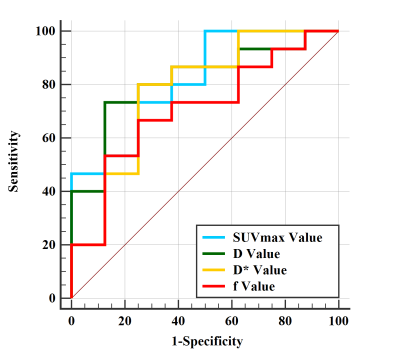
The SUVmax of the squamous carcinoma group (12.56±5.85) was higher than that of the adenocarcinoma group (6.55±4.26). The D and D* values of the adenocarcinoma group [(1.29±0.38)×10-3 mm2/s, (64.12±67.91)×10-3 mm2/s] were higher than those of the squamous carcinoma group [(0.95±0.20)×10-3 mm2/s, (21.28±22.19)×10-3 mm2/s]. The f value is not statistically significant (Figure 1,2). The AUC of SUVmax from PET is 0.817, which is not significantly different from the parameters (D, D* and f) derived from IVIM (Z= 0.000, 0.272, and 0.748, P = 1.0000, 0.7854, and 0.4543, Figure 3). There was no significant correlation between SUVmax and D, D*, and f values in adenocarcinoma and squamous carcinoma groups.Discussion
The SUVmax of the squamous carcinoma group is higher than that of the adenocarcinoma group, which may be related to the higher expression of glucose transporter (GLUT-1) in squamous carcinoma cells than in adenocarcinoma cells 6. The difference in D and D* values of squamous carcinoma and adenocarcinoma is statistically significant. From the pathological and histological point of view, the reason may be that the tumor cells of adenocarcinoma mainly grow along the alveolar wall, while the squamous carcinoma cells mainly grow in clump 7. Therefore, the tumor cell density of squamous carcinoma is higher than that of adenocarcinoma. Also, microcirculation perfusion blood volume, microcirculation capillary length, number, and blood flow velocity are related to it. The correlation between SUVmax and D, D*, f values in squamous and adenocarcinoma groups is not statistically significant, which may be related to the small sample size and individual differences.Conclusion
Both SUVmax and IVIM parameters based on PET-MR are beneficial to the diagnosis of lung squamous and adenocarcinoma, and their diagnostic efficiency is similar.Acknowledgements
The National Key R&D Program of China (2017YFE0103600), the Henan Medical Science and Technology Research Program (2018020357 and 2018020367), the National Natural Science Foundation of China (81720108021 and 31470047), and Zhongyuan Thousand Talents Plan Project - Basic Research Leader Talent (ZYQR201810117).References
1. Alhajj N, Chee CF, Wong TW, Rahman NA, Abu Kasim NH, Colombo P. Lung cancer: active therapeutic targeting and inhalational nanoproduct design. Expert Opin Drug Deliv. 2018;15(12):1223-1247.
2. Seemann MD. Whole-body PET/MRI: the future in oncological imaging. Technol Cancer Res Treat. 2005;4(5):577-582.
3. Eiber M, Martinez-Moeller A, Souvatzoglou MA, et al. Value of a Dixon based MR-PET attenuation correction sequence for the localization and evaluation of PET-positive lesions. Eur J Nucl Med Mol Imaging, 2011, 52(1):1691- 1701.
4. Koizumi T, Fukushima T, Gomi D, et al. Correlation of early PET findings with tumor response to molecular targeted agents in patients with advanced driver-mutated non-small cell lung cancer. Med Oncol. 2017;34(10):169.
5. Klauss M, Mayer P, Maier-Hein K, et al. IVIM-diffusion-MRI for the differentiation of solid benign and malign hypervascular liver lesions-Evaluation with two different MR scanners. Eur J Radiol. 2016;85(7):1289-1294.
6. Ong LC, Jin Y, Song IC, Yu S, Zhang K, Chow PK. 2-[18F]-2-deoxy-D-glucose (FDG) uptake in human tumor cells is related to the expression of GLUT-1 and hexokinase II. Acta Radiol. 2008;49(10):1145-1153.
7. Humphries PD, Sebire NJ, Siegel MJ, Olsen ØE. Tumors in pediatric patients at diffusion-weighted MR imaging: apparent diffusion coefficient and tumor cellularity. Radiology. 2007;245(3):848-854.
Figures


