2355
MR Imaging of Murine Tibia for Co-Clinical Studies of Myelofibrosis1Radiology, University of Michigan, Ann arbor, MI, United States
Synopsis
This study assesses the use of non-invasive MRI to monitor evolution and treatment of Myelofibrosis (MF) in both clinical and pre-clinical settings to quantify disease progression and treatment efficacy. Based on a limited number of studies, MRI can detect changes in the bone marrow fat distribution and fibrosis caused by the progression and treatment of MF. This work seeks quantitative measures such as proton density fat fraction, magnetization transfer and diffusion weighted imaging to investigate proportions of fat, cellularity and fibrosis in bone marrow caused by MF.
Introduction
Myelofibrosis (MF) is a myeloproliferative cancer that causes severe systemic inflammation and pathologic alterations in blood cells leading to progressive bone marrow fibrosis and debilitating hepatosplenomegaly (1). Ruxolitinib, the approved drug for MF, has shown positive results by decreasing splenomegaly and improving inflammatory symptoms (2). Routine MF diagnosis and treatment monitoring require bone marrow biopsies (BMB) as well as spleen volume assessment. However, as multiple BMBs are painful and risky, it is highly desirable to implement MRI as an alternative non-invasive method to detect MF and monitor progression or treatment efficacy. Based on a limited number of previous studies, MRI can detect changes in bone marrow fat distribution and fibrosis caused by the progression of MF (3). In this study, we investigate MRI-based quantitative biomarkers to monitor MF progression in both clinical and pre-clinical settings.Materials and Methods
MF was induced in 14 C57BL/6 female mice using a JAK2 mutation model (4). Mice were imaged every 2 weeks starting 3 weeks after BM transplant. Proton density fat fraction (PDFF), magnetization transfer ratio (MTR), and apparent diffusion coefficient (ADC) were used to estimate proportions of fat, fibrosis, and cellularity within the mice tibial marrow space. Measurements also included the abdomen MRI to measure spleen volume. Additionally, to assess the precision (repeatability) of the quantitative measures, animal MRI scans were acquired one day apart for test-retest analysis. MRI was performed on a Bruker 7T scanner running ParaVision 7 and equipped with a 20 mm Cryoprobe. A 3D printed fixture was used to position and secure the mouse's right leg tibia inside the cryoprobe. To implement water/fat separation, a series of four 3D multi-gradient echo scans with varying echo times TE=1.476, 1.793, 2.11, 2.427 all containing three echoes with echo spacing of 2.17 ms and TR=50 were used. Data processing and analysis employed in-house developed Matlab programs and publicly available Elastix software (5). PDFF processing was implemented by solving the optimization problem to jointly estimate water/fat images and B0-field maps using a graph cut algorithm (6). An image processing pipeline was established that included image registration of follow-up time points to the baseline data.Phantom studies were conducted to establish the accuracy (bias) of acquisition techniques and optimize sequence parameters. Phantoms were made using capillary tubes with an inner diameter (ID) of 0.5, 1, and 2 mm filled with a combination of peanut oil and surfactant to get the desired fat percentages. Additionally, another phantom with the same solutions was imaged on a 3T clinical scanner to confirm the agreement between the multi-echo sequence implemented on the preclinical scanner and the PDFF maps generated by the qDixon method available on the clinical scannerResults and Discussion
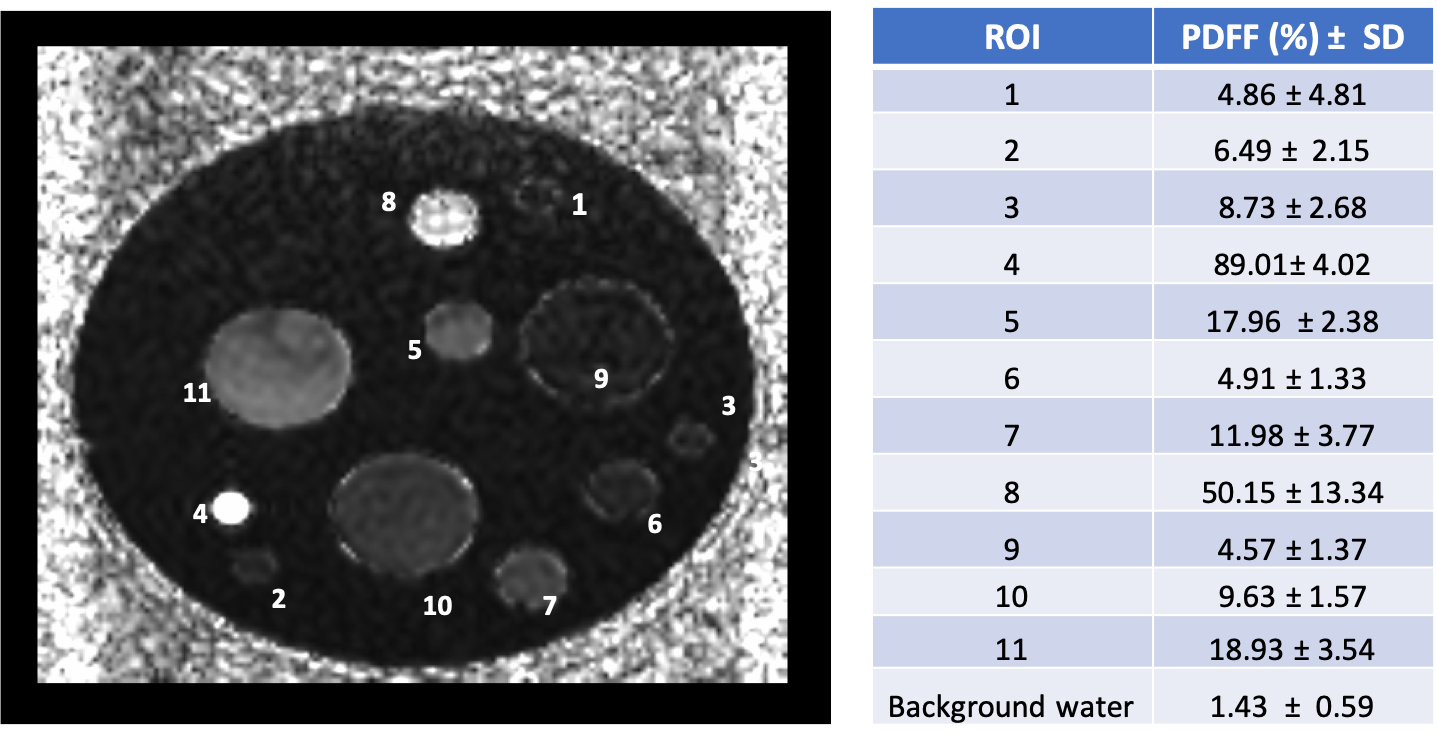
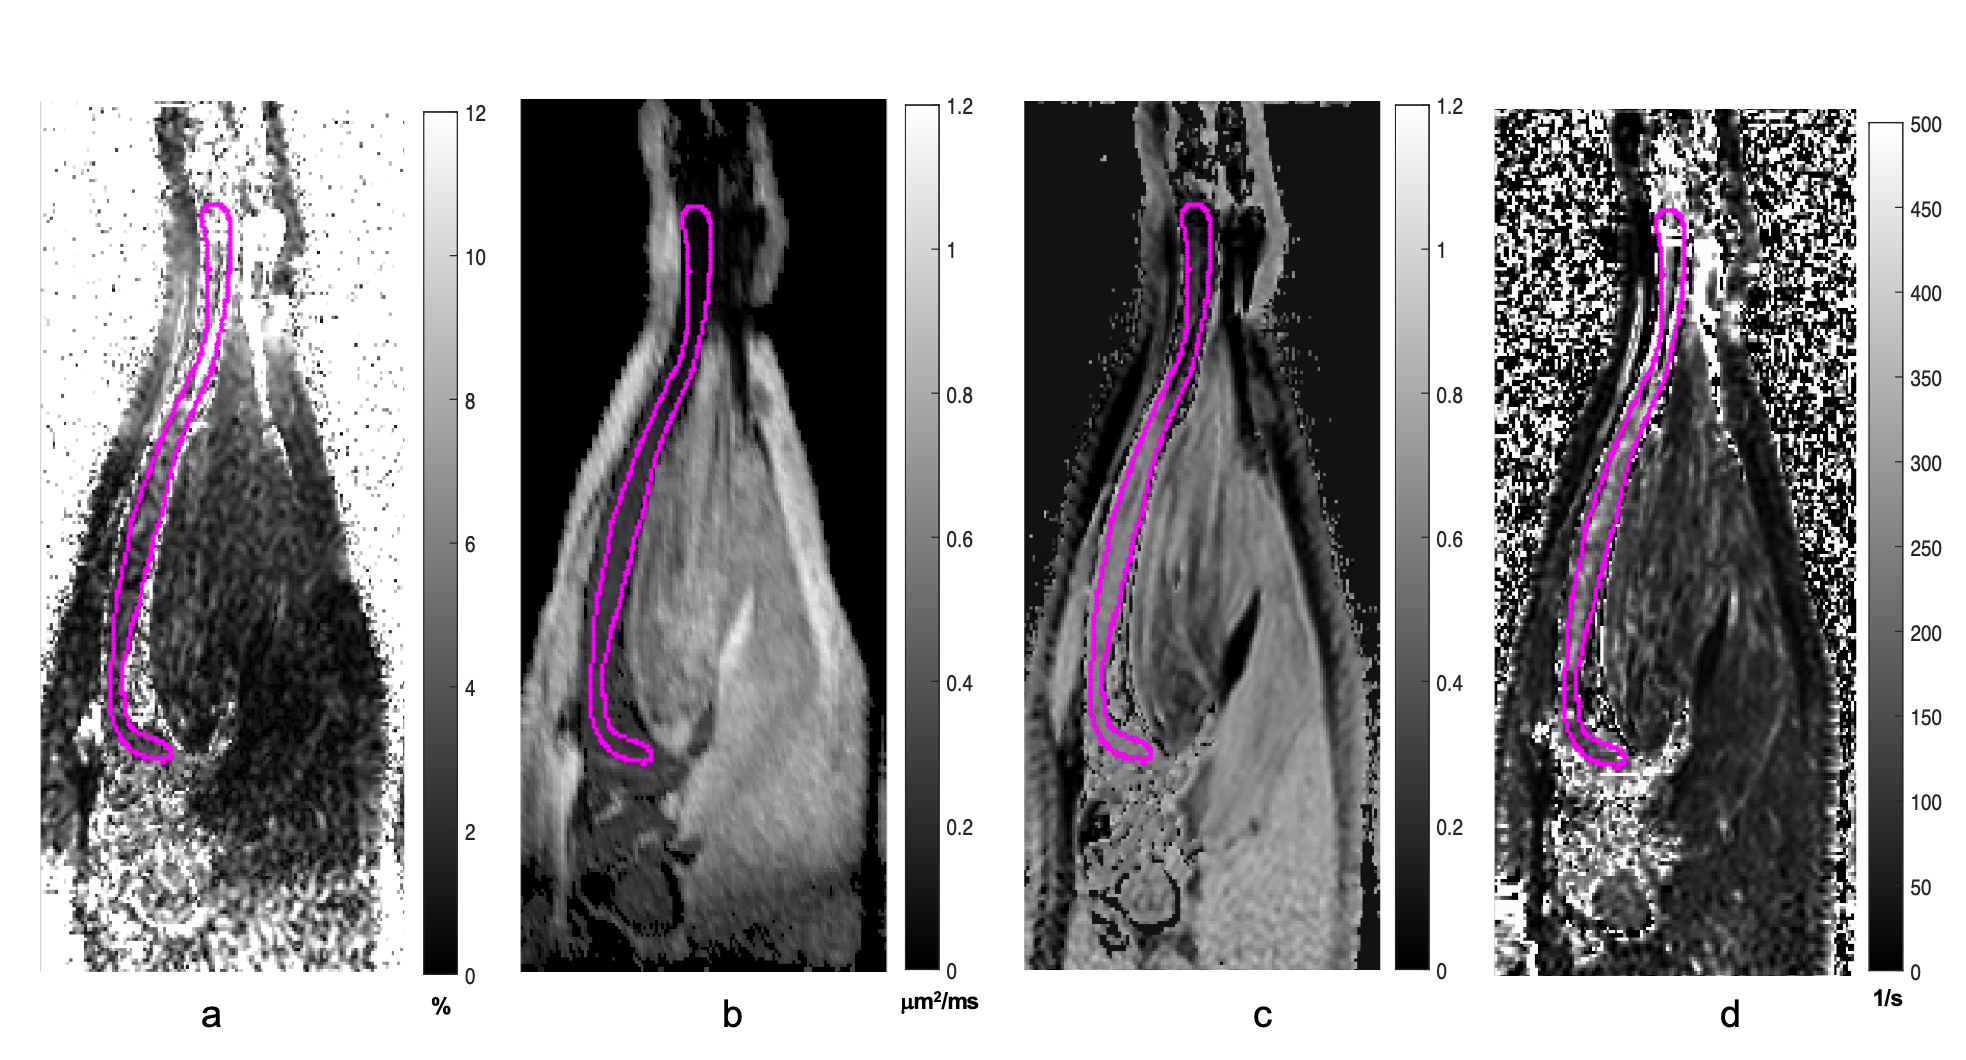
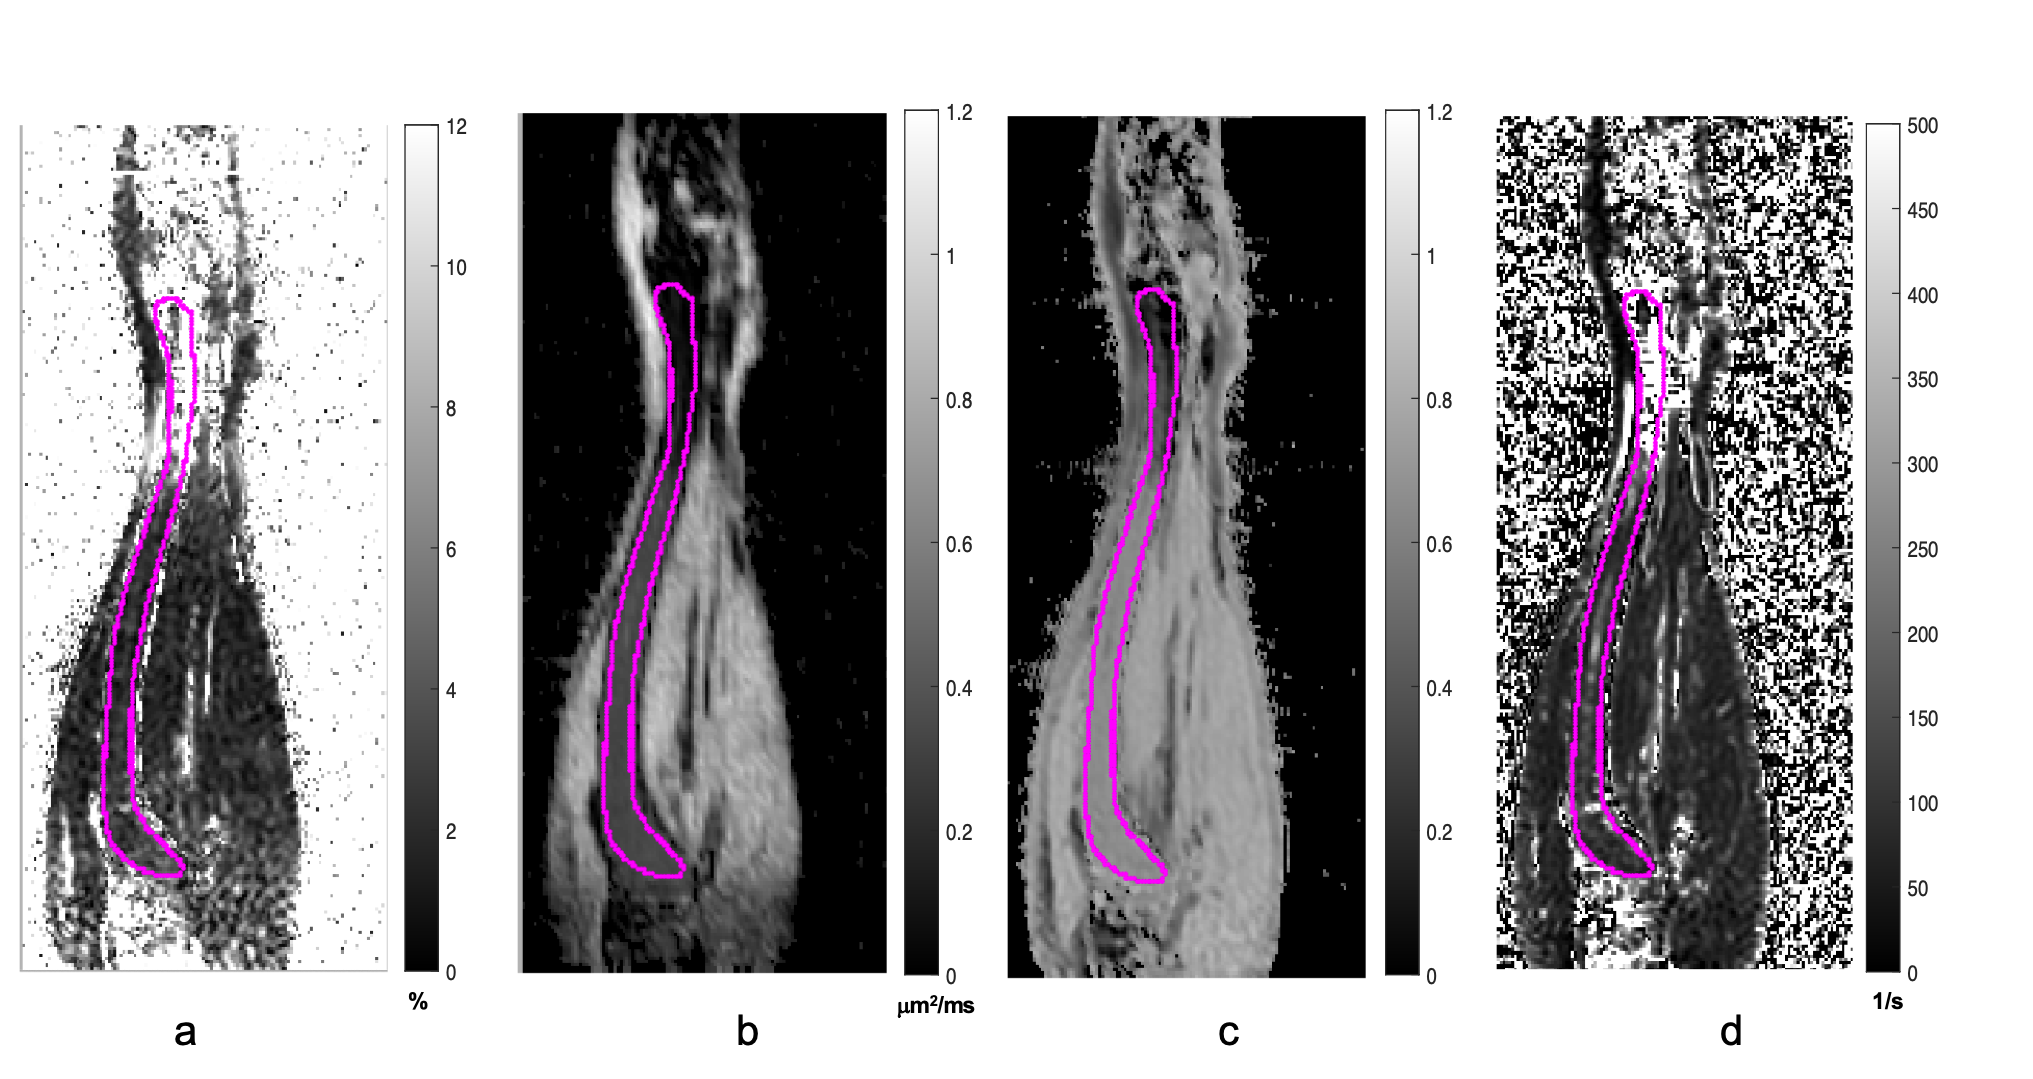
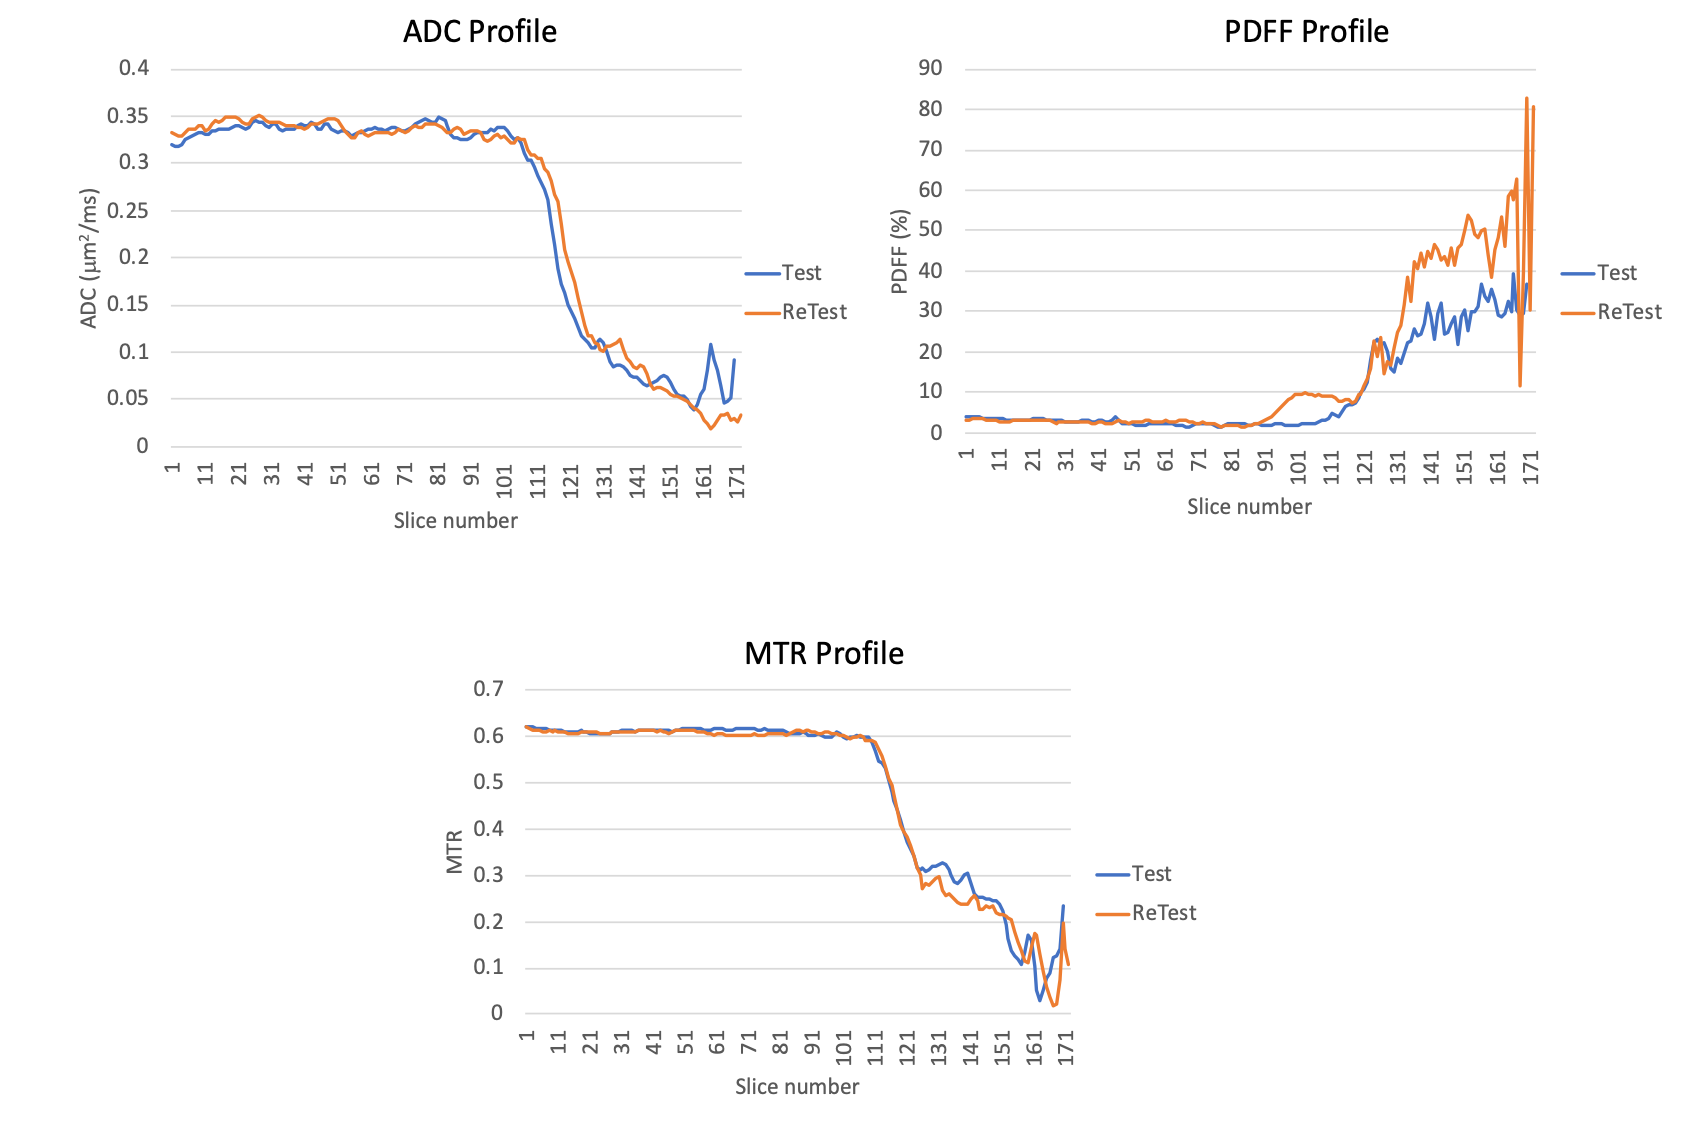
Figure 1 shows PDFF map of the phantom. Tubes with 2 mm ID provided closer approximations to the target fat percentages. Capillary tubes with ID of 0.5 mm established sensitivity of the technique (~0.18 x0.15 x0.18 mm3 voxels) for the tibial bone of similar size (BM compartment ID ~0.7 mm). Figure 2 displays a coronal slice of mouse tibia from the first time point for each reconstructed quantitative matric. Figure 3 displays the same mouse imaged a month after the baseline image. Slice by slice profiles aligned from the knee slice were plotted for each quantitative MR metric along the VOI in the tibia. Based on these profiles, the VOI was segmented into 3 sections. Figure 4 shows ADC, PDFF, and MTR profiles through all slices of a VOI for a test and retest time point. Mean values extracted from tibia sections were followed over the disease progression. Average mean values for the proximal section were (ADC=0.28±0.07μm2/ms, PDFF=5.0±2.98 %, MTR=0.5±0.06) at the baseline and changed to (ADC=0.32±0.03 μm2/ms, PDFF=3.3±1.88 %, MTR=0.6±0.03) a month after disease induction, displaying slight increase in ADC and MTR while decrease in PDFF.Acknowledgements
This work is supported by NIH Grant: U24 CA237683.References
1. Tefferi A. American J of hematology 91, 1262-1271 (2016)
2. Verstovsek S. et al. N Engl J Med 366, 799-807 (2012)
3. Luker G. et al. Tomography 2, 67-78 (2016).
4. Mullally A. et al. Cancer Cell, 17 584-96 (2010)
5. Klein S. et al. Med. Imaging 29 196–205 (2010)
6. Hernando D. et al. Magn. Reson. Med. 63 79-90 (2010)
Figures