2354
Prediction of early treatment response in patients with newly diagnosis multiple myeloma using WB-MRI: comparative study with and without anemia1Tianjin Academy of Traditional Chinese Medicine Affiliated Hospital, Tianjin, China, Tianjin, China, 2State Key Laboratory of Experimental Hematology, Institute of Hematology and Blood Diseases Hospital, CAMS and PUMC, Tianjin 300020, China, Tianjin, China, 3Tianjin First Central Hospital Affiliated To Nankai University, Tianjin, China, Tianjin, China, 4Philips healthcare,Beijing, China, Beijing, China
Synopsis
For patients with newly diagnosed multiple myeloma, red marrow reconversion caused by anemia is common,its hyperintense signal on DWI image could affect the evaluation , because it is very similar with the diffusion signal in focal lesions. We aim to evaluate the efficacy prediction of early treatment response in MM patients with and without anemia based on the tumor burden score (TBS), ADC value and signal fat fraction (sFF). We found that early treatment response of MM could be predicted in patients without anemia using TBS, ADC and sFF, anemia is a factor which must be taken into consideration in evaluation.
Synopsis
For patients with newly diagnosed multiple myeloma (MM), red marrow reconversion caused by anemia[1] is very common. Due to anemia, hyperintense signal on DWI image[2] could affect the evaluation of MM, because it is very similar with the diffusion signal in focal lesions. In this study, we aim to evaluate the efficacy prediction of early treatment response in MM patients with and without anemia based on the tumor burden score (TBS), ADC value and signal fat fraction (sFF). We found that early treatment response of MM could be predicted in patients without anemia using TBS, ADC and sFF acquired by whole body DWI and mDIXON MRI, and anemia is a factor which must be take into consideration in efficacy evaluation.Introduction
For patients with newly diagnosed multiple myeloma (MM), red marrow reconversion caused by anemia[1][L1] is very common. Due to anemia, hyperintense signal on DWI image[2] could affect the evaluation of MM, because it is very similar with the diffusion signal in focal lesions. In this study, we aim to explore the clinical value in prediction of early treatment response with the baseline WB-MRI quantitative parameters (whole body tumor burden score, ADC value and fat-signal fraction) in newly diagnosis MM with and without anemia based on Messiou C’s guideline[3].Materials and Methods
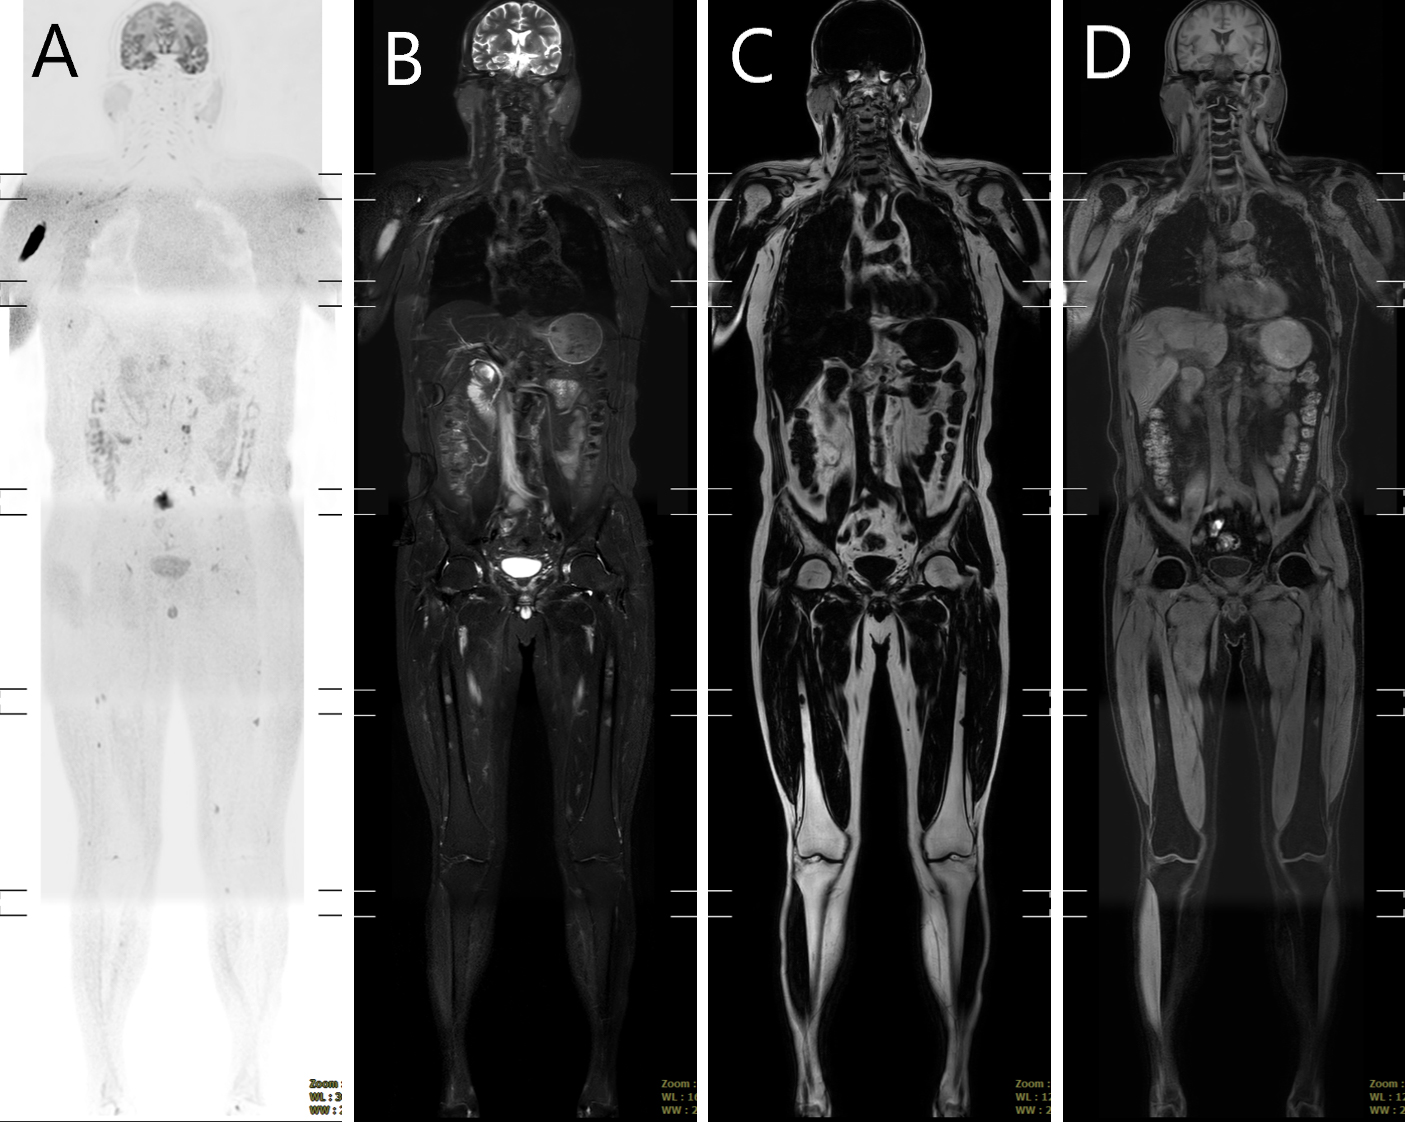
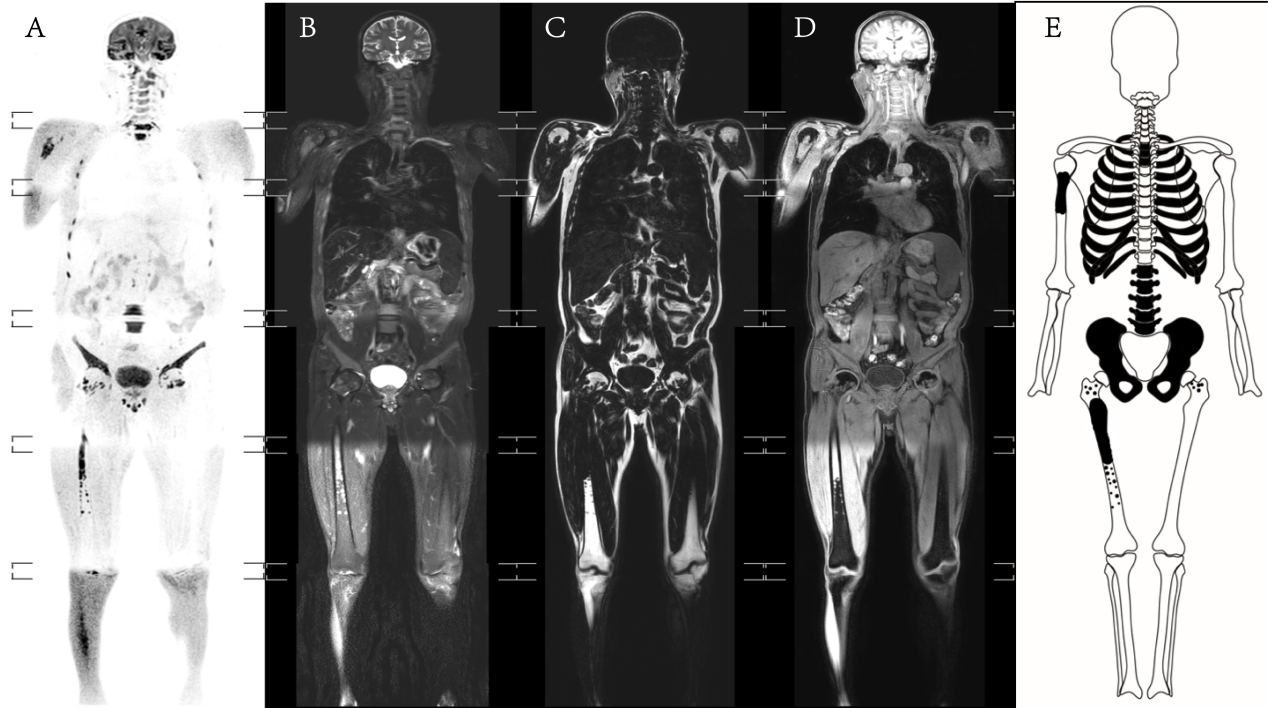
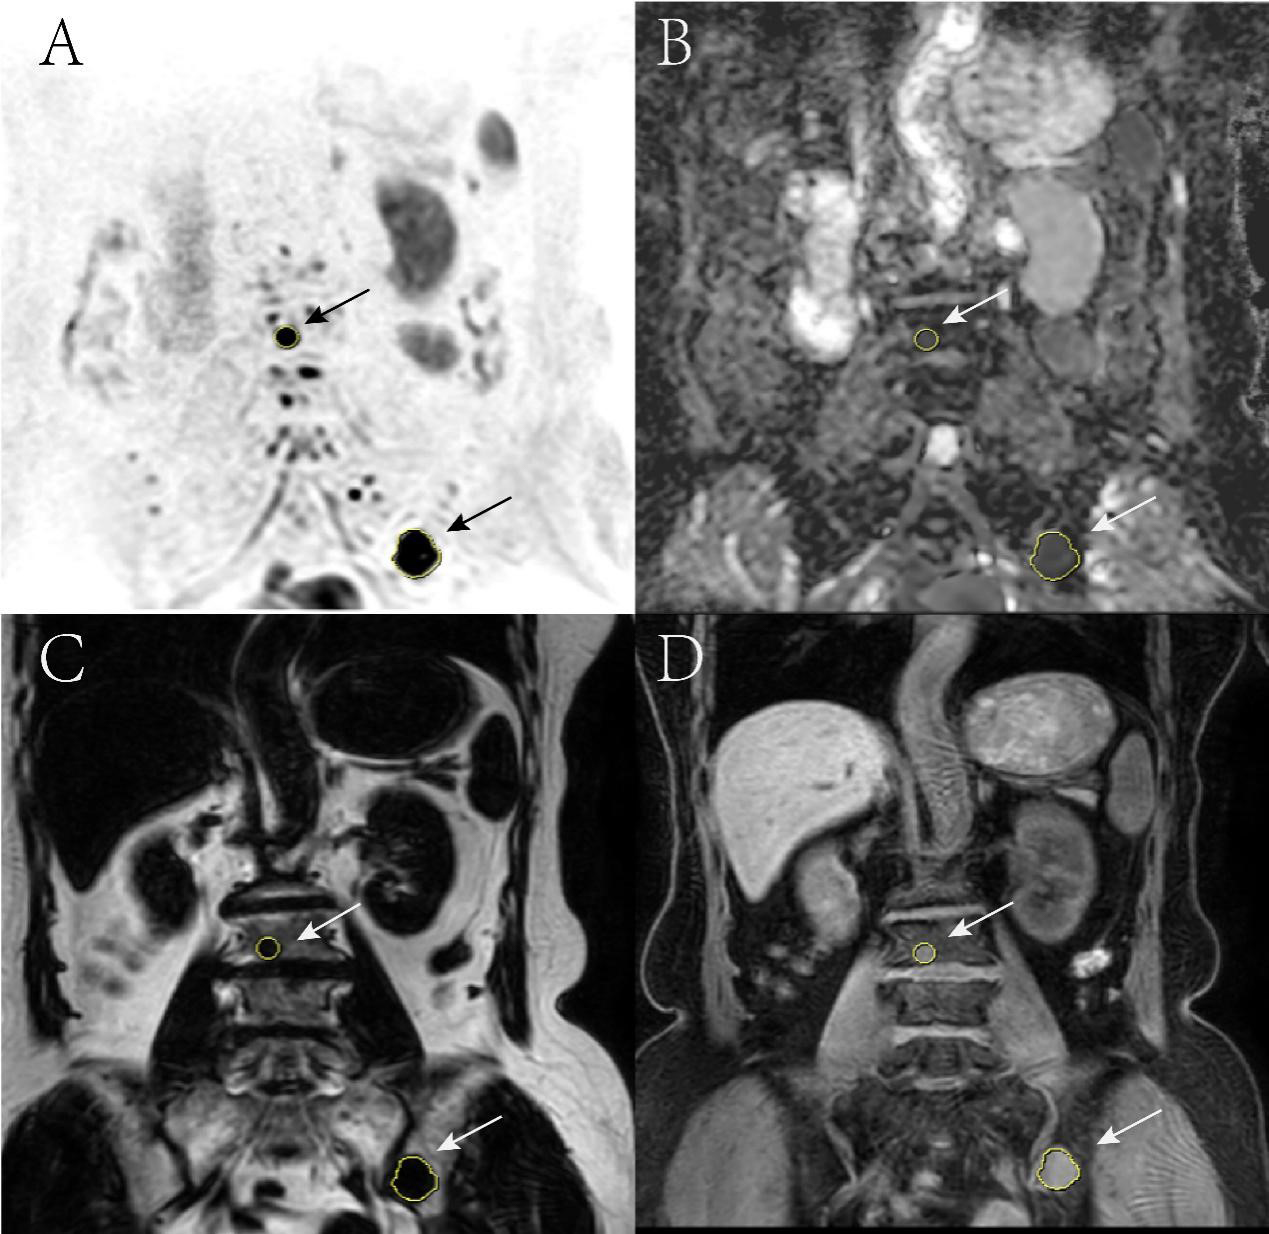
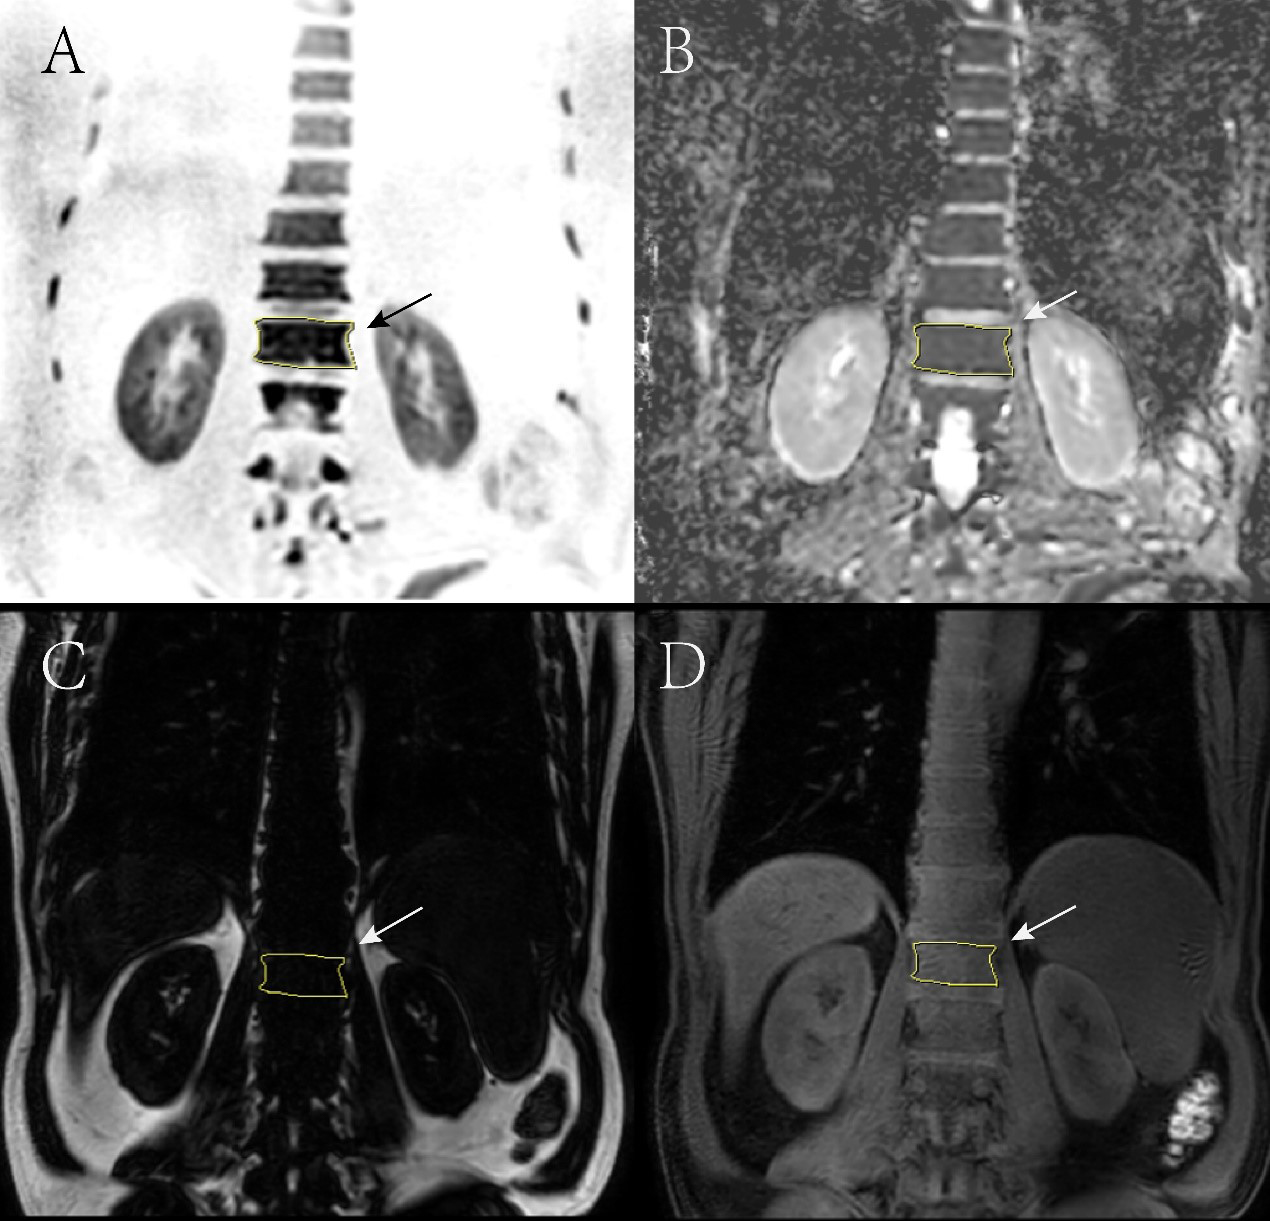
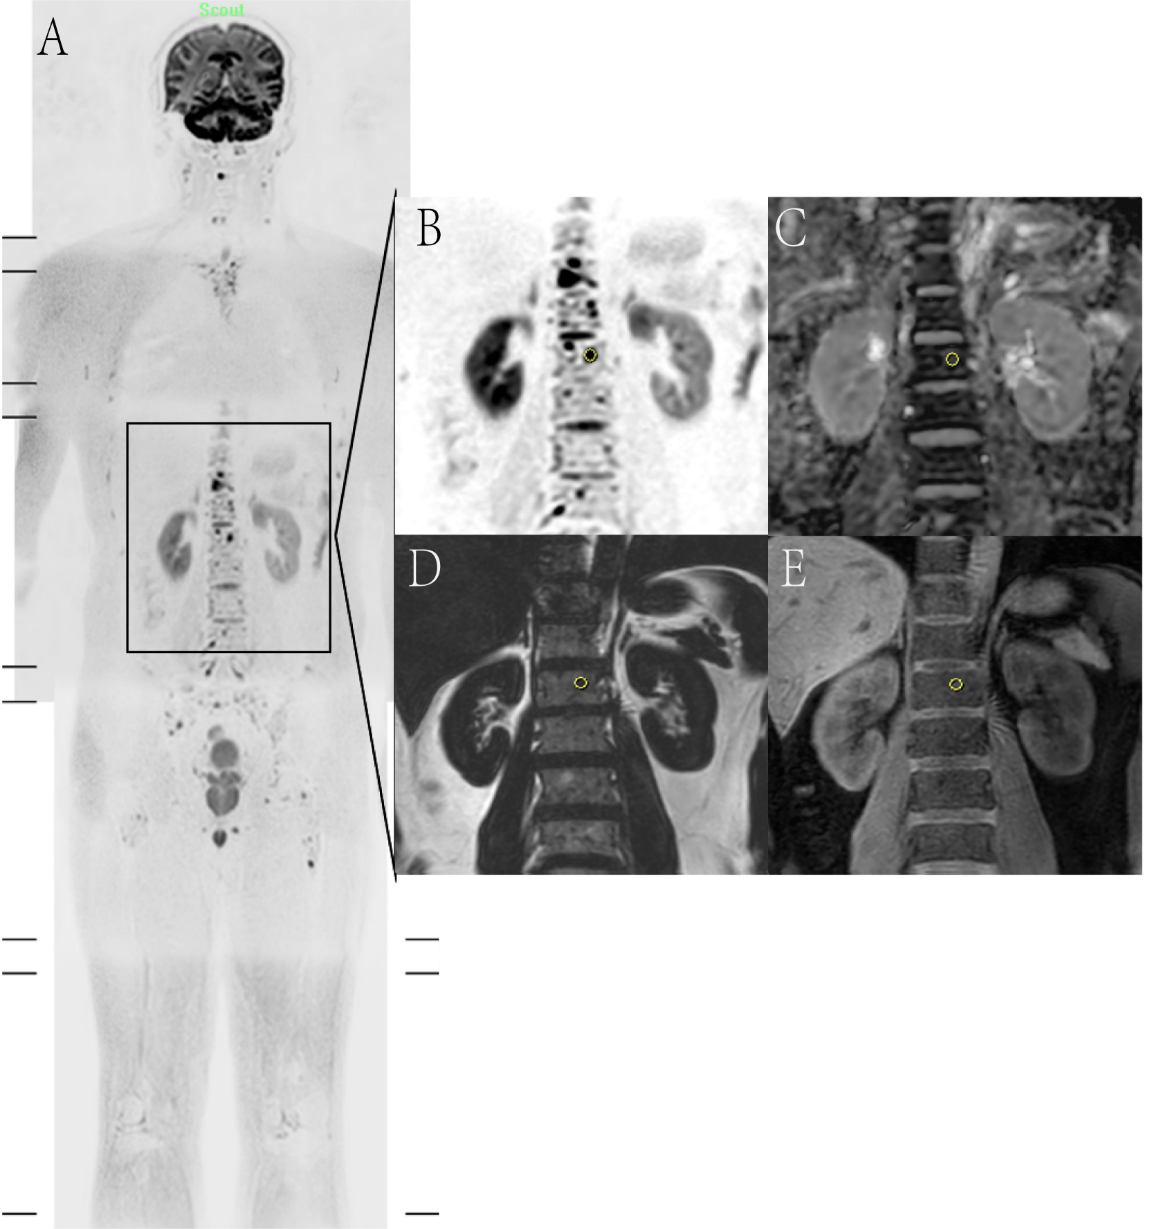
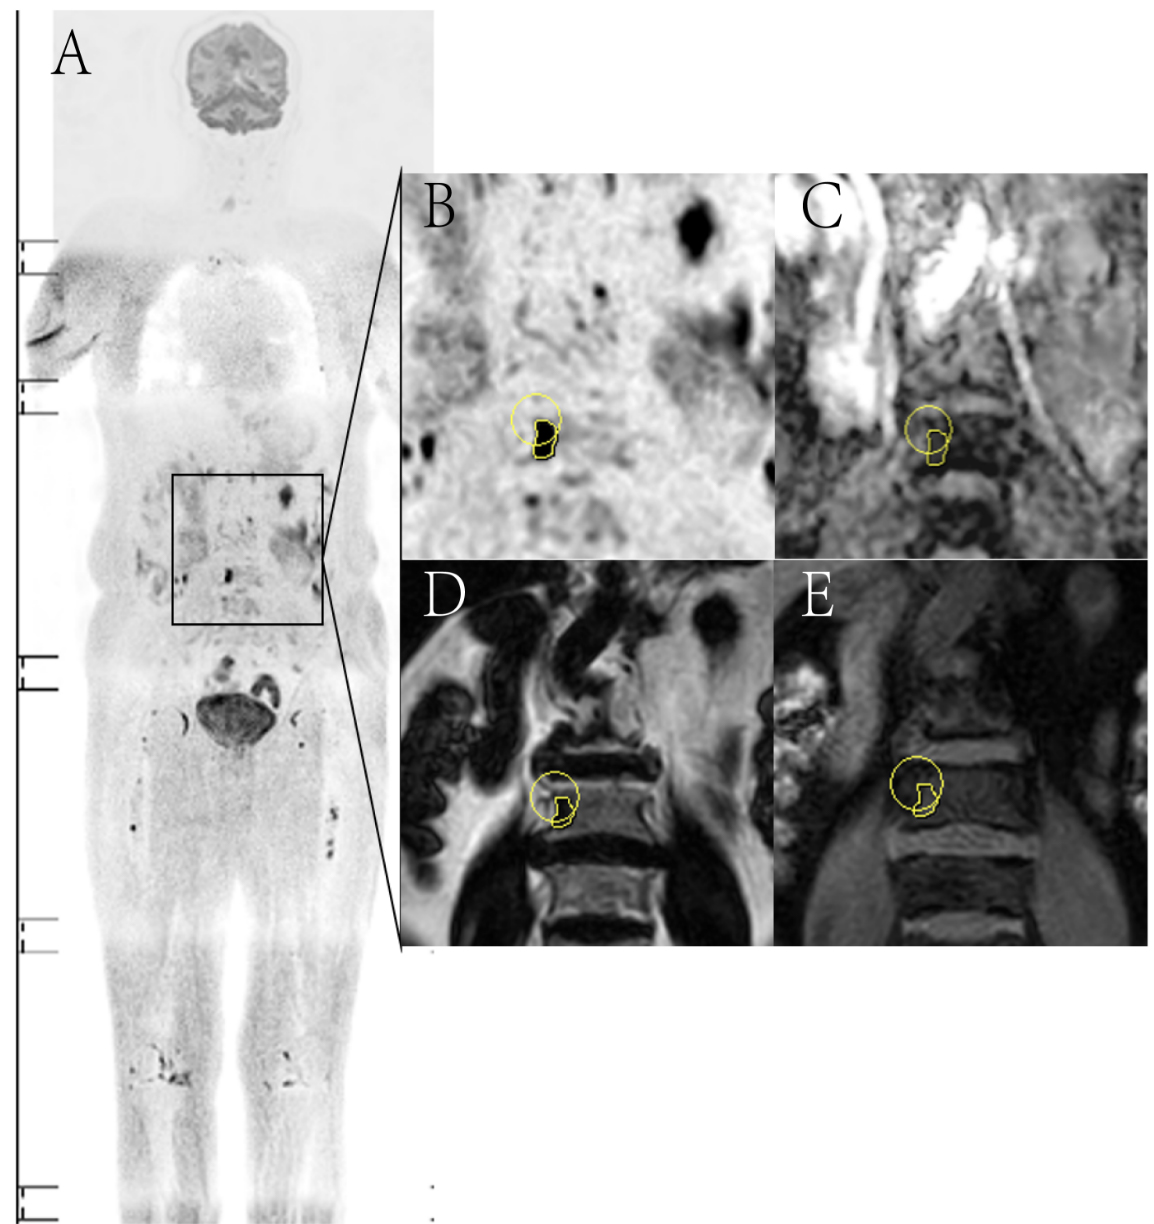
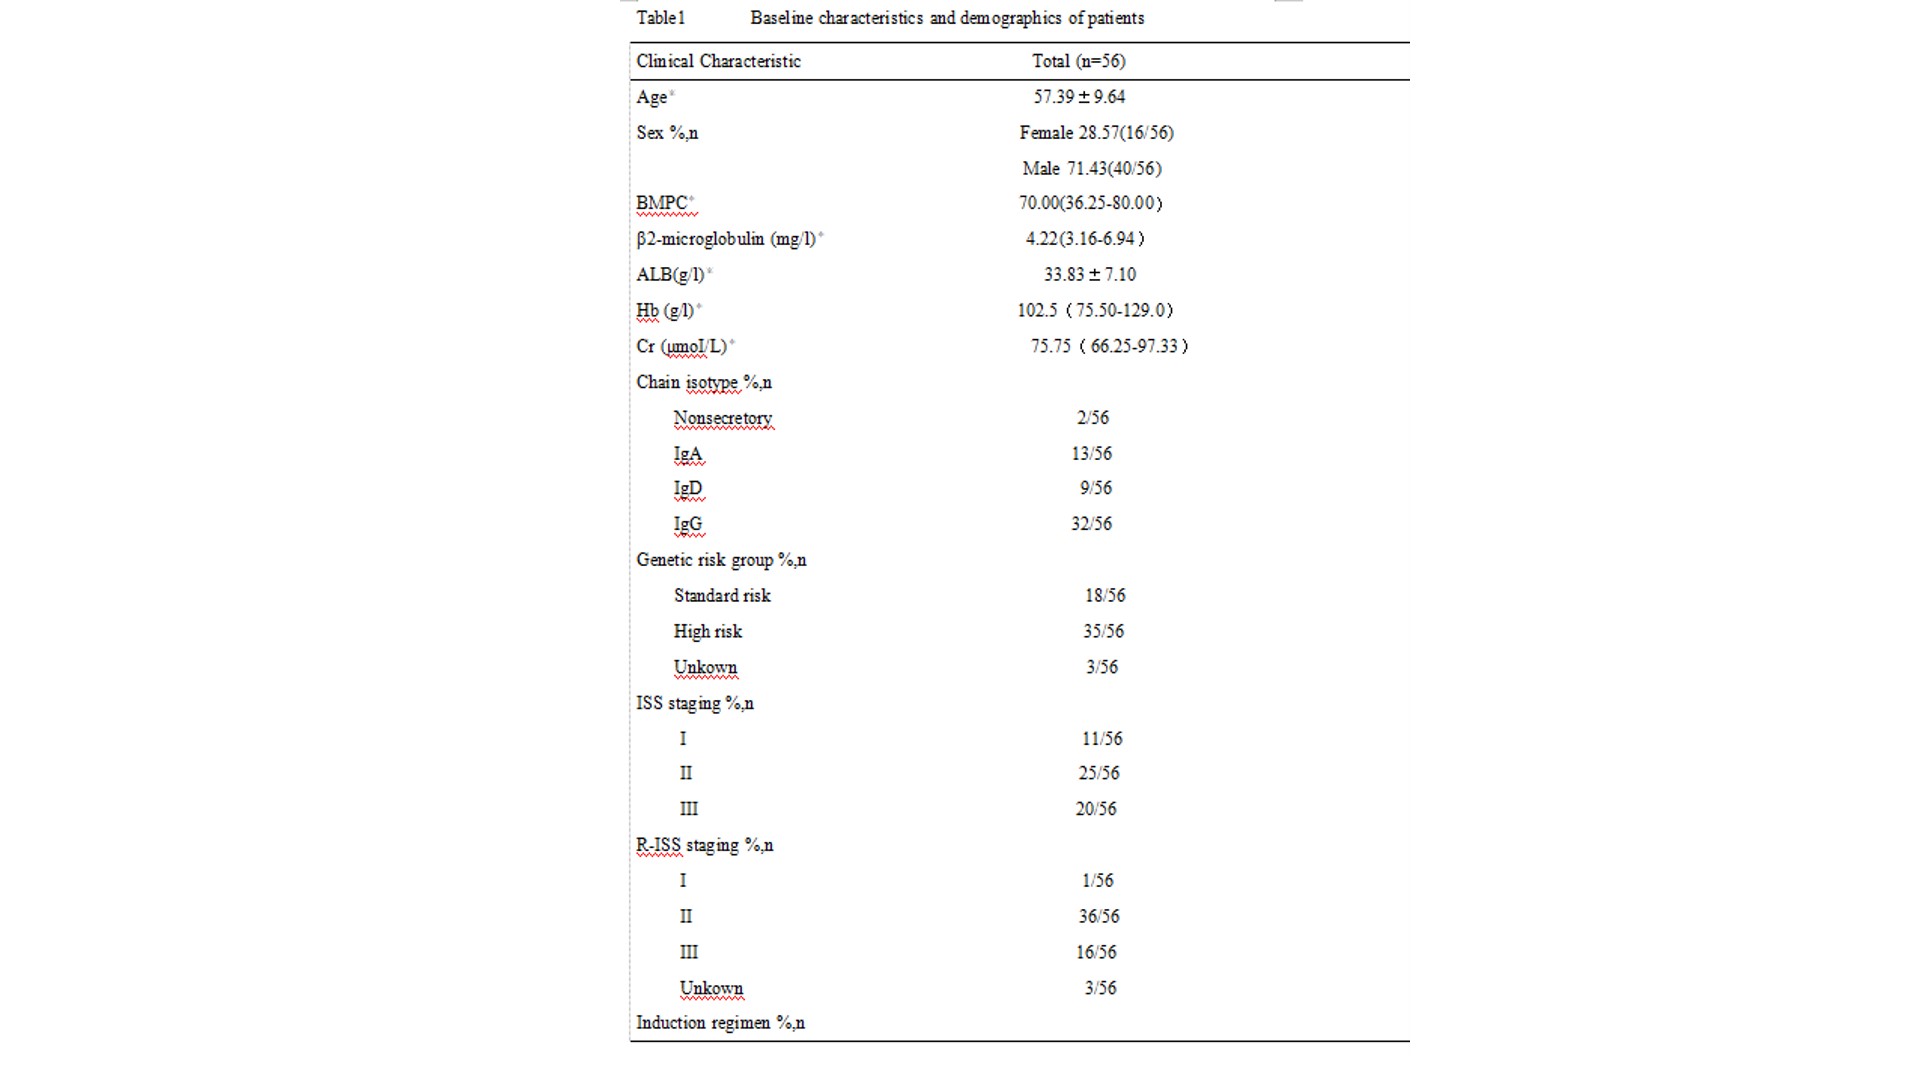
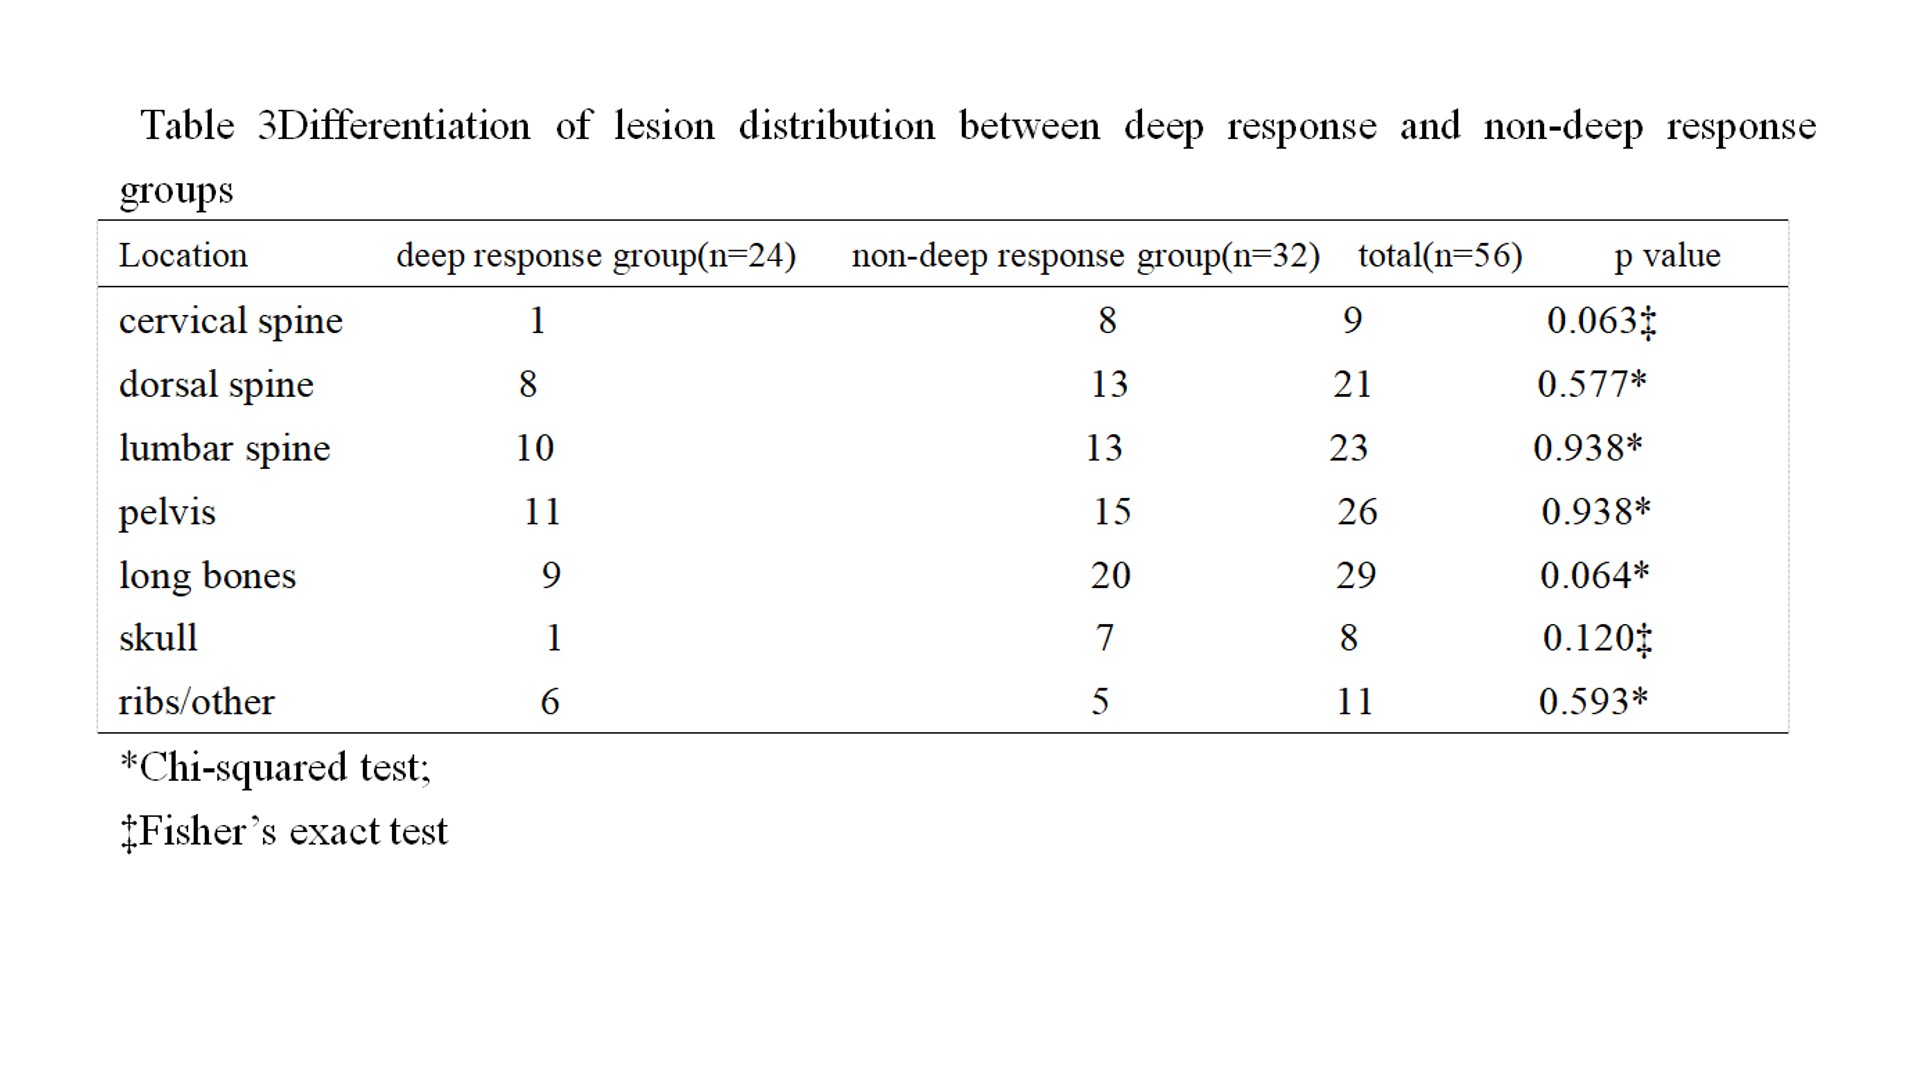
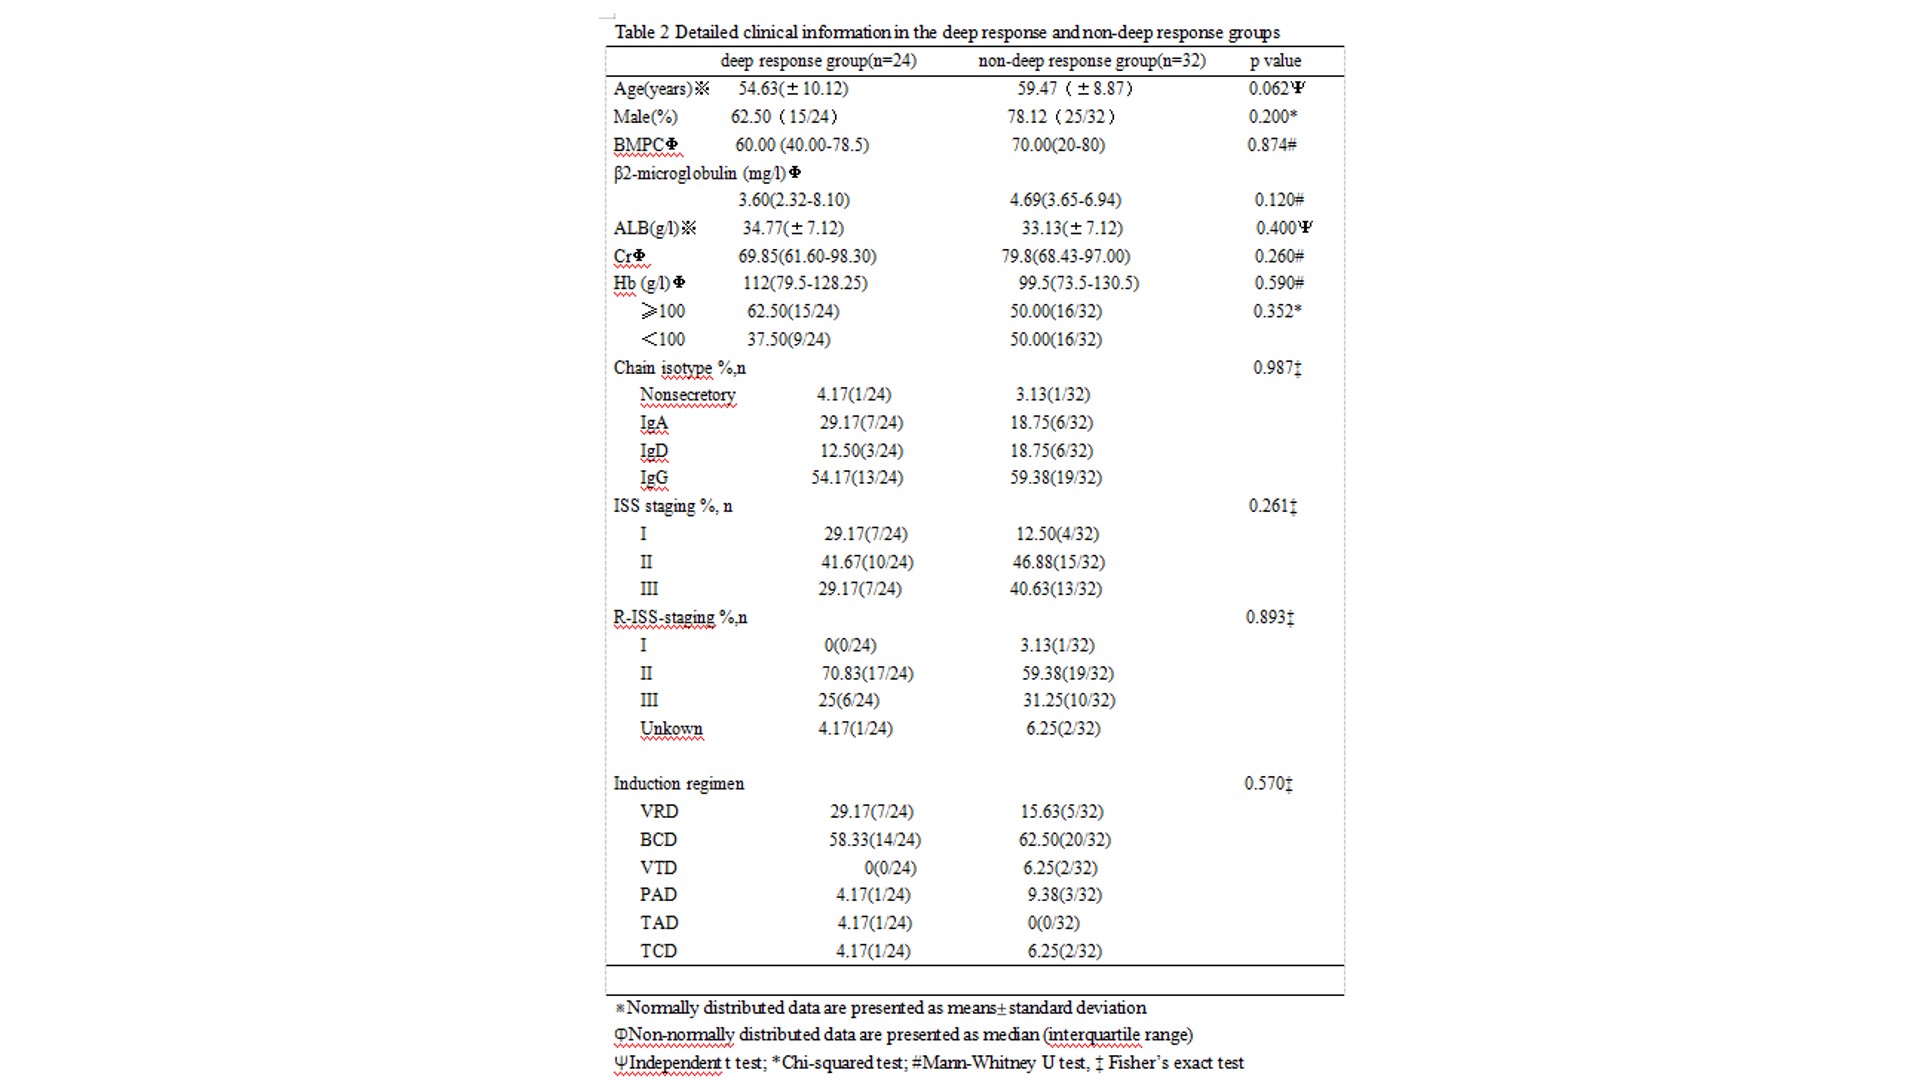
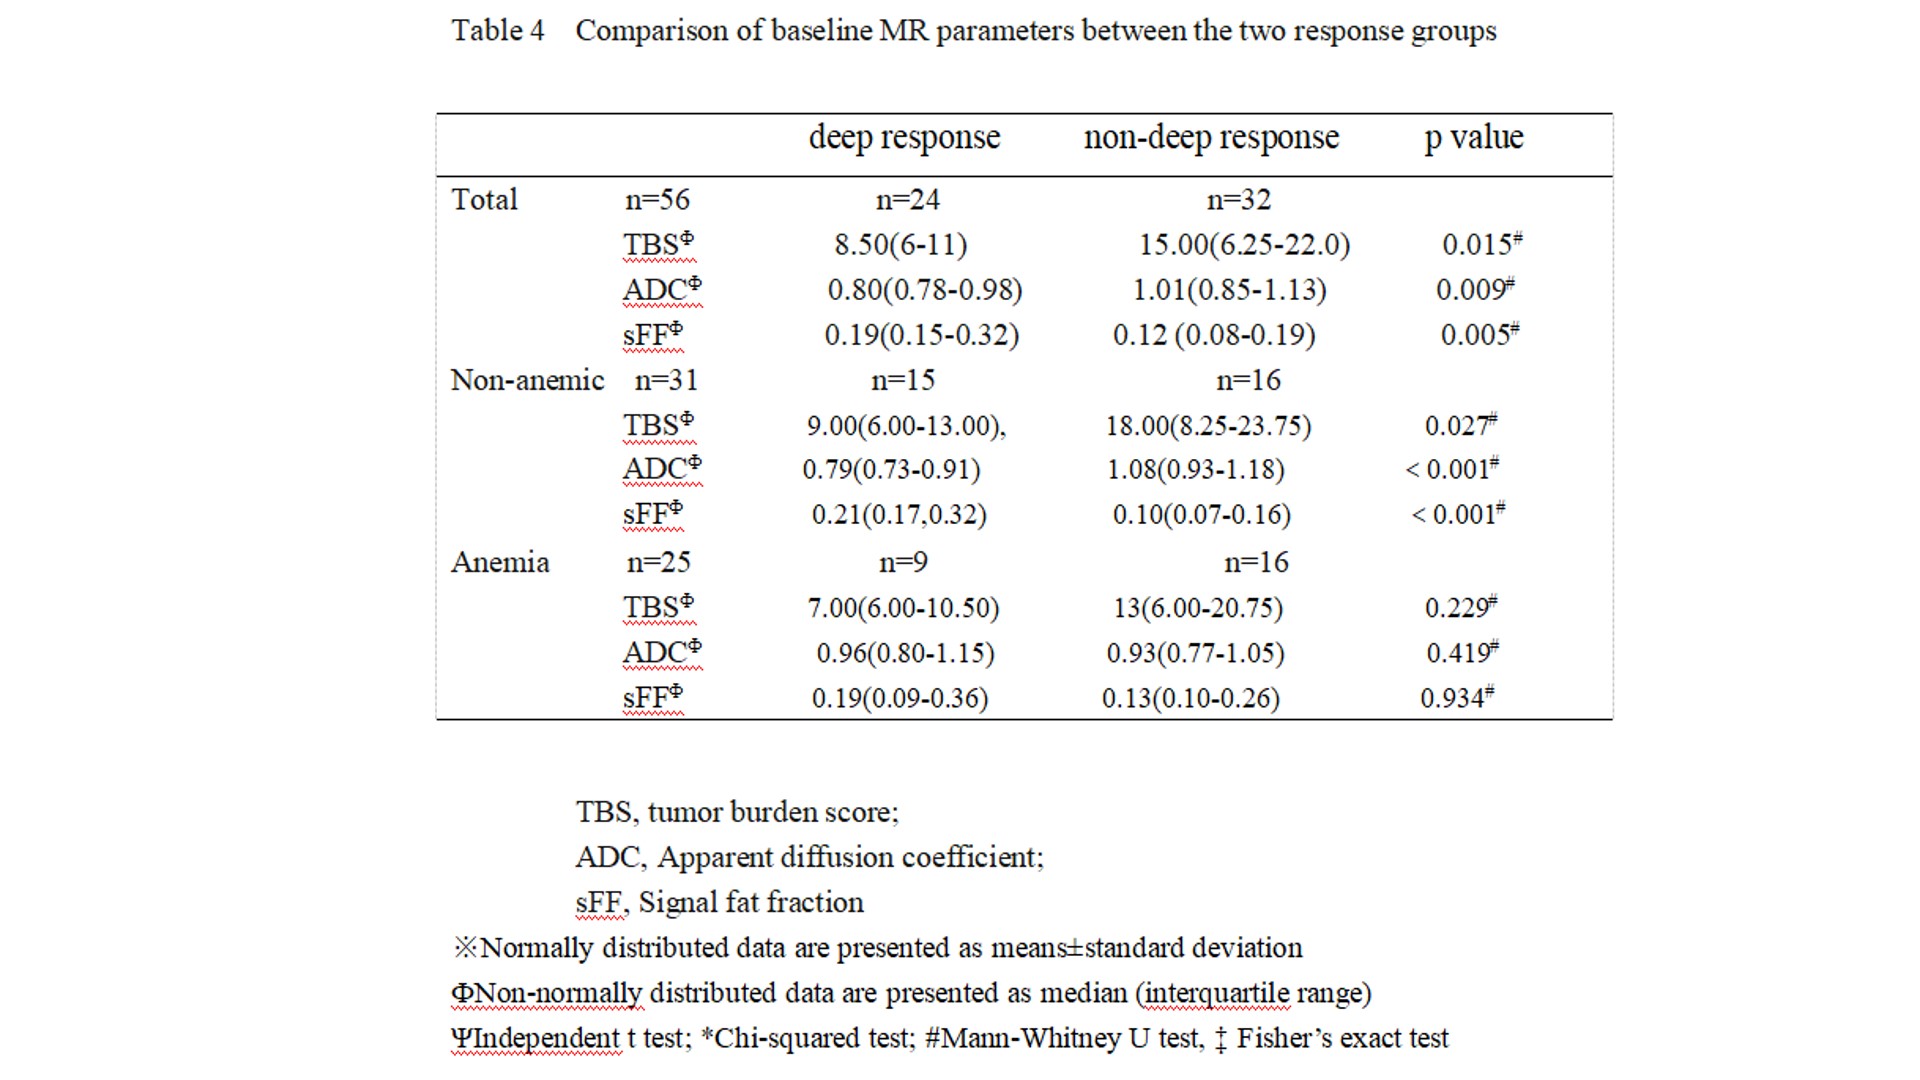
56 patients with multiple myeloma (40 males of aged 40-75 years, 16 females of aged 36-74 years) confirmed pathologically were collected from July 2015 to February 2019. All patients were performed MR examination on a 3T MR scanner (Ingenia, Philips, Best, The Netherland). The protocol included whole body DWI and T1 weighted-mDIXON examination before treatment. The tumor burden score (TBS) of each patient was evaluated based on Messiou C’s guideline[3]. 173 involved sites of diffuse lesion and 158 focal lesions of the whole body were detected and the corresponding ADC value, fat signal intensity (Mfat) and water signal intensity (Mwater) were extracted. The signal fat fraction (sFF) was also calculated by dividing the signal intensity in the fat image by the corresponding in-phase mDIXON image. The average values of ADC and sFF for each patient were calculated. The baseline clinical data (BMPC, β2-microglobulin, ALB, Hb, Cr, ISS-stage and so on) were also recorded. After 4 cycles of induction, treatment response was assessed at the start of each cycle and at the end of induction. Deep response group and non-deep response group were divided according to Stringent complete remission (sCR), complete response (CR), very good partial response (VGPR) , partial response (PR), minimal response (MR) and stable disease (SD) . According to whether the patient’s hemoglobin is less than 100g/l, we performed subgroup analysis. Student’s t test and Mann-Whitney U test were used to compare the differences between two response groups among clinical data and imaging parameters . Chi-square test or Fisher’s exact test was used to compare categorical variables of patients’ characteristics. The relationship between treatment response and TBS, ADC and sFF was assessed using Spearman’s correlation analysis. Receiver operating characteristics (ROC) curves were plotted for each MRI parameter and optimal cutoff points were determined based on the maximum Youden index.Result
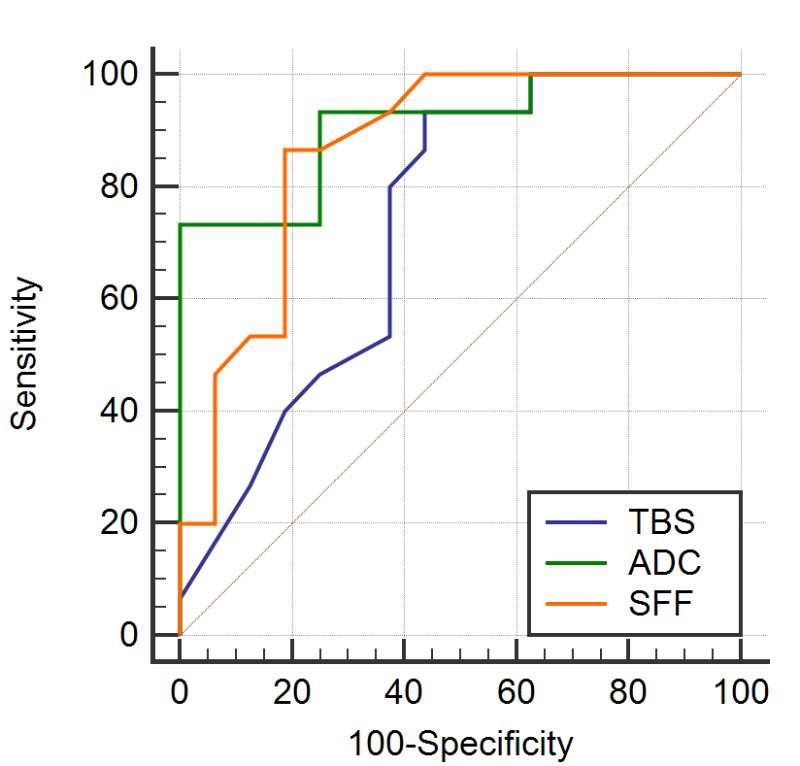
For non-anemic patients, there was moderate negative correlation between TBS and depth of response (r=-0.405), strong negative correlation between ADC value and depth of response (r=-0.707), and positive high correlation between sFF and depth of response (r=0.635). Receiver Operator Characteristic analysis indicated that baseline TBS, ADC value and sFF could be treat as the biomarkers for an superior response(≥VGPR) with AUC of 0.773, 0.908 and 0.867. The corresponding cut-off value was TBS of 16.0, ADC of 0.844 ×10⁻³ mm2/s and sFF of 0. 148. However, none relationship was found above three parameters with the response depth for anemia patients.Discussion and Conclusion
The combined effects of plasma cells infiltration, red bone marrow and yellow bone marrow may affect TBS, ADC and SFF value. For anemia patients, in spite of the less plasma cell bone marrow infiltration, a wide range of abnormal signals can still be seen on the whole-body MRI image, which may interference a successful prediction of early treatment response using baseline WB-MRI quantitative parameter.Our result indicates that the baseline TBS, ADC value and sFF have potential as a noninvasive imaging biomarker for predicting the early treatment response of newly diagnosis MM without anemia. Anemia is a factor which must be take into consideration in efficacy evaluation.Acknowledgements
Funding: This study was supported by the National NaturalScience Fund (81871342) (Shuang Xia) and the NationalKey Research and Development (2019YFC0120903)(Shuang Xia).References
[1] Ormond Filho AG, Carneiro BC, Pastore D, et al. Whole-Body Imaging of Multiple Myeloma: Diagnostic Criteria. Radiographics. 2019. 39(4): 1077-1097.
[2] Padhani AR, van Ree K, Collins DJ, D'Sa S, Makris A. Assessing the relation between bone marrow signal intensity and apparent diffusion coefficient in diffusion-weighted MRI. AJR Am J Roentgenol. 2013. 200(1): 163-70.
[3] Messiou C, Hillengass J, Delorme S, et al. Guidelines for Acquisition, Interpretation, and Reporting of Whole-Body MRI in Myeloma: Myeloma Response Assessment and Diagnosis System (MY-RADS). Radiology. 2019. 291(1): 5-13.
Figures