2351
R2* value derived from multi-echo Dixon technique can aid discrimination between benign and malignant focal liver lesions1Radiology, Sun Yat-Sen Memorial Hospital, Sun Yat-Sen University, Guangzhou, China, 2Department of MR Scientific Marketing, Siemens Healthineers, Guangzhou, China
Synopsis
R2* derived from multi-echo Dixon imaging is a potential biomarker to differentiate malignant from benign FFLs. R2* value of malignant FLLs was significantly higher than that of the benign FLLs. The multi-echo Dixon sequence is easy to perform and required only a single breath-hold of 16 s to image the entire liver, which holds a good potential for clinical application.
Introduction
Clinically, once a focal liver lesion (FLL) is identified, it is essential to distinguish between benign and malignant lesions, as this differentiation determines the individual’s prognosis and subsequent treatment strategy[1]. R2* estimation reflects the paramagnetism of the tumor tissue[2,3], which may be used to differentiate between benign and malignant liver lesions when the contrast agents is contraindicated.To investigate whether R2* derived from multi-echo Dixon imaging can aid differentiating benign from malignant focal liver lesions (FLLs) and the impact of 2D region of interest (2D-ROI) and volume of interest (VOI) on the outcomes.Methods
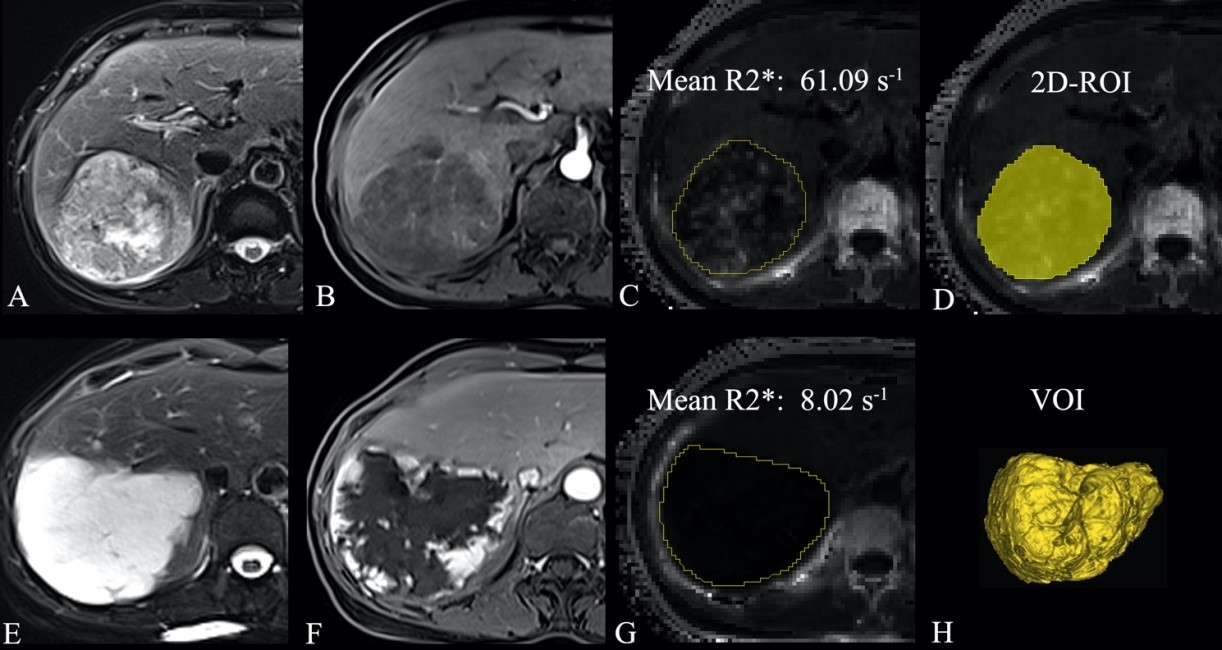
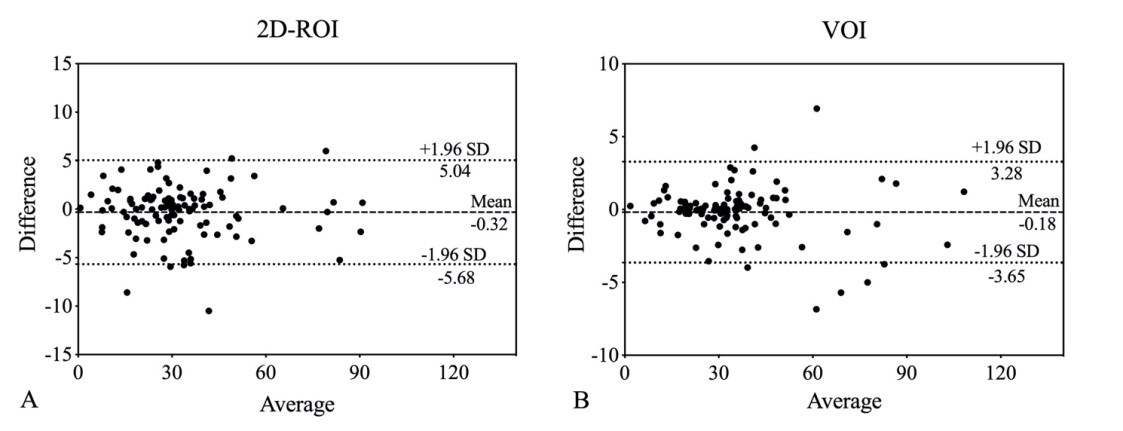
We retrospectively enrolled 73 patients with 108 benign or malignant FLLs. All patients underwent conventional abdominal magnetic resonance imaging and multi-echo Dixon imaging. Two radiologists independently measured the mean R2* values of lesions using 2D-ROI and VOI approaches. The Bland–Altman plot was used to determine the interobserver agreement between R2* measurements. Intraclass correlation coefficient (ICC) was used to determine the reliability between the two readers. Mean R2* values were compared between benign and malignant FFLs using the nonparametric Mann–Whitney test. Receiver Operating Characteristic curve analysis was used to determine the diagnostic performance of R2* in differentiation between benign and malignant FFLs. We compared the diagnostic performance of R2* measured by 2D-ROI and VOI approaches.Results
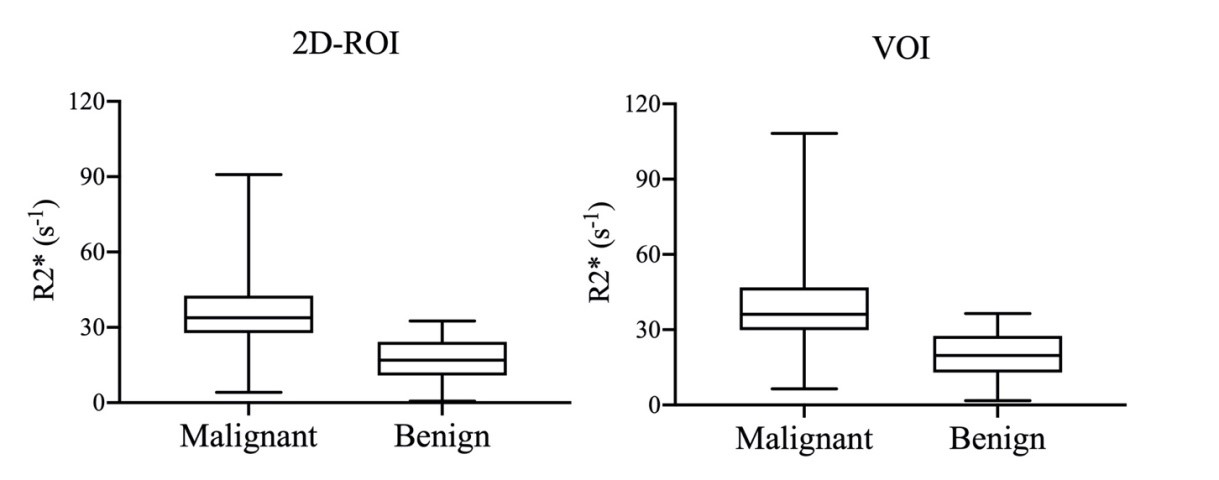
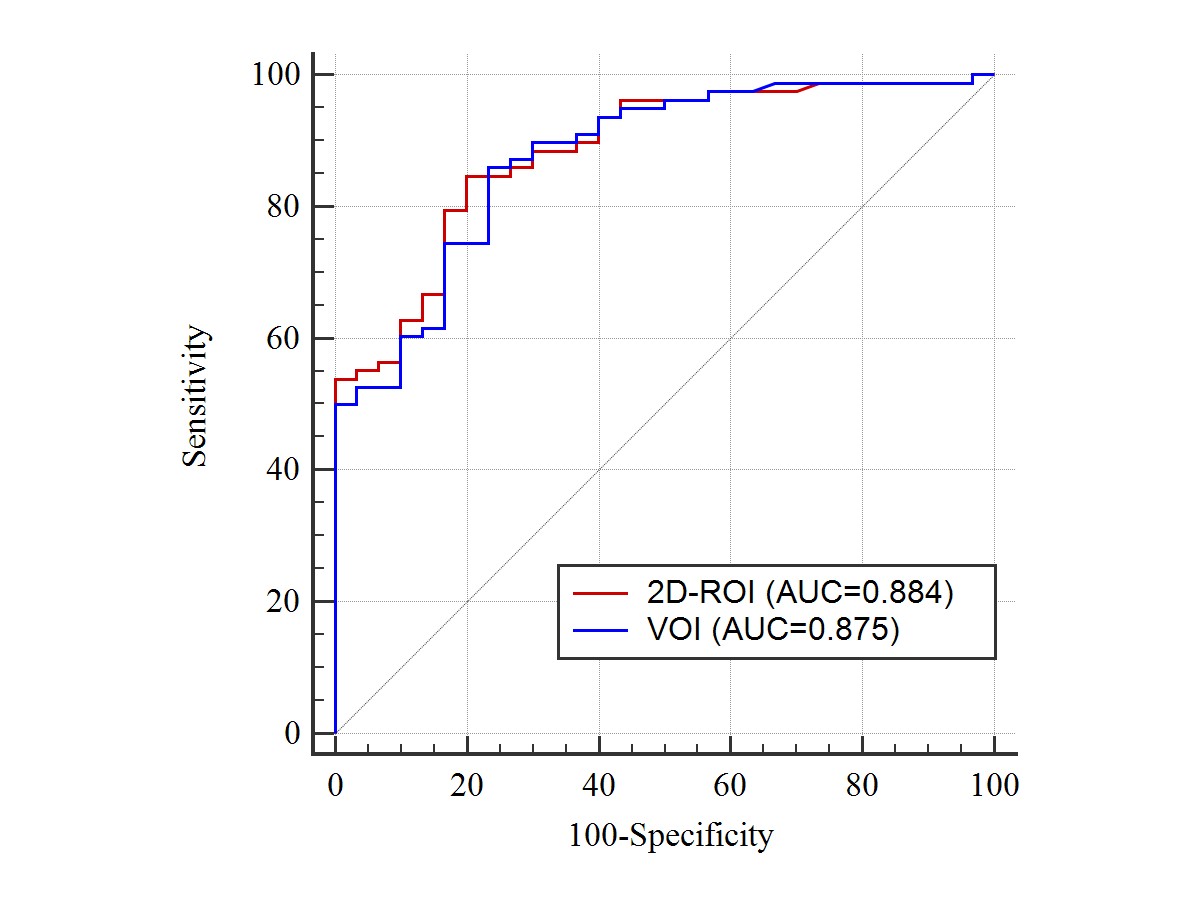
The study included 30 benign and 78 malignant FLLs. The interobserver reproducibility of R2* measurements was excellent for the 2D-ROI (ICC = 0.994) and VOI (ICC = 0.998) methods. Bland–Altman analysis also demonstrated excellent agreement. Mean R2* was significantly higher for malignant than benign FFLs as measured by 2D-ROI (P < 0.001) and VOI (P < 0.001). The AUC of R2* measured by 2D-ROI was 0.884 at a cut-off of 25.2/s, with a sensitivity of 84.6% and specificity of 80.0% for differentiating benign from malignant FFLs. R2* measured by VOI yielded an area under the curve (AUC) of 0.875 at a cut-off of 26.7/s in distinguishing benign from malignant FFLs, with a sensitivity of 85.9% and specificity of 76.7%. The AUCs of R2* were not significantly different between the 2D-ROI and VOI methods.Conclusion
R2* derived from multi-echo Dixon imaging whether by 2D-ROI or VOI can aid in differentiation between benign and malignant FLLs.Acknowledgements
No acknowledgement found.References
1 Dong Y, Zhang XL, Mao F, Huang BJ, Si Q, Wang WP. Contrast-enhanced ultrasound features of histologically proven small (≤20 mm) liver metastases. Scand J Gastroenterol 2017; 52: 23-28
2 Schmeel FC, Luetkens JA, Feißt A, Enkirch SJ, Endler CH, Wagenhäuser PJ, Schmeel LC, Träber F, Schild HH, Kukuk GM. Quantitative evaluation of T2* relaxation times for the differentiation of acute benign and malignant vertebral body fractures. Eur J Radiol 2018; 108: 59-65
3 Liu M, Guo X, Wang S, Jin M, Wang Y, Li J, Liu J. BOLD-MRI of breast invasive ductal carcinoma: correlation of R2* value and the expression of HIF-1α. Eur Radiol 2013; 23: 3221-3227
Figures