2349
Simultaneous recording of the uptake and conversion of glucose and choline in tumors by deuterium MR
Andor Veltien1, Sjaak van Asten1, Nia Ravichandran1, Robin de Graaf2, Henk de Feyter2, Jeannette Oosterwijk3, Egbert Oosterwijk3, and Arend Heerschap1
1Medical Imaging, Radboud UMC, Nijmegen, Netherlands, 2Radiology and biomedical imaging, Yale University, New Haven, CT, United States, 3Urology, Radboud UMC, Nijmegen, Netherlands
1Medical Imaging, Radboud UMC, Nijmegen, Netherlands, 2Radiology and biomedical imaging, Yale University, New Haven, CT, United States, 3Urology, Radboud UMC, Nijmegen, Netherlands
Synopsis
Increased glucose and choline uptake are hallmarks of cancer. In this
study we demonstrated that it is possible to follow the uptake
and to image the presence of [2H9]choline in tumors after
a bolus administration of this compound. In addition we demonstrated the
successful performance of DMI simultaneously of [2H9]choline
and of [6,6 2H2]glucose. As DMI of glucose uptake and its
metabolic conversions has been shown to be feasible in patients, the
simultaneous performance of choline DMI next to glucose DMI is an important
complementary extension with clinical potential.
Introduction
Enhanced glucose uptake is a hallmark of malignant tumors. For diagnostic purposes this is traditionally imaged by 18FDG-PET [1], but recently it also has become possible by MR deuterium metabolic imaging (DMI) using non-radioactive [6,6 2H2]glucose [2]. DMI has several advantages, e.g. by tracking 2H it provides a quantitative biomarker for the Warburg effect [2,3]. Enhanced choline uptake is another hallmark of cancer and the presence of choline compounds in tumors has been assessed by 18F or 11C choline PET and by MR spectroscopy methods [4,5,6]. 11C choline-PET often identifies tumors better than FDG-PET [7]. The aims of this study were to demonstrate 1. that DMI can monitor [2H9]choline uptake in renal tumor models 2. that simultaneous recording of the uptake and conversion of glucose and choline in these tumors by DMI is possible.Methods
Renal tumors were grown subcutaneously in mice up to ~155 mm3 in size. Mice were aneasthesized with isoflurane. They were IV injected with 12 μg atropine to prevent a cholinergic reaction. Then we infused 0.05gr/kg [2H9]choline in a 0.16 ml saline solution IV in ~15 sec, or a 0.05gr/kg [2H9]choline with 1.3gr/kg [6,6 2H2]glucose combination in a 0.3 ml saline solution IV in ~20 sec. MR was performed on a Bruker Biospec at 11.7T with a home-built 1H/2H coil. After 1H reference imaging and shimming, DMRS was performed with an excitation pulse angle of 900 and a TR = 500 ms. 3D DMI was performed with a nominal spatial resolution of 2x2x2 mm, TR = 400 ms, TE = 0.4 ms and total acquisition time of 36 minutes. Data was processed in DMIWizard. Absolute tissue concentrations were determined using the HOD signal as reference assuming an initial HOD concentration of 13.7mM.Results and Discussion
After a 15s infusion of 2H9 choline a 2H signal appeared at ~3.2 ppm, well separated from that of HOD, which we assign to choline compounds. It increased to a maximum level of ~1 mM [2H9]choline at ~5 min post-infusion and then slowly decreased to ~0.6 mM at 100 min post-infusion (Fig. 1). The HOD signal remained almost constant, which is expected for choline breakdown with little water formation (Fig. 1). No other clear signals were observed except for possibly a small signal adjacent to the choline signal, which may be betaine the primary breakdown product of choline [5]. A DMI obtained at 60 min showed a clear spot for choline in the tumor (Fig. 1). DMI results of a [2H9]choline and [6,6 2H2]glucose phantom demonstrate that their signals can be separately observed (Fig. 2a). After a 20 sec infusion of a solution with [2H9]choline and [6,6 2H2]glucose in a mouse the 2H MR spectra of the tumor clearly show separated signals for these compounds and also for deuterated lactate (Fig. 2b). In 2H NMR spectra of blood taken at 15 min or longer after infusion no choline signal could be detected in agreement with the rapid half-life of administered choline [8] and validating that in vivo the 3.2 ppm signal arises from the tumor and not blood (Fig 3).Conclusions
We developed a successful protocol to follow the uptake and to image the presence of [2H9]choline in tumors after a bolus administration of this compound. In addition we were able to perform DMI simultaneously of [2H9]choline and of [6,6 2H2]glucose. As DMI of glucose uptake and its metabolic conversions has been shown to be feasible in patients [2], the simultaneous performance of choline DMI next to that of glucose is an important complementary extension with clinical potential.Acknowledgements
No acknowledgement found.References
1 Gambhir, S. Molecular imaging of cancer by positron emission tomography. Nat Rev Cancer, 2002, 2 (9), 683 2. De Feyter, H, Behar, K, Corbin et al. Sci. Adv. 2018, (8)4, 7314 3. Kreis F, Wright AJ, Hesse F, Fala M, Hu D, Brindle KM. Radiology 2019, 294(4) 267 4. Glunde K, Bhujwalla Z, Ronen S. Choline metabolism in malignant transformation. Nat Rev Cancer 2011, 11, 835 5 Evangelista L, Briganti A, Fanti S, Joniau S, Reske S, Schiavina R, Stief C, Thalmann GN, Picchio M. New Clinical Indications for 18F/11C-choline, New Tracers for Positron Emission Tomography and a Promising Hybrid Device for Prostate Cancer Staging: A Systematic Review of the Literature. Eur Urol. 2016 Jul;70(1):161. 6 Katz-Brull R, Margalit R, Bendel P, Degani H. Choline metabolism in breast cancer. 2H, 13C and 31P NMR studies of cells and tumors. MAGMA 1998, 6, 44 7. Hara T. Mol Imaging Biol 2002, 4(4), 267 8. Freeman JJ, Choi RL, Jenden DJ. J of Neurochemistry 1975, 24, 729Figures
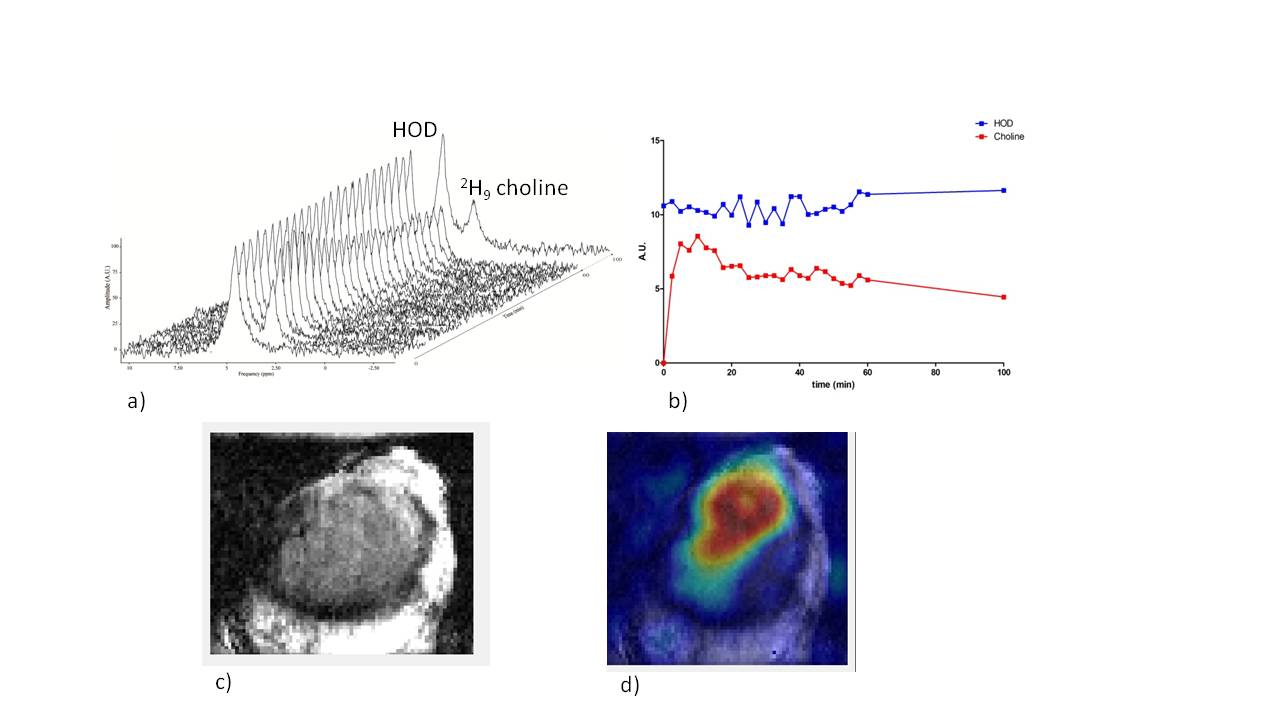
Figure 1.
a) 2H MR spectra
of subcutaneous tumor after injection of 2H9 choline.
b)Time curves of HOD and 2H9
choline signal integrals
c) T2
weighted MRI of subcutaneous tumor. d) 2H9 choline heat
map overlaid on T2 weighted MRI
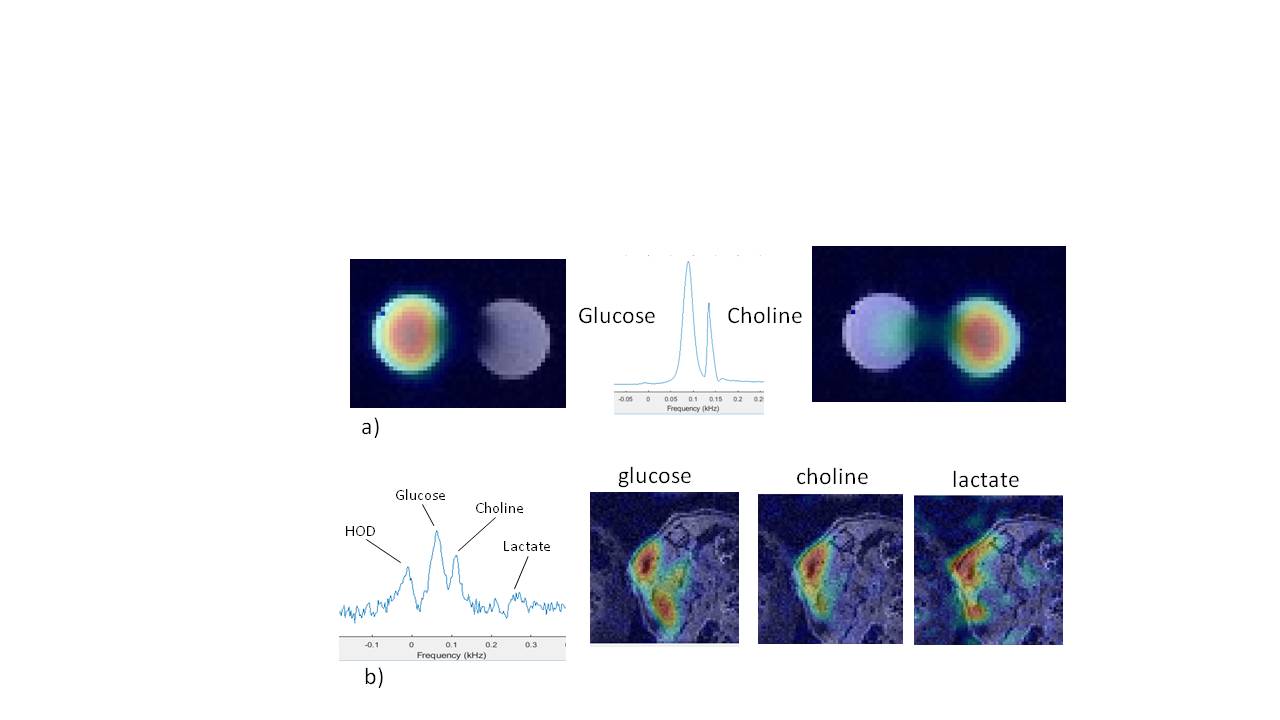
Figure 2
a) DMI of phantom with two tubes, one filled with 2H9 choline and the other with
[6,6 2H2]glucose. The glucose and choline signals are
clearly separated in the 2H spectrum
b) Left: 2H spectrum of renal tumor
after IV bolus infusion of 2H9 choline and [6,6 2H2]glucose
combined in the tail vein of a mouse. Right DMI maps of deuterated glucose,
choline and lactate overlaid on T2 MRI
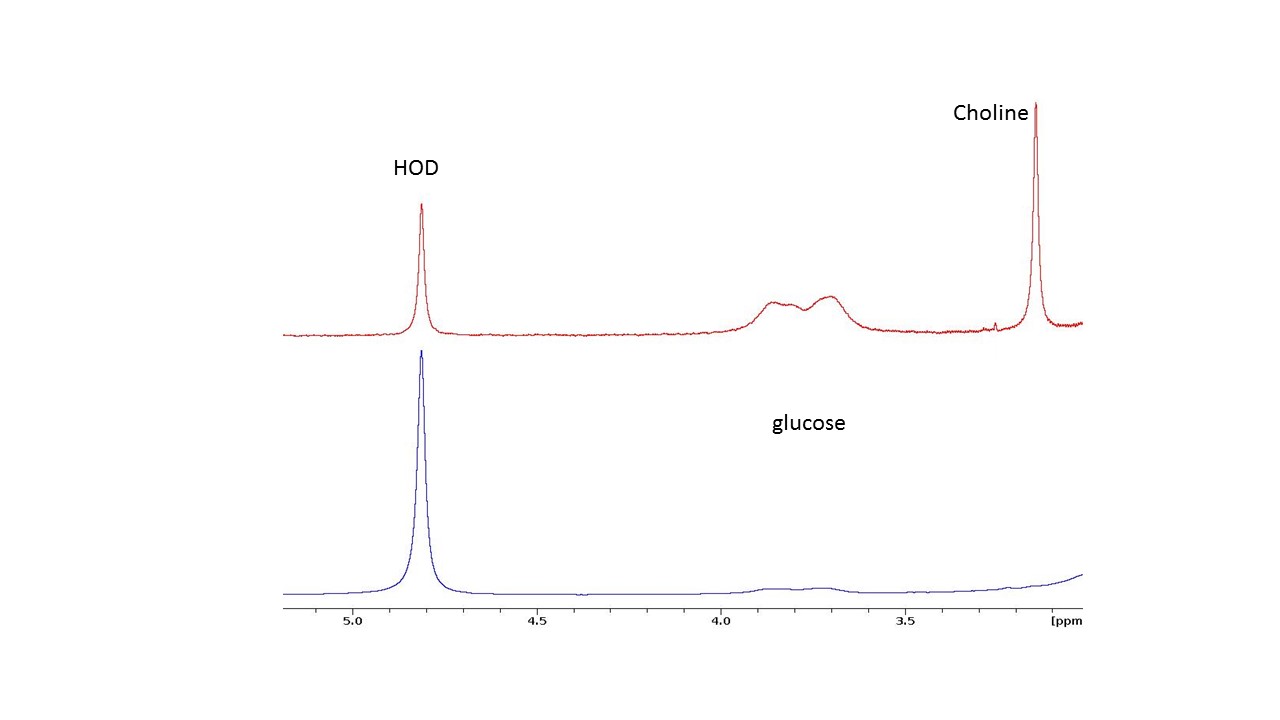
Figure 3
Upper trace. 2H NMR spectrum of blood sample obtained
immediately after infusion of [2H9]choline
and [6,6 2H2]glucose.
Lower trace: 2H NMR spectrum of blood sample obtained
15 min after infusion of [2H9]choline and [6,6 2H2]glucose..
No signal of choline is present and the glucose signals are strongly reduced.