2347
Susceptibility weighted imaging for quantitatively evaluation of dual‑phenotype hepatocellular carcinoma1The First Affiliated Hospital of Dalian Medical University, Dalian, China, 2Department of Pathology, The First Affiliated Hospital, Dalian Medical University, Dalian, China
Synopsis
Dual-phenotype hepatocellular carcinoma (DPHCC) is associated with high rate of post-operative recurrence and low rate of survival. This worked aimed at exploring the value of susceptibility weighted imaging (SWI) quantitative parameters for diagnosis of DPHCC. The results showed that R2* provided a promising performance (AUC = 0.830, sensitivity = 85.0%, specificity = 77.3%) in quantitatively evaluating DPHCC.
Purpose
To explore the value of susceptibility weighted imaging (SWI) quantitative parameters for diagnosis of dual-phenotype hepatocellular carcinoma (DPHCC).Introduction
HCC is one of the most common malignancies in the world and the third most frequent cause of cancer mortality [1]. DPHCC is a newly described HCC subtype characterized by the expression of biomarkers for HCC and intrahepatic cholangiocarcinoma [2]. Microscopically, the morphology of DPHCC is similar to HCC, but DPHCC simultaneously shows the expression of markers of HCC (hepatocyte-1, glypican-3) and cholangiocellular carcinoma (CK7, CK19) in immunohistochemistry. DPHCC shows greater malignancy and invasiveness than non-DPHCC subtypes [3]. Angiogenesis, as a consequence of hypoxia, is considered to be one of the key features of tumor progression, while vessel density and vascular endothelial growth factor are of prognostic value [4]. Susceptibility weighted imaging (SWI) is a promising technique for depicting hemorrhage, calcification and increased vascularity. We hypothesize that it’s practicable to diagnose DPHCC using SWI quantitative parameters.Methods
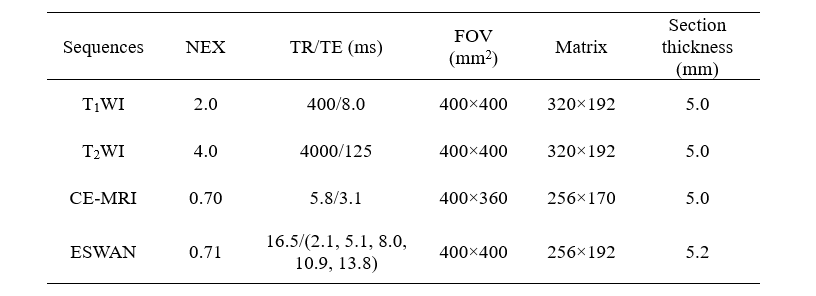
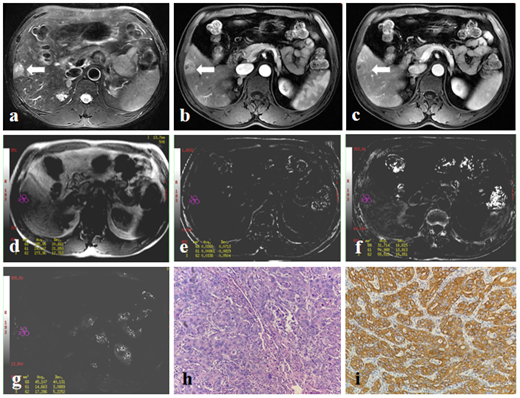
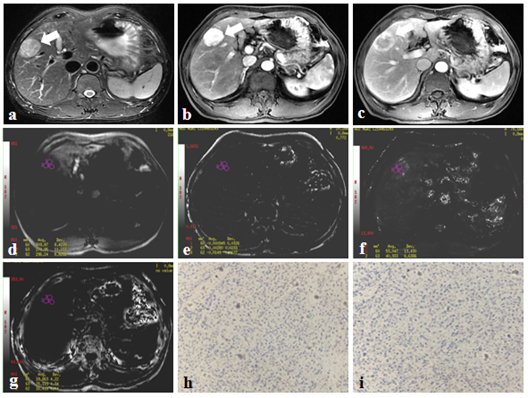
From March 2014 to July 2020, this retrospective study collected 44 patients who were pathologically confirmed as HCC at our hospital, including 20 DPHCCs (15 males; age, (62.15 ± 7.86) years old) and 22 non-DPHCCs (17 males; age, (59.59 ± 11.02) years old). All patients underwent abdominal MR examinations (Signa HDxt, GE Medical Systems, USA), including T1WI, T2WI and 3D gradient echo (GRE) SWI sequence. Detailed MR scanning parameters are shown in Table 1. All SWI sequence images were transferred to the GE AW 4.6 workstation for post-processing in Functool software. Referencing to T2W images, three regions of interest (ROIs) were placed on the maximum axial slice of the lesion on Magnitude, Phase, R2*, and T2* maps (Figure 1 and 2). The Magnitude, Phase, R2*, and T2* were recorded, and the average value of three ROIs was used for further analysis. All statistic analyses were analyzed by SPSS 22.0 software. The above parameters between DPHCC and non-DPHCC groups were compared using Mann-Whitney U test. Receiver operating characteristic (ROC) analysis was performed to evaluate diagnostic performance.Results
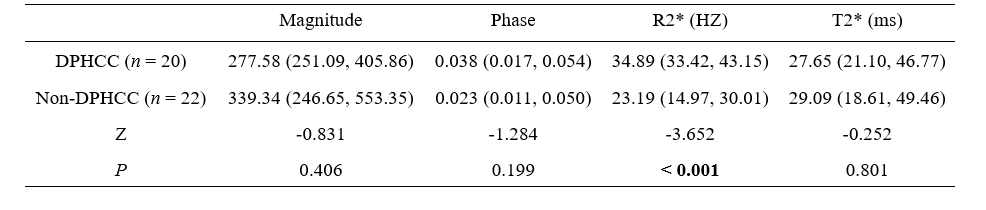
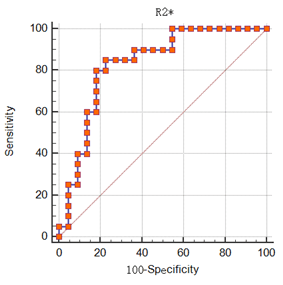
The R2* value of DPHCC group (34.89 (33.42, 43.15) HZ) was higher than that of non-DPHCC group (23.19 (14.97, 30.01) HZ), and P value < 0.001 (shown in Table 2). The Magnitude, Phase, and T2* were not significantly different between the two groups (P values, 0.406, 0.199 and 0.801). The area under the curve (AUC) of R2* for discriminating DPHCC and non-DPHCC was 0.830, the sensitivity was 85.0%, and the specificity was 77.3% (Figure 3).Discussion and Conclusion
DPHCC is a novel subtype of HCC, which has similar imaging and clinical characteristics to HCC, but higher early recurrence and mortality rates. In the present study, we proposed that R2* value of SWI could be a promising imaging biomarker in evaluation of DPHCC.Acknowledgements
NoneReferences
[1] Siegel RL, Miller KD, Jemal A. Cancer statistics, 2018. CA Cancer J Clin. 2018;60(5):277-300.
[2] Zhang J, Qi YP, Ma N, Lu F, Gong WF, Chen B, Ma L, Zhong JH, Xiang BD, Li LQ. Overexpression of Epcam and CD133 Correlates with Poor Prognosis in Dual-phenotype Hepatocellular Carcinoma. J Cancer. 2020;11(11):3400-3406.
[3] Cong WM, Bu H, Chen J, et al. Practice guidelines for the pathological diagnosis of primary liver cancer: 2015 update. World J Gastroentero. 2016;22(42):9279-9287.
[4] Bhattacharjee, R., Gupta, R. K., Patir, R., et al. Quantitative vs. semiquantitative assessment of intratumoral susceptibility signals in patients with different grades of glioma. Journal of magnetic resonance imaging, 2019;51(1), 225-233.
Figures