2346
The value of IVIM and enhanced T2 star weighted angiography (ESWAN) for prediction of microvascular invasion in hepatocellular carcinoma
Huanhuan Chen1, Ailian Liu1, Ying Zhao1, Qingwei Song1, Xin Li2, Yan Guo2, and Tingfan Wu2
1The First Affiliated Hospital of Dalian Medical University, Dalian, China, 2GE Healthcare, Shanghai, China
1The First Affiliated Hospital of Dalian Medical University, Dalian, China, 2GE Healthcare, Shanghai, China
Synopsis
Hepatocellular carcinoma (HCC) is the most common primary liver cancer, and surgical resection has been regarded as the most effective treatment of HCC; however, the high postoperative recurrence rate leads to poor prognosis. Microvascular invasion (MVI) is a risk factor for postoperative recurrence of HCC [1]. This study aimed to investigate the value of intravoxel incoherent motion (IVIM) and enhanced T2 star weighted angiography (ESWAN) for prediction of MVI in HCC.
Synopsis
Hepatocellular carcinoma (HCC) is the most common primary liver cancer, and surgical resection has been regarded as the most effective treatment of HCC; however, the high postoperative recurrence rate leads to poor prognosis. Microvascular invasion (MVI) is a risk factor for postoperative recurrence of HCC [1]. This study aimed to investigate the value of intravoxel incoherent motion (IVIM) and enhanced T2 star weighted angiography (ESWAN) for prediction of MVI in HCC.Purpose
To investigate the value of intravoxel incoherent motion (IVIM) and enhanced T2 star weighted angiography (ESWAN) for quantitative prediction of microvascular invasion (MVI) in patients wirh hepatocellular carcinoma (HCC).Introduction
Postoperative recurrence of hepatocellular carcinoma (HCC) seriously endangers the health of patients, and the prediction of microvascular infiltration (MVI) of HCC before resection is beneficial to the formulation of comprehensive treatment strategies and prognosis assessment. In general, intravoxel incoherent motion (IVIM) can quantitatively analyze tissue diffusion characteristics and microcirculation perfusion information. Previous studies have shown the feasibility of IVIM in predicting MVI of HCC [2]. Enhanced T2*weighted angiography (ESWAN) can obtain the information of quantitative parameters such as phase value, T2 and R2* values to predict MVI of HCC [3].Materials and Methods
From January 2018 to August 2020, 43 patients who were pathologically confirmed as HCC after surgical resection in our hospital were retrospectively enrolled (32 males, 11 females, age, 31-80 years). The patients were divided into the MVI-positive group (n =14) and MVI-negetiva group (n = 29). All patients underwent preoperative MR examination, including routine scanning sequences (T1WI, T2WI, contrast-enhanced MR), IVIM diffusion-weighted (DW) imaging (b = 0, 20, 50, 100, 150, 200, 400, 800, 1200, 2000, 3000 s/mm2) and axial 3D ESWAN sequence. Quantitative IVIM-derived maps, including Standard apparent diffusion coefficient (ADC), Slow ADC Mono, Fast ADC Mono, Fraction of Fast ADC Mono, Slow ADC Bi, Fast ADC Bi, and Fraction of Fast ADC Bi were automatically generated from IVIM DW imaging by using a Functool software on GE AW 4.6 workstation. ESWAN-derived maps included Magnitude, Phase, R2*, and T2*. The three regions of interest (ROIs) were placed on the maximum axial slice of the lesion (Figure 1 and 2). The average value of three ROIs was used for further analysis. The SPSS26.0 statistical software was used for data analysis. The Mann-Whitney U test was used to compare the difference of ESWAN and IVIM values between the two groups. The logistic regression analysis was used to establish a predictive model of combining different parameters. Receiver operating characteristic (ROC) analysis was performed to evaluate diagnostic performance. Delong’s test was used to compare the differences of AUCs between the two groups. P < 0.05 indicated that the difference was statistically significant.Result
Table 1 shows the comparisons of parameters between MVI-positive and MVI-negative groups The values of Standard ADC, Slow ADC Mono and Slow ADC Bi in the MVI-negative group were significantly higher than those of the MVI-positive group, while the R2* value of MVI-negative group were significantly lower than that of the MVI-positive group (P < 0.05). The AUC of Standard ADC, Slow ADC Mono, Slow ADC Bi, and R2* for prediction of MVI were 0.810, 0.818, 0.727, and 0.749, respectively (Table 3).The quantitative values of ESWAN (R2*), IVIM (Standard ADC + Slow ADC Mono + Slow ADC Bi), and combination (R2 *+ Standard ADC + Slow ADC Mono + Slow ADC Bi) were 0.749, 0.860, and 0.874, respectively. When IVIM combined with ESWAN, the AUC was improved with a sensitivity of 92.9% and a specificity of 79.3% (cut-off value :0.242) ( Table 3).Discussion and Conclusion
In recent years, IVIM has been widely used in HCC. Previous studies have been used in the diagnosis, treatment efficacy evaluation and prognosis prediction [4, 5]. In this study, IVIM combined with ESWAN was applied to predict MVI in HCC, and the results showed that the D value in the MVI-positive group was significantly lower than that in the MVI-negative group. It was speculated that the reason was the rapid proliferation of cancer cells, high cell density and tight arrangement in the MVI-positive group, ,which resulted in the reduction of extracellular space and limited diffusion of water molecules, which was similar to previous studies [6,7]. The R2* was significantly higher in the MVI-positive group than that in the MVI -negative group, This may be due to more malformed neovascularization and higher metabolism in the MVI-positive group, which leading to tumor being in a state of relative oxygen deficiency. In conclusion, the slow diffusion coefficient (D) of IVIM and R2* of ESWAN might be potential biomarkers in prediction of MVI in patients with HCC, which can provide more valuable prognosis information for surgeons and better guide the choice of operation scheme.Acknowledgements
No acknowledgement found.References
[1] Zhang XP, Wang K, Wei XB, et al. An Eastern Hepatobiliary Surgery Hospital Microvascular Invasion Scoring System in Predicting Prognosis of Patients with Hepatocellular Carcinoma and Microvascular Invasion After R0 Liver Resection: A Large-Scale, Multicenter Study. Oncologist. 2019. 24(12): e1476-e1488.[2] Wei Y, Huang Z, Tang H, et al. IVIM improves preoperative assessment of microvascular invasion in HCC. Eur Radiol. 2019. 29(10): 5403-5414.[3] Jhaveri KS, Cleary SP, Fischer S, et al. Blood oxygen level-dependent liver MRI: can it predict microvascular invasion in HCC. J Magn Reson Imaging. 2013. 37(3): 692-9.[4] Ai Z, Han Q, Huang Z, Wu J, Xiang Z. The value of multiparametric histogram features based on intravoxel incoherent motion diffusion-weighted imaging (IVIM-DWI) for the differential diagnosis of liver lesions. Ann Transl Med. 2020. 8(18): 1128.[5] Granata V, Fusco R, Amato DM, et al. Beyond the vascular profile: conventional DWI, IVIM and kurtosis in the assessment of hepatocellular carcinoma. Eur Rev Med Pharmacol Sci. 2020. 24(13): 7284-7293.[6] Shi G, Han X, Wang Q, et al. Evaluation of Multiple Prognostic Factors of Hepatocellular Carcinoma with Intra-Voxel Incoherent Motions Imaging by Extracting the Histogram Metrics. Cancer Manag Res. 2020. 12: 6019-6031.[7] Yang D, She H, Wang X, Yang Z, Wang Z. Diagnostic accuracy of quantitative diffusion parameters in the pathological grading of hepatocellular carcinoma: A meta-analysis. J Magn Reson Imaging. 2020. 51(5): 1581-1593.Figures
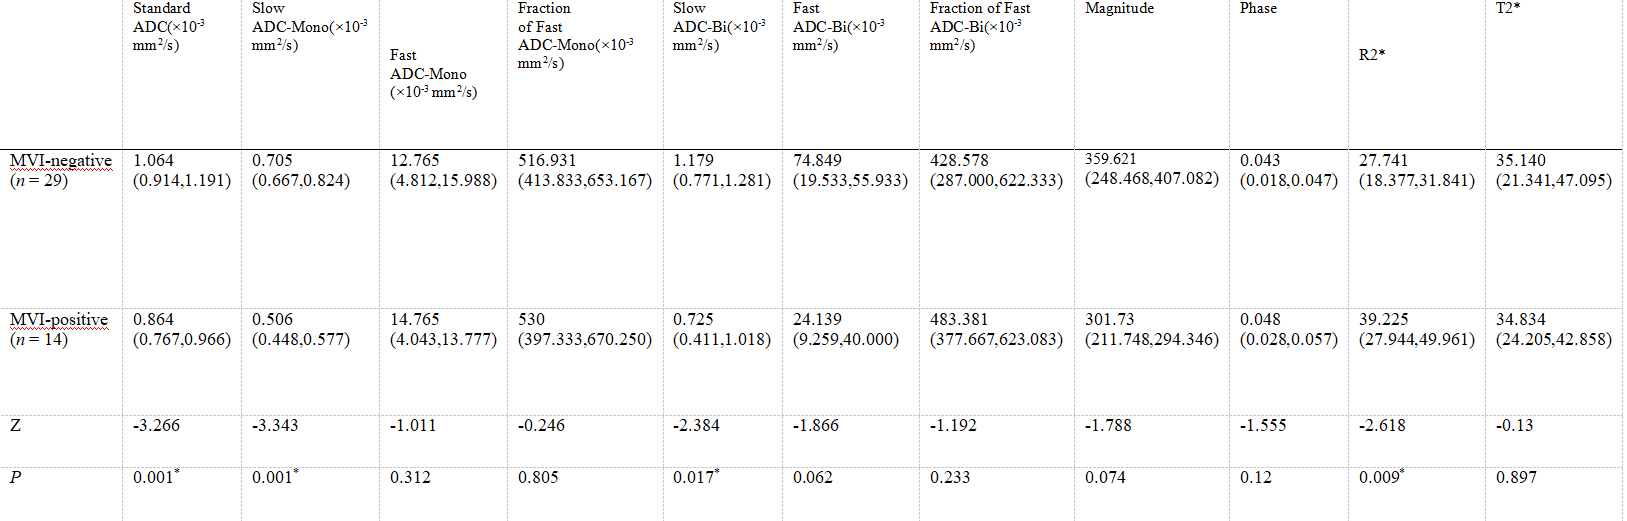
Table 1. Comparisons of parameters between MVI-positive and MVI-negative groups.*P < 0.05 was considered statistically significant different.
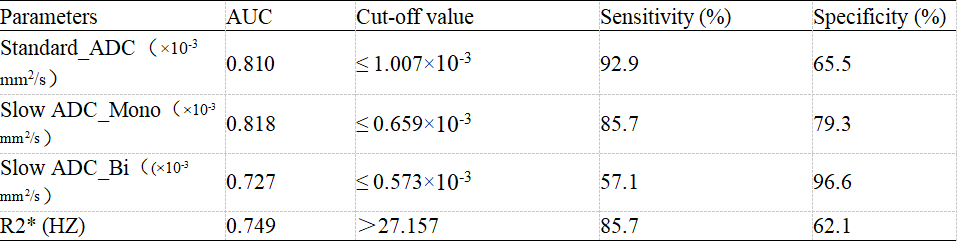
Table 2. Predictive performance of IVIM and ESWAN parameters between MVI-positive and MVI-negative groups
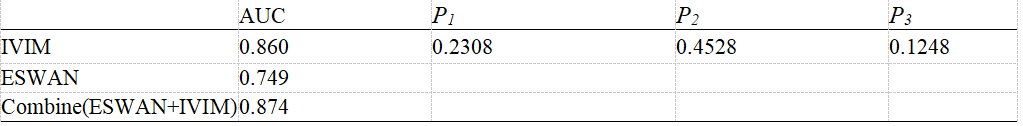
Table 3. Difference between AUCs of IVIM, ESWAN and Combine.P1 the difference between IVIM and ESWAN, P2 the difference between IVIM and Combine, P3 the difference between ESWAN and Combine.
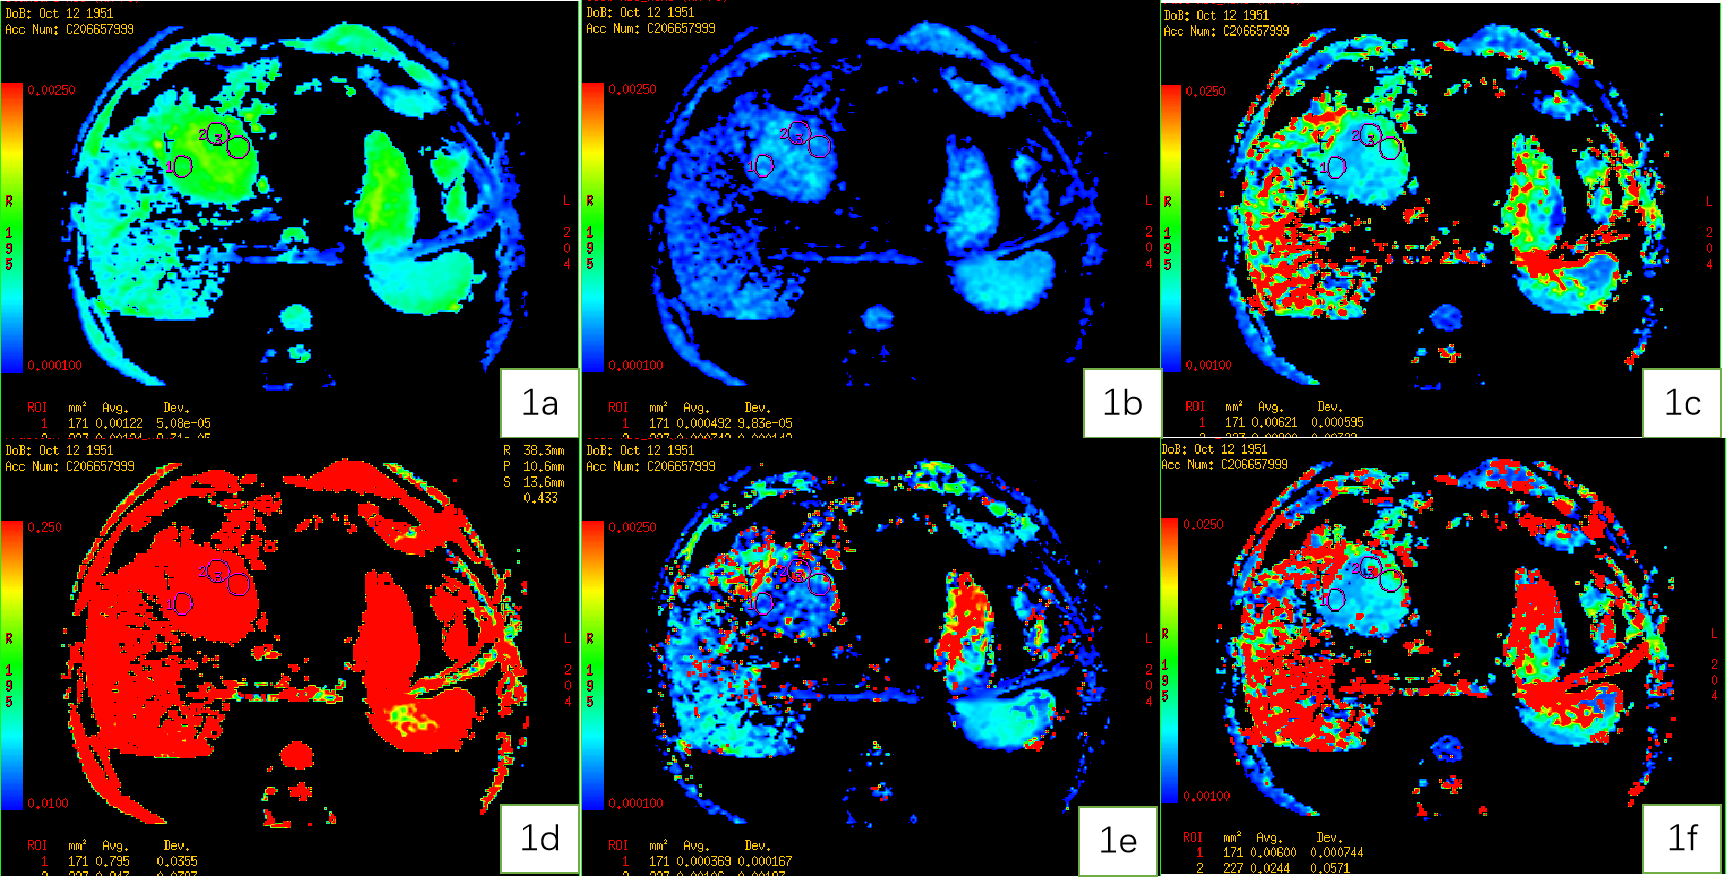
Figure 1. A 67-year-old male patient with HCC. Standard ADC (1a), slow ADC Mono (1b), Fast ADC Mono (1c), Fraction of Fast ADC Mono (1d) , Slow ADC_Bi (1e), Fast ADC_Bi (1f) maps.
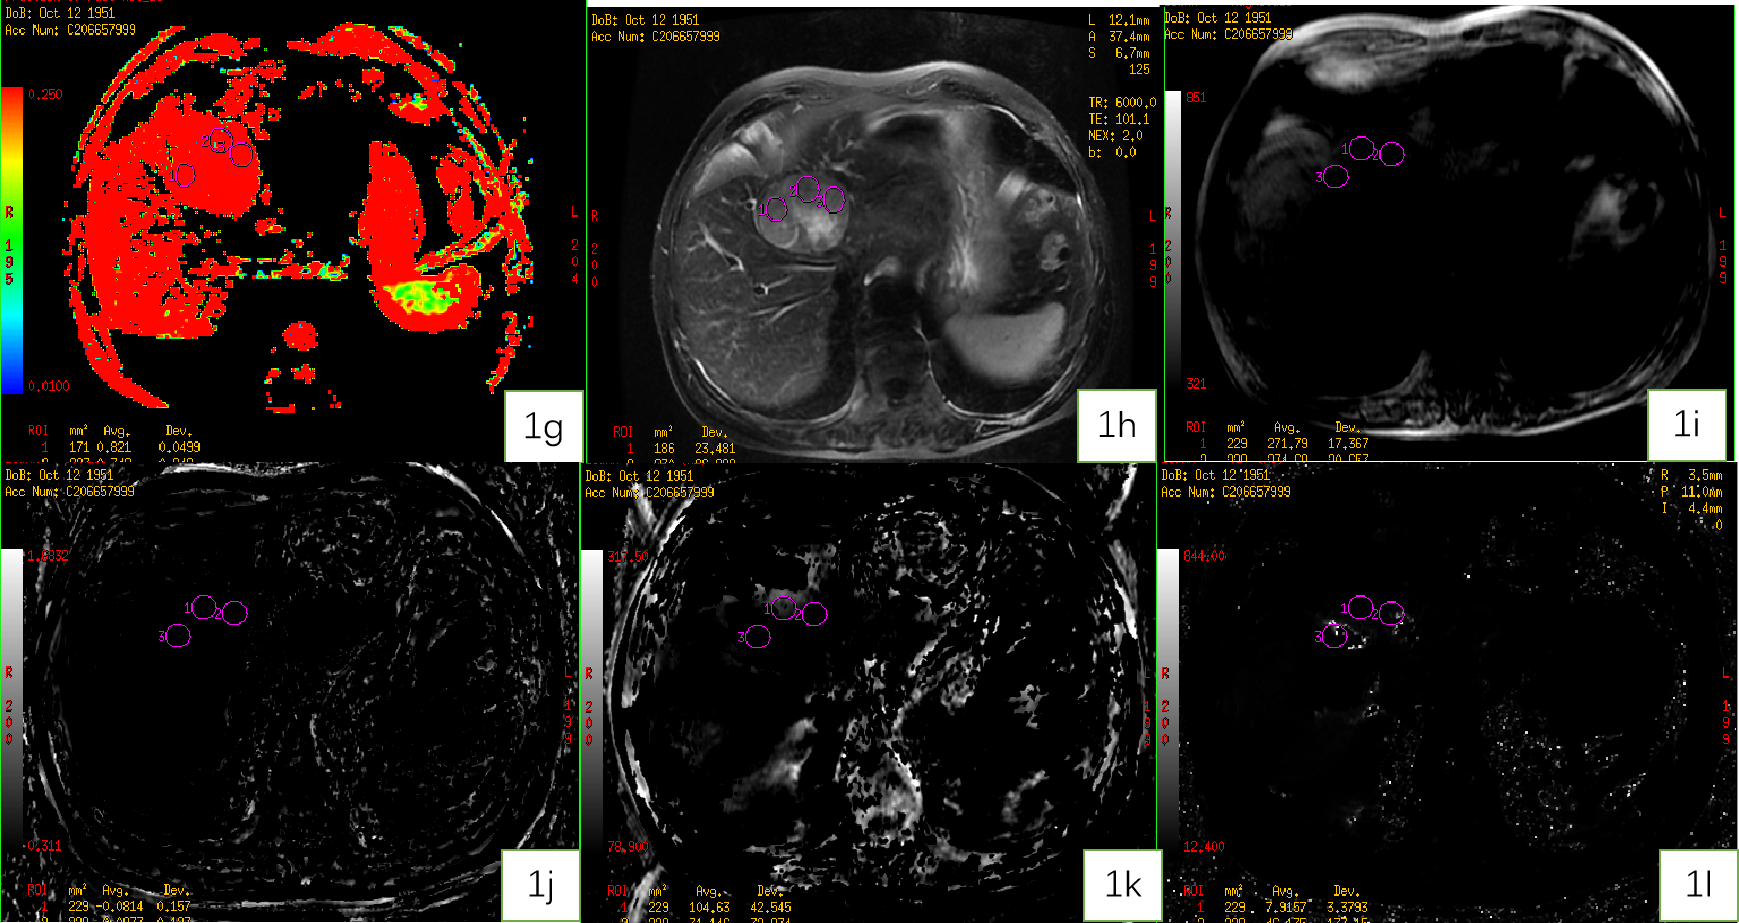
Figure 1. A 67-year-old male patient with HCC. Fraction of Fast ADC Bi (1g) , T2WI (1h), Magnitude (1i), Phase (1j), R2* (1k), and T2* (1l) maps.
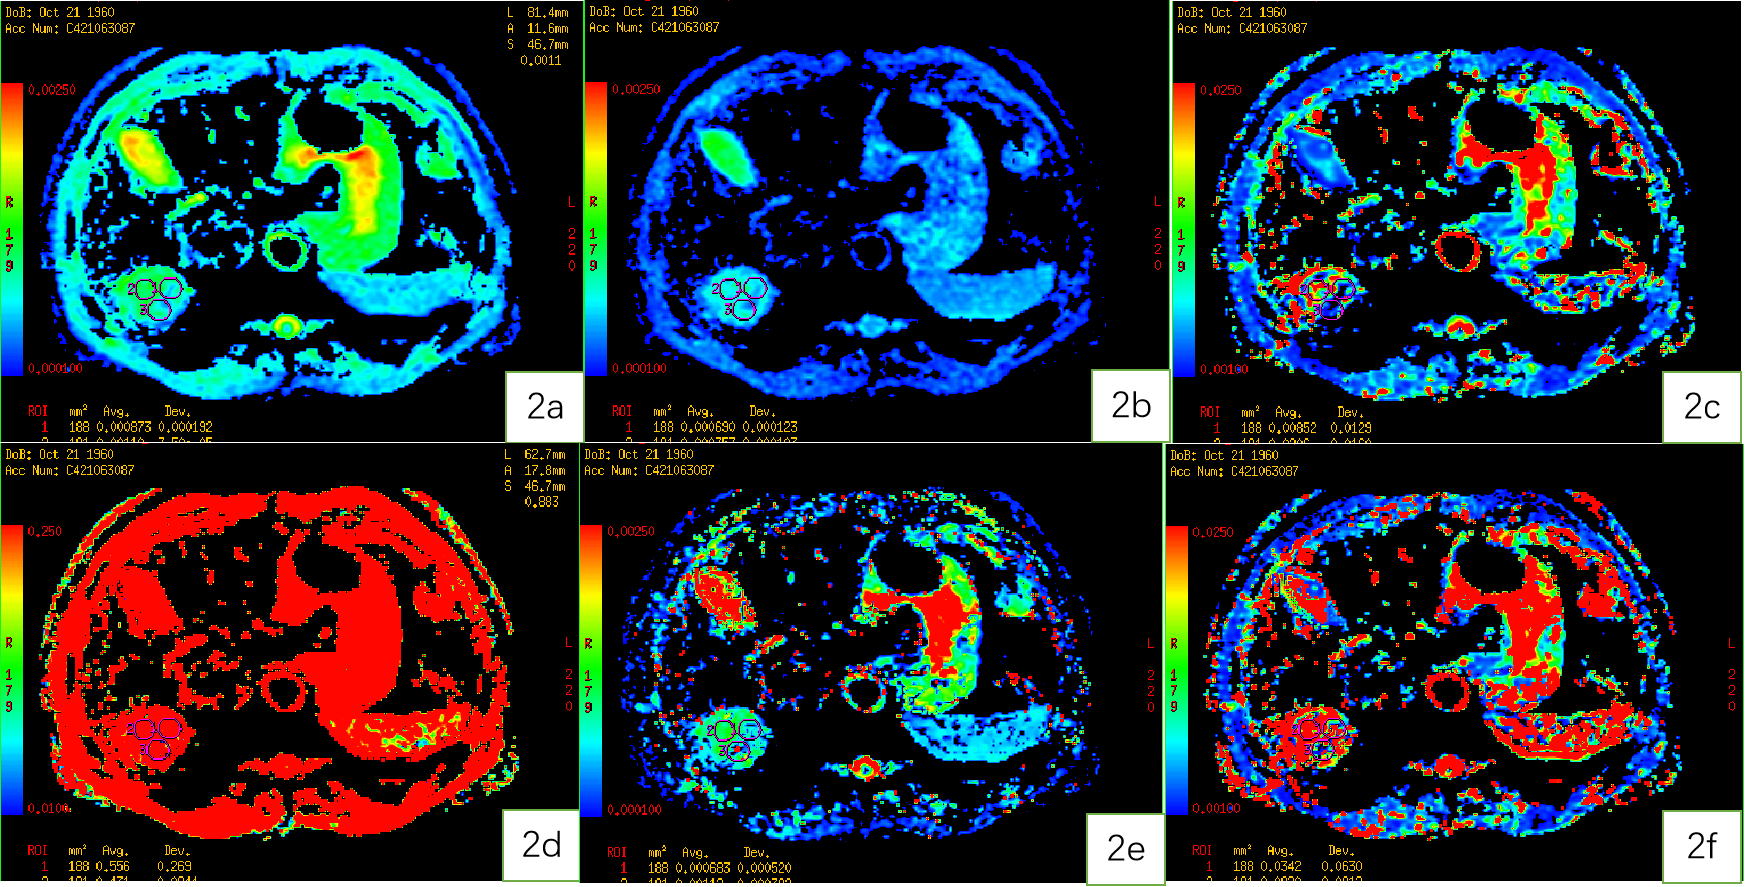
Figure 2. A 59-year-old male patient with HCC. Standard ADC (2a), slow ADC Mono (2b), Fast ADC Mono (2c), Fraction of Fast ADC Mono (2d) , Slow ADC_Bi (2e), Fast ADC_Bi (2f)maps.
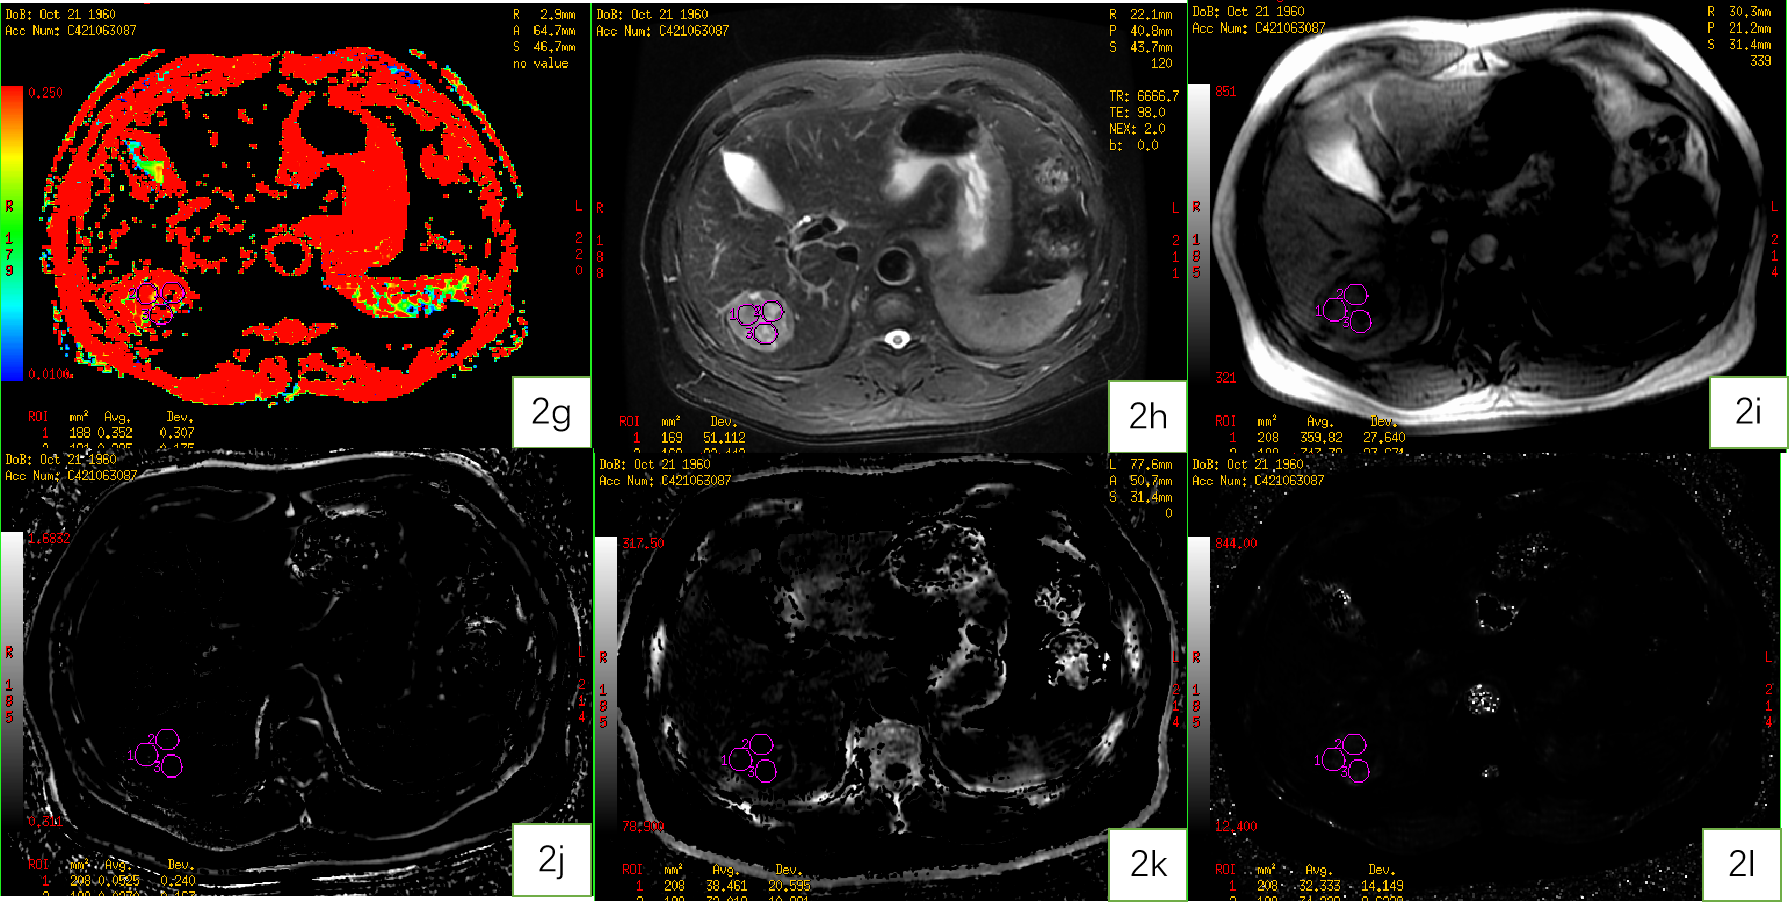
Figure 2. A 59-year-old male patient with HCC.Fraction of Fast ADC Bi (2g) , T2WI (2h), Magnitude (2i), Phase (2j), R2* (2k), and T2* (2l) maps.
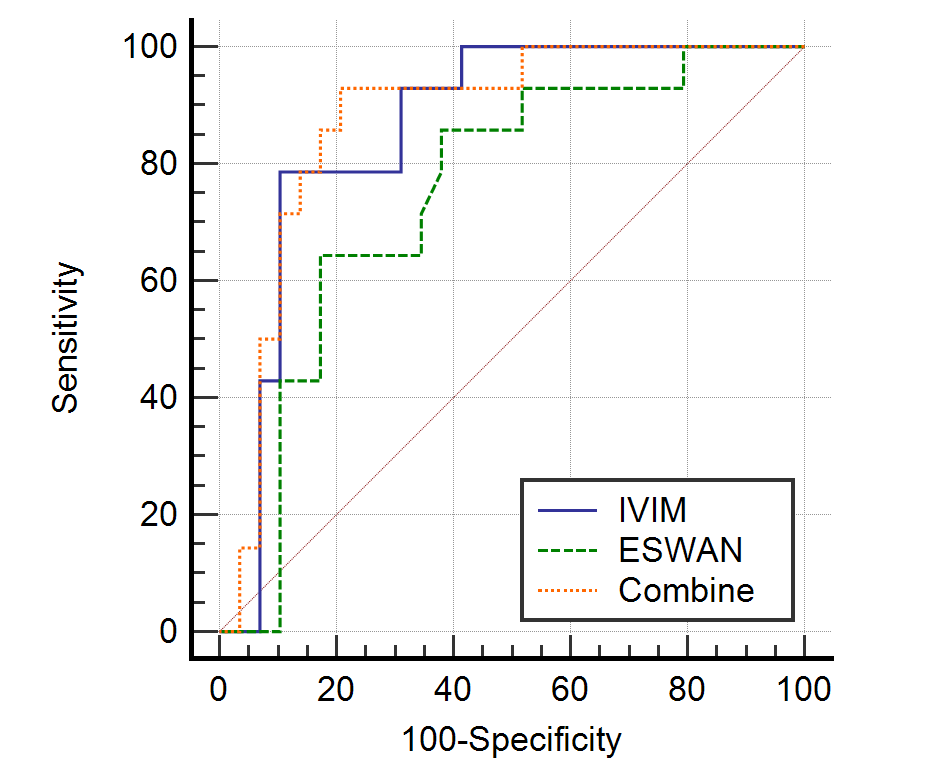
Figure 3. ROC Curve of IVIM, ESWAN and Combine in prediction of MVI in HCC.