2344
DKI for Assessing the Therapeutic Response of TACE in Hepatocellular Carcinoma and Invasion of Peritumoral Zone1Medical Imaging, Shandong Provincial Qianfoshan Hospital, the First Hospital Affiliated with Shandong First Medical University, Jinan, China, 2GE Healthcare, MR Research China, Bejing,, Beijing, China, 3Medical Imaging, Shandong Provincial Qianfoshan Hospital, the First Hospital Affiliated with Shandong First Medical University, Jinan, Shandong, China, 4Shandong Provincial Qianfoshan Hospital, the First Hospital Affiliated with Shandong First Medical University, Jinan, Shandong, China
Synopsis
Diffusion kurtosis imaging (DKI) is able to describe the deviations of water molecules diffusion from Gaussian form and depict the microstructural environment precisely. Previous study applied DKI in assessing the therapeutic response of Transcatheter Arterial Chemoembolization (TACE) in Hepatocellular Carcinoma (HCC), and showed promising results. On this basis, this study further explored the clinical value of DKI in assessing liver cancer and tumoral cell invasion of peritumoral zone between HCC progressive group and pseudo-progressive group after TACE treatment, in order to provide new ideas for clinical follow-up.
Introduction
Transcatheter Arterial Chemoembolization was an appropriate clinical treatment to improve the prognosis of Hepatocellular Carcinoma patients, especially for those manifested as advanced liver cancer1. Due to HCC hypervascular features and highly possible establishment of new collateral circulation, it is prone to being recurrence2. An accurate evaluation of HCC after TACE is thus essential to help guide subsequent therapeutic planning in clinical practice. DKI, as a relatively novel diffusion imaging technique, could essentially describe the deviations of water molecules diffusion from the Gaussian form and depict the microstructural environment precisely3. Previous study4 reported that DKI can provide valuable information of HCC progress after TACE treatment. One DKI parameter MK for HCC lesion showed robust assessment in distinguishing true progression from pseudo-progression. With this finding, this study aimed to further systematically investigate the value of DKI in assessing progressing lesion cell invasion of peritumoral liver zone in TACE patients.Materials and Methods
SubjectsForty-six patients (mean age: 55±12 years) with fifty-six hepatic cancer nodules received TACE treatment and were recruited in this study. Pathological results or the overall mRECIST criterion were used to define progressing groups or pseudo-progressing groups. Finally, 38 cases of relapse/residual lesions were identified as progressing groups, and 18 cases of stable and inactive lesions were identified as pseudo-progressing groups.
MRI experiment
All DKI experiments were performed on a 3T MRI (DISCOVERARY 750, GE, USA) with eight-channel coil employed. The applied scan parameters for DKI scanning were five b values (400, 800, 1200, 1600, 2000 s/mm2) and 15 directions per b value. Total scan time was about 10 mins.
Data analysis
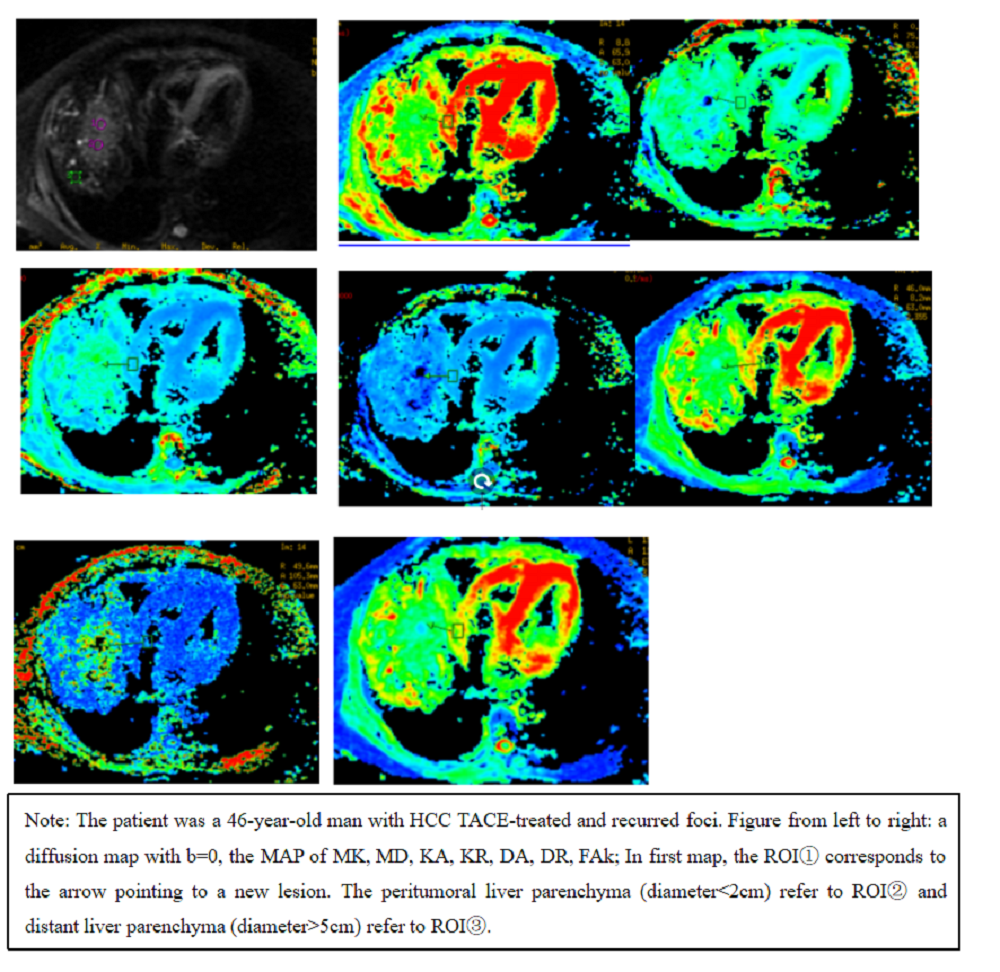
All DKI images were analyzed using a vendor-provided postprocessing software in GE ADW4.6 workstation. The corresponding mappings of DKI derived parameters FAk, MD, DA, DR, MK, KA and KR in DKI were obtained. Based on DKI parametric maps, the TACE-treated area, peritumoral liver parenchyma (d<2cm to the tumor) and the distant liver parenchyma (d>5cm) were drawn as regions of interest (ROI)s. All those ROI selections were implememted by two professional experts independently. To avoid inter-subject variation, we standardized all obtained values:
Stdpseudoprogression=ROI(pseudo-progression lesion)/ROI(normal parenchyma); Stdprogression=ROI(progression lesion)/ROI( normal parenchyma).
Statistical analysis
All statistical analyses were performed in SPSS 22.0 statistical software. Non-parametric U test was used to evaluate the differences of DKI derived parameters between progressing and non-progressing groups. Independent sample T test was used to compare all DKI metrics of liver parenchyma (d<2cm) and away from the foci (d>5cm) in the progressing group. P<0.05 was considered statistical significance.
Results
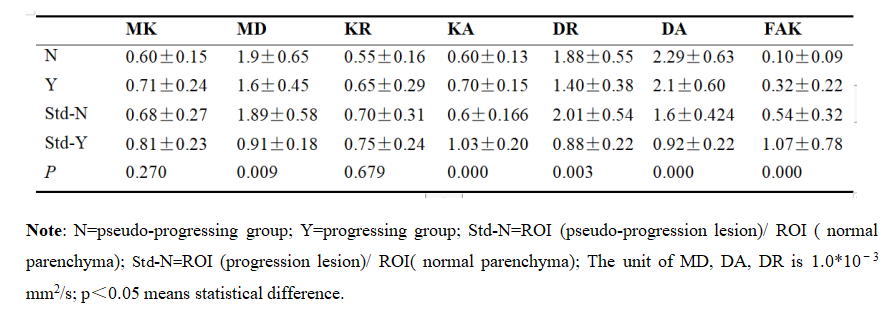
Compared to pseudo-progressing lesions, true progressing lesions were associated with lower values of MD, DA, DR (1.6±0.45*10-3mm/s vs 1.9±0.65×10⁻³ mm/s; 2.1±0.60*10-3mm/s vs 2.29±0.63×10⁻³ mm/s; 1.40±0.38*10-3mm/s vs 1.88±0.55×10⁻³ mm/s; Table.1) (P<0.05). However, higher KA and FA were found in the foci area of the progressing lesion than of the pseudo-progressing lesion (0.70±0.15 vs 0.60±0.13, 0.32±0.22 vs 0.10±0.09; Table.1), respectively.MD values of liver parenchyma (both d<2cm and d>5cm) were significantly lower in progressing group (0.866±0.33×10⁻³ mm/s vs 1.677±0.63×10⁻³mm/s and 0.843±0.17×10⁻³ mm/s vs 1.569±0.41×10⁻³mm/s; P<0.05) than pseudo-progressive group.
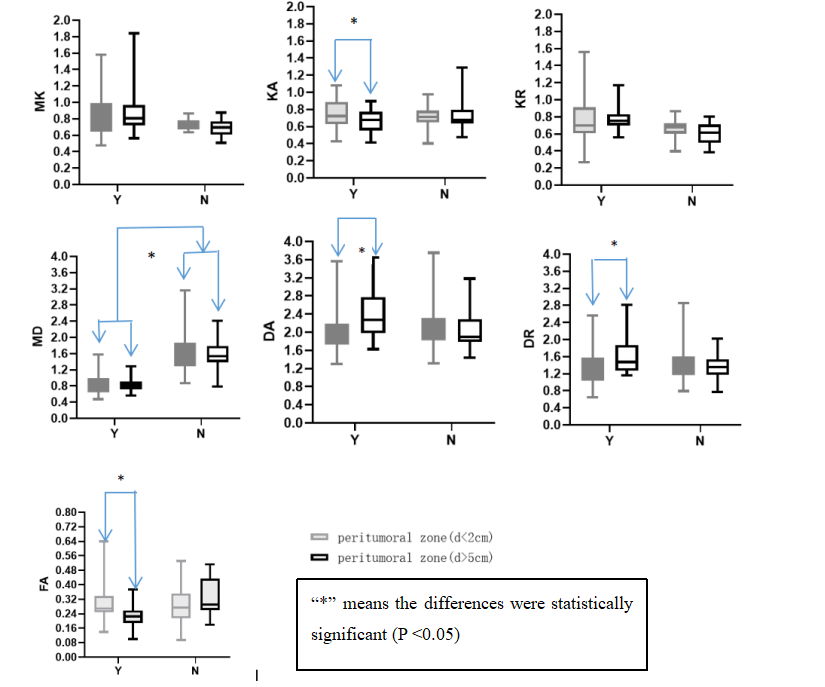
Meanwhile, DA and DR values of peritumoral zone (d<2cm) were smaller than those of peritumoral zone (d>5cm) (2.11±0.52×10⁻³mm/s vs 2.44±0.59×10⁻³mm/s, 1.382±0.44×10⁻³mm/s vs 1.647±0.47×10⁻³mm/s) in progressive group. However, the FAk and KA values showed opposite trends. Additionally, the liver parenchyma (d<2cm) was found with higher FAk and KA values than parenchyma (d>5cm) (0.309±0.11 vs 0.228±0.06, 0.809±0.34 vs 0.783±0.12; (P<0.05), Figure 1) respectively.
Discussion
In this study, we investigated the diagnostic performance of DKI for distinguishing true progression from pseudo-progression and further studied the value of DKI in assessing tumoral cell invasion of peritumoral liver zone. The DKI parameters including MD, DA, DR, KA and FAk showed statistical significance between true progression and pseudo-progression (P<0.05). MD, Da and Dr values of pseudo-progression lesion were higher than those of true progression, while Ka and FAk value were in opposite pattern.In addition, MD, DA, DR, KA and FAk values of progressing group had significant statistical difference (P<0.05) between the distant liver parenchyma (d>5cm) and peritumoral liver parenchyma (d<2cm). The reason may be explained that tumoral cell invasion of peritumoral zone or microenvironmental changes in the liver tissue may occur near the progressing lesion. By measuring peritumoral zone, the deviations of water molecules diffusion from the Gaussian form was depicted precisely, thus can be provided for evaluating liver cancer recurrence.
Conclusion
In conclusion, DKI quantitative metrics (MD, DA, DR, KA and FAk) showed advantage in assessing the therapeutic response of TACE in HCC and is able to provide molecular imaging information for evaluating invasion of peritumoral zone.Acknowledgements
Acknowledgements: Papers without fund support.
All conflict of interest disclosures: None.
References
[1] Sacco R, Bertini M, Petruzzi P, et al. Clinical impact of selective transarterialChemoembolization on hepatocellular carcinoma: a cohort study. World JGastroenterol. 2009; 15(15):1843–1848.
[2] Raoul JL, Forner A, Bolondi L, Cheung TT,et al. Updated use of TACE for hepatocellular carcinoma treatment: How and when to use it based on clinical evidence. Cancer Treat Rev. 2019;72:28-36.
[3] Wang J, Dou W, Shi H, et al. Diffusion kurtosis imaging in liver: a preliminary reproducibility study in healthy volunteers. MAGMA. 2020;33(6):877-883.
[4] Yuan ZG, Wang ZY, Xia MY, et al. Diffusion Kurtosis Imaging for Assessing the Therapeutic Response of Transcatheter Arterial Chemoembolization in Hepatocellular Carcinoma. J Cancer. 2020;11(8):2339-2347.
Figures