2342
Intravoxel incoherent motion diffusion-weighted MR imaging for preoperatively identifying CK19-positive hepatocellular carcinoma1The First Affiliated Hospital of Dalian Medical University, Dalian, China, 2Department of Pathology, The First Affiliated Hospital, Dalian Medical University, Dalian, China
Synopsis
Cytokeratin 19 (CK19) is well acknowledged as a biliary/progenitor cell marker and a marker of tumor stem cell. CK19-positive HCCs demonstrate more aggressive behaviors and poorer outcomes. This worked aimed at exploring the value of intravoxel incoherent motion (IVIM) diffusion-weighted (DW) magnetic resonance (MR) imaging in the diagnosis of CK19-positive HCC. The results showed that Slow ADC Mono and Slow ADC Bi were significantly different between the CK19-positive and CK19-negative HCC groups. The area under the curves (AUCs) of Slow ADC Mono, Slow ADC Bi, and combine (Slow ADC Mono & Slow ADC Bi) were 0.817, 0.988, and 0.992, respectively.
Purpose
To explore the value of intravoxel incoherent motion (IVIM) diffusion-weighted (DW) magnetic resonance (MR) imaging for the diagnosis of CK19-positive hepatocellular carcinoma (HCC).Introduction
Hepatocellular carcinoma (HCC) is the fifth most common malignancy and the third cause of cancer-related death worldwide [1,2]. The heterogeneity of HCC commonly leads to therapeutic failure of HCC. Cytokeratin 19 (CK19) is well acknowledged as a biliary/progenitor cell marker and a marker of tumor stem cell. CK19-positive HCCs demonstrate more aggressive behaviors and poorer outcomes which including worse overall survival and early tumor recurrence after hepatectomy and liver transplantation [3]. Therefore, the accurate identification of CK19-positive HCC is of great significance. IVIM DW imaging is a method initially developed by Le Bihan et al. [4,5] to quantitatively assess the microscopic translational motions that occur in each image voxel at MRI, which can distinguish both pure molecular diffusion and microcirculation, or blood perfusion. In the present study, IVIM maybe is a more appropriate and accurate technique to preoperatively identify CK19-positive HCC.Methods
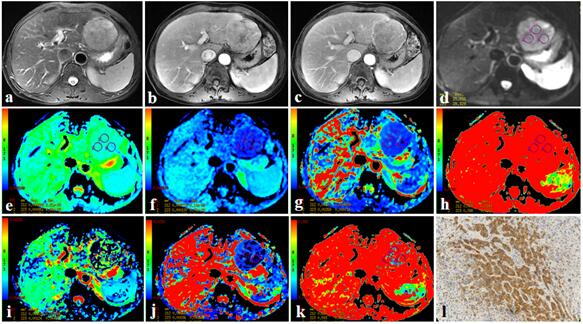
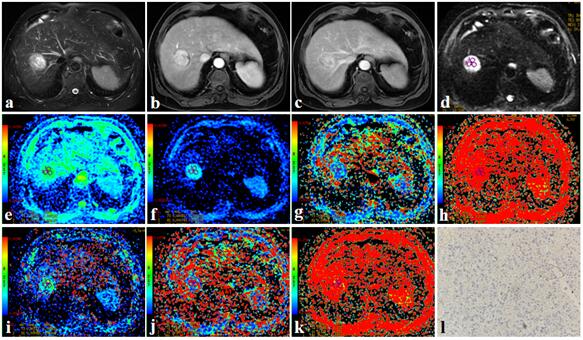
From October 2015 to July 2020, this retrospective study collected 38 patients who were pathologically confirmed as HCC at our hospital, including 8 CK19-positive HCCs (4 males; age, (65.88 ± 6.01) years old) and 30 CK19-negative HCCs (21 males; age, (60.27 ± 10.21) years old). All patients underwent abdominal MR examinations (Signa HDxt, GE Medical Systems, USA), including T1WI, T2WI, contrast-enhanced MR, and additional IVIM-DWI (b = 0, 20, 50, 100, 150, 200, 400, 800, 1200, 2000, 3000 s/mm2). Quantitative IVIM-derived maps, including Standard apparent diffusion coefficient (ADC), Slow ADC Mono, Fast ADC Mono, Fraction of Fast ADC Mono, Slow ADC Bi, Fast ADC Bi, and Fraction of Fast ADC Bi, were automatically generated from IVIM DW imaging by using a Functool software on GE AW 4.6 workstation. Referencing to DW images, the region of interest (ROI) were placed on the maximum axial slice of the lesion (Figure 1 and 2). All statistic analyses were analyzed using SPSS 22.0 software. The above parameters between CK19-positive and CK19-negative HCC groups were compared using Mann-Whitney U test. The logistic regression analysis was used to establish a predictive model of combining different parameters. Receiver operating characteristic (ROC) analysis was performed to evaluate diagnostic performance. The Delong’s test was used to compare the AUCs of different parameters.Results
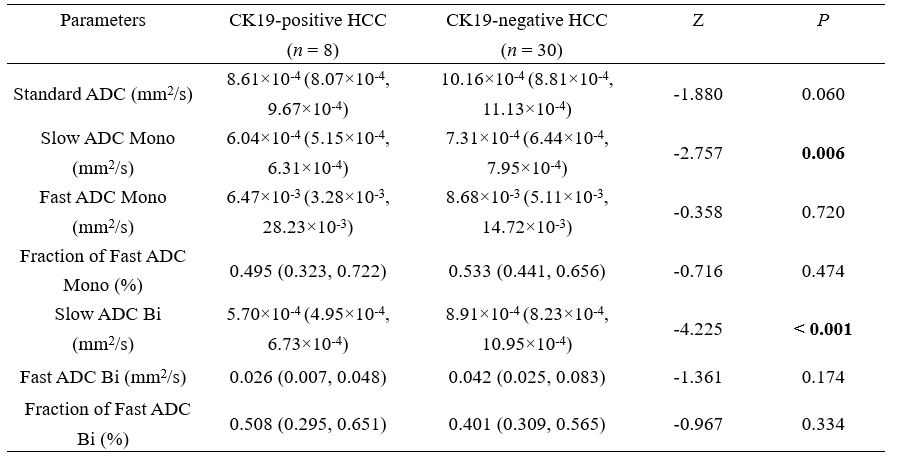
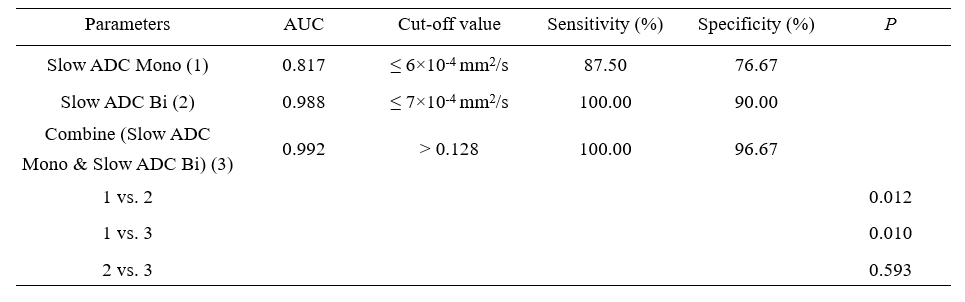
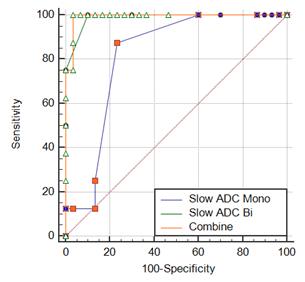
The Slow ADC Mono and Slow ADC Bi of CK19-positive HCC group were lower than those of CK19-negative HCC group (P < 0.05, shown in Table 1). The remaining parameters were not significantly different between the two groups (P > 0.05). The area under the curve (AUC) of Slow ADC Mono and Slow ADC Bi for the identification of CK19-positive and CK19-negative HCCs were 0.817 and 0.988, respectively. When combined Slow ADC Mono with Slow ADC Bi, the diagnostic performance was improved (AUC, 0.992). Delong’s test demonstrated that combine (Slow ADC Mono & Slow ADC Bi) and Slow ADC Bi had significantly higher AUCs compared with the Slow ADC Mono (P < 0.05, shown in Table 2). ROC curve for the discrimination of CK19-positive and CK19-negative HCCs is shown in Figure 3.Discussion and Conclusion
CK19-positive HCC is known as biphenotypic HCC; that is, having the pathological features of both HCC and cholangiocarcinoma (CC). These group of patients often show worse outcomes as compared to the CK19-negative HCC patients. This study demonstrated that Slow ADC Mono and Slow ADC Bi of IVIM-DWI might be potential biomarkers in the discrimination of CK19-positive and CK19-negative HCCs, which may provide more prognosis formation and guide the clinical-decision making.Acknowledgements
NoneReferences
[1] Mak LY, Cruz-Ramon V, Chinchilla-Lopez P, et al. Global Epidemiology, Prevention, and Management of Hepatocellular Carcinoma. Am Soc Clin Oncol Educ Book. 2018. p: 262-79.
[2] Forner A, Reig M, Bruix J. Hepatocellular carcinoma. Lancet. 2018;391:1301-14.
[3] Zhuo JY, Lu D, Tan WY, et al. CK19-positive Hepatocellular Carcinoma is a Characteristic Subtype. J Cancer. 2020;11(17):5069-5077.
[4] Le Bihan D, Breton E, Lallemand D, et al. Separation of diffusion and perfusion in intravoxel incoherent motion MR imaging. Radiology.1988; 168: 497-505.
[5] Le Bihan D, Turner R, MacFall JR. Effects of intravoxel incoherent motions (IVIM) in steady-state free precession (SSFP) imaging: application to molecular diffusion imaging. Magn Reson Med.1989; 10: 324-337.
Figures