2341
Value of intratumoral susceptibility signal intensities in quantitatively and automatically evaluating histological grade of HCC using ESWAN1The First Affiliated Hospital of Dalian Medical University, Dalian, China, 2Dalian University of Technology, Dalian, China
Synopsis
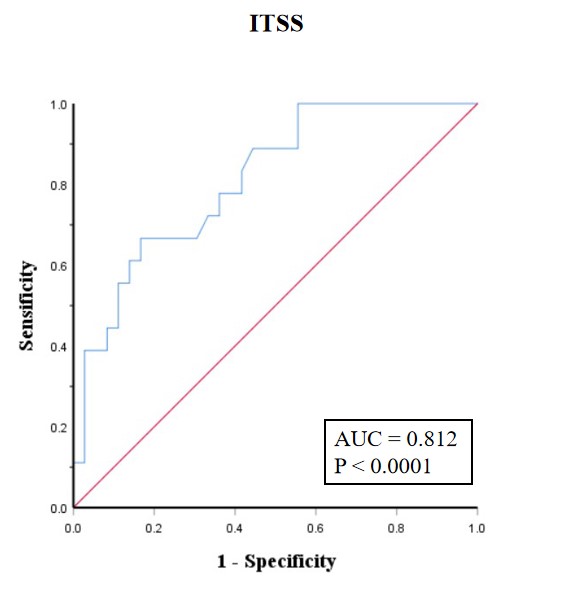
The aim of this study was to explore the value of intratumoral susceptibility signal intensities (ITSS) in quantitatively and automatically evaluating histological grading of hepatocellular carcinoma (HCC) by using enhanced T2 star-weighted angiography (ESWAN). The results showed that quantitative ITSS providied a promising differential performance (AUC = 0.812, P< 0.0001, sensitivity of 83.33%, specificity of 66.67%) in automatically evaluating histological grading of HCC.
Introduction
Histological grading in hepatocellular carcinoma (HCC) plays a crucial role in prognosis prediction, and perhaps even for allowing specific treatments to be selected for any given stage of HCC [1]. An accurate and effective histological grading method for HCC become necessary. Angiogenesis, as a consequence of hypoxia, is considered to be one of the key features of tumor progression, while vessel density and vascular endothelial growth factor are of prognostic value, and these values increase with increasing tumor grade [2]. Susceptibility weighted imaging (SWI) is a promising technique for depicting hemorrhage, calcification and increased vascularity, which may manifest tumor histological grading [3]. It has been applied to differentiate benign and malignant abdominal tumors originating from the liver, spleen and kidney [4]. enhanced T2 star-weighted angiography (ESWAN) is a recently developed and SWI-based magnetic reseonance technology. We hypothesize that it’s practicable to evaluate histological grading of HCC quantitatively and automatically by intratumoral susceptibility signal intensities (ITSS).Methods
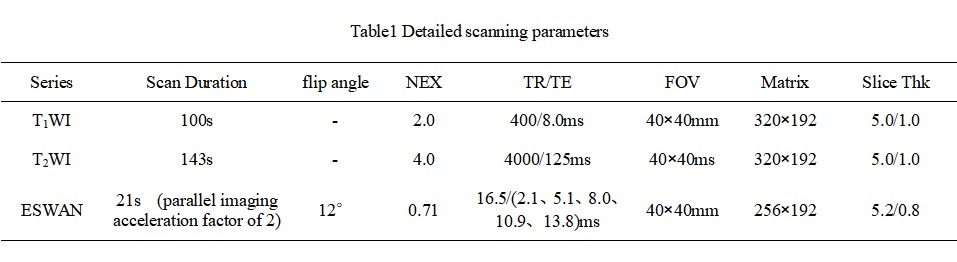
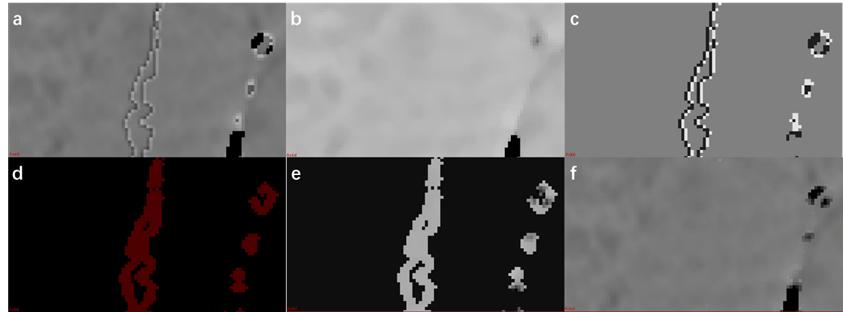
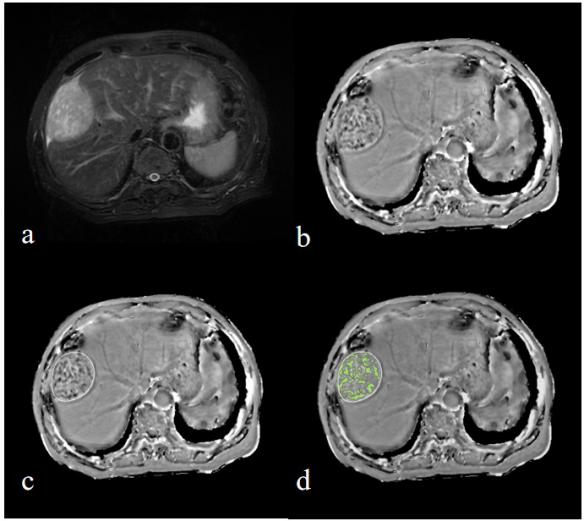
From December 2018 to November 2020, 54 patients in our hospital who were pathologically confirmed as HCC, including well-moderately differentiated HCC group (n = 36, 28 male, 8 female, (60.56 ± 8.96) years old) and poorly-differentiated HCC group (n = 18, 13 male, 5 female, (55.61 ± 10.68) years old). All patients underwent abdominal MR examinations with 1.5 T MR scanner (Signa HDxt, GE Medical Systems, USA), including T1WI, T2WI and 3D gradient echo (GRE) ESWAN sequence. Detailed MR scanning parameters are shown in Table 1. All images on ESWAN sequence were transferred to the GE AW 4.6 workstation for post-processing in Functool software. Due to the acquisition, there are banding artifacts in the phase image as shown in Figure 1 (a). Therefore, the workflow shown in Figure 1 is first used to remove artifacts from the input phase map. The workflow is as follows: (i) Firstly, the abnormal pixels with high gray value and low gray value in the phase map are detected; (ii) Then, the artifact region is determined according to the feature of adjacent pixels of high pixel value and low pixel value; (iii) Finally, the pixel values in the artifact region are recalculated according to the gray values of the surrounding non-artifact pixels. Phase map after using batch program to remove artifacts were exported as NII format, and transmitted to AnatomySketch (AS) software, which is programmed using C++ based on Qt and VTK libraries (Dalian University of Technology). Referencing to T2WI images, regions of interest (ROI) were delineated around the edge of the tumor on phase maps, excluding tumor pseudocapsule (Figure 2). ROI can be obtained without layer-by-layer annotation through the interpolation and annotation tools of AS. After that, the AS software can automatically calculate the ITSS ratio of the phase maps. ITSS ratio was defined as the ratio of ITSSs to the lesion involving area on tumor maximal axial section [5]. All statistic analyses were analyzed by SPSS 25.0 software. Normal distribution was tested by Shapiro-Wilks test. ITSS values between well-moderately and poorly-differentiated HCC were compared using Mann-Whitney U test. Spearman’s rank correlation test was used to evaluate ITSS value and HCC histological grading. Receiver operating characteristic (ROC) analysis was performed to evaluate diagnostic performance.Results
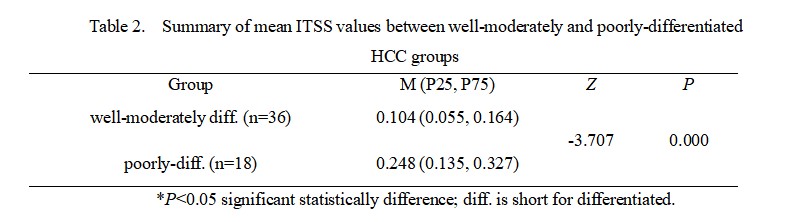
There was significant difference of ITSS value between well-moderately and poorly-differentiated group (P < 0.001, shown in Table 2). The ITSS value of poorly-differentiated HCCs (0.248 (0.135, 0.327)) was higher than that of well-moderately differentiated HCC (0.104 (0.055, 0.164)). Spearman’s rank correlation coefficient of ITSS values and HCC histological grading was 0.509 (P = 0.0001). The AUC of ITSS was 0.812, sensitivity of 83.3%, specificity of 66.7% (Figure 3).Discussion and Conclusion
This study showed that quantitative ITSS had good performance in differentiating HCC histological grading (AUC = 0.812, p <0.0001). Theoretically, the higher the degree of malignancy of a tumor, the more complicated its internal structure, and the display of these complicated components contributes to the pathological grading of tumors [4]. Because of hypoxic microenvironment and more easily ruptured abnormal neovessels, deoxygenated hemoglobin and hemoglobin decomposition products increased [4]. SWI is rather sensitive to detect the change of deoxyhemoglobin, and to reflect microhemorrhage [4]. Semi-quantitative measurement of ITSSs on SWI has been reported as a promising parameter for both tumor grade evaluation and central nervous system tumor differentiation [3]. In the present study, we proposed that ITSS could be a promising imaging biomaker that allow evaluating histological grading of HCC quantitatively and automatically.Acknowledgements
Thanks sincerely to my dear tutor and all my group parterns.References
[1] Wang, F., Numata, K., Nakano, M., et al. Diagnostic Value of Imaging Methods in the Histological Four Grading of Hepatocellular Carcinoma. Diagnostics (Basel, Switzerland), 2020;10(5): 321
[2] Bhattacharjee, R., Gupta, R. K., Patir, R., et al. Quantitative vs. semiquantitative assessment of intratumoral susceptibility signals in patients with different grades of glioma. Journal of magnetic resonance imaging, 2019;51(1), 225-233.
[3] Yang, X., Zhu, J., Dai, Y., et al. Multi-parametric effect in predicting tumor histological grade by using susceptibility weighted magnetic resonance imaging in tongue squamous cell carcinoma. BMC medical imaging, 2019;19(1), 24.
[4] Xin, J. Y., Gao, S. S., Liu, J. G., et al. The value of ESWAN in diagnosis and differential diagnosis of prostate cancer: Preliminary study. Magnetic resonance imaging, 2017;12(44), 26-31.
[5] Park, S. M., Kim, H. S., Jahng, G. H., et al. Combination of high-resolution susceptibility-weighted imaging and the apparent diffusion coefficient: added value to brain tumour imaging and clinical feasibility of non-contrast MRI at 3T. The British journal of radiology, 2010;83(990): 466-475.
Figures