2338
Free-breathing T1 Mapping of the Whole Liver Using GOAL-SNAP Sequence in Patients with Hilar Cholangiocarcinoma1Center for Biomedical Imaging Research, Department of Biomedical Engineering, School of Medicine, Tsinghua University, Beijing, China, 2Hepato-pancreato-biliary Center, Beijing Tsinghua Changgung Hospital, School of Medicine, Tsinghua University, Beijing, China, 3School of Biomedical Engineering and Imaging Sciences, King's College London, London, United Kingdom, 4Philips Healthcare, Beijing, China
Synopsis
T1 mapping combined with MR contrast agent administration has been applied to evaluate the liver function. However, conventional liver T1 mapping techniques have some limitations, such as the need of breath-holding, limited slice coverage or the need of multiple acquisitions. In this study, a free-breathing whole liver T1 mapping technique was proposed using a single scan. Preliminary results in patients with HCCA demonstrated its great potential for T1 quantification of the liver and liver function estimation.
Introduction
Hilar cholangiocarcinoma (HCCA) is a rare disease but has a high degree of malignancy1. Most patients with HCCA suffer from obstructive cholestasis due to severe biliary obstruction. To reduce post-hepatectomy mortality and complications, preoperative biliary drainage and portal vein embolization (PVE) are necessary for HCCA patients with hyperbilirubinemia and insufficient liver remnant2. Evaluation of liver function is important for the following hepatectomy surgery planning3,4. In recent years, T1 mapping before and after contrast administration have been used for liver function evaluation5-7. However, conventional liver T1 mapping techniques were usually performed under breath-holding5-8, and have limited slice coverage5,8 or relied on multiple acquisitions1,6,7. Thus, in this study, we proposed a free-breathing whole liver T1 mapping technique in a single scan and tested its clinical feasibility in patients with HCCA.Methods
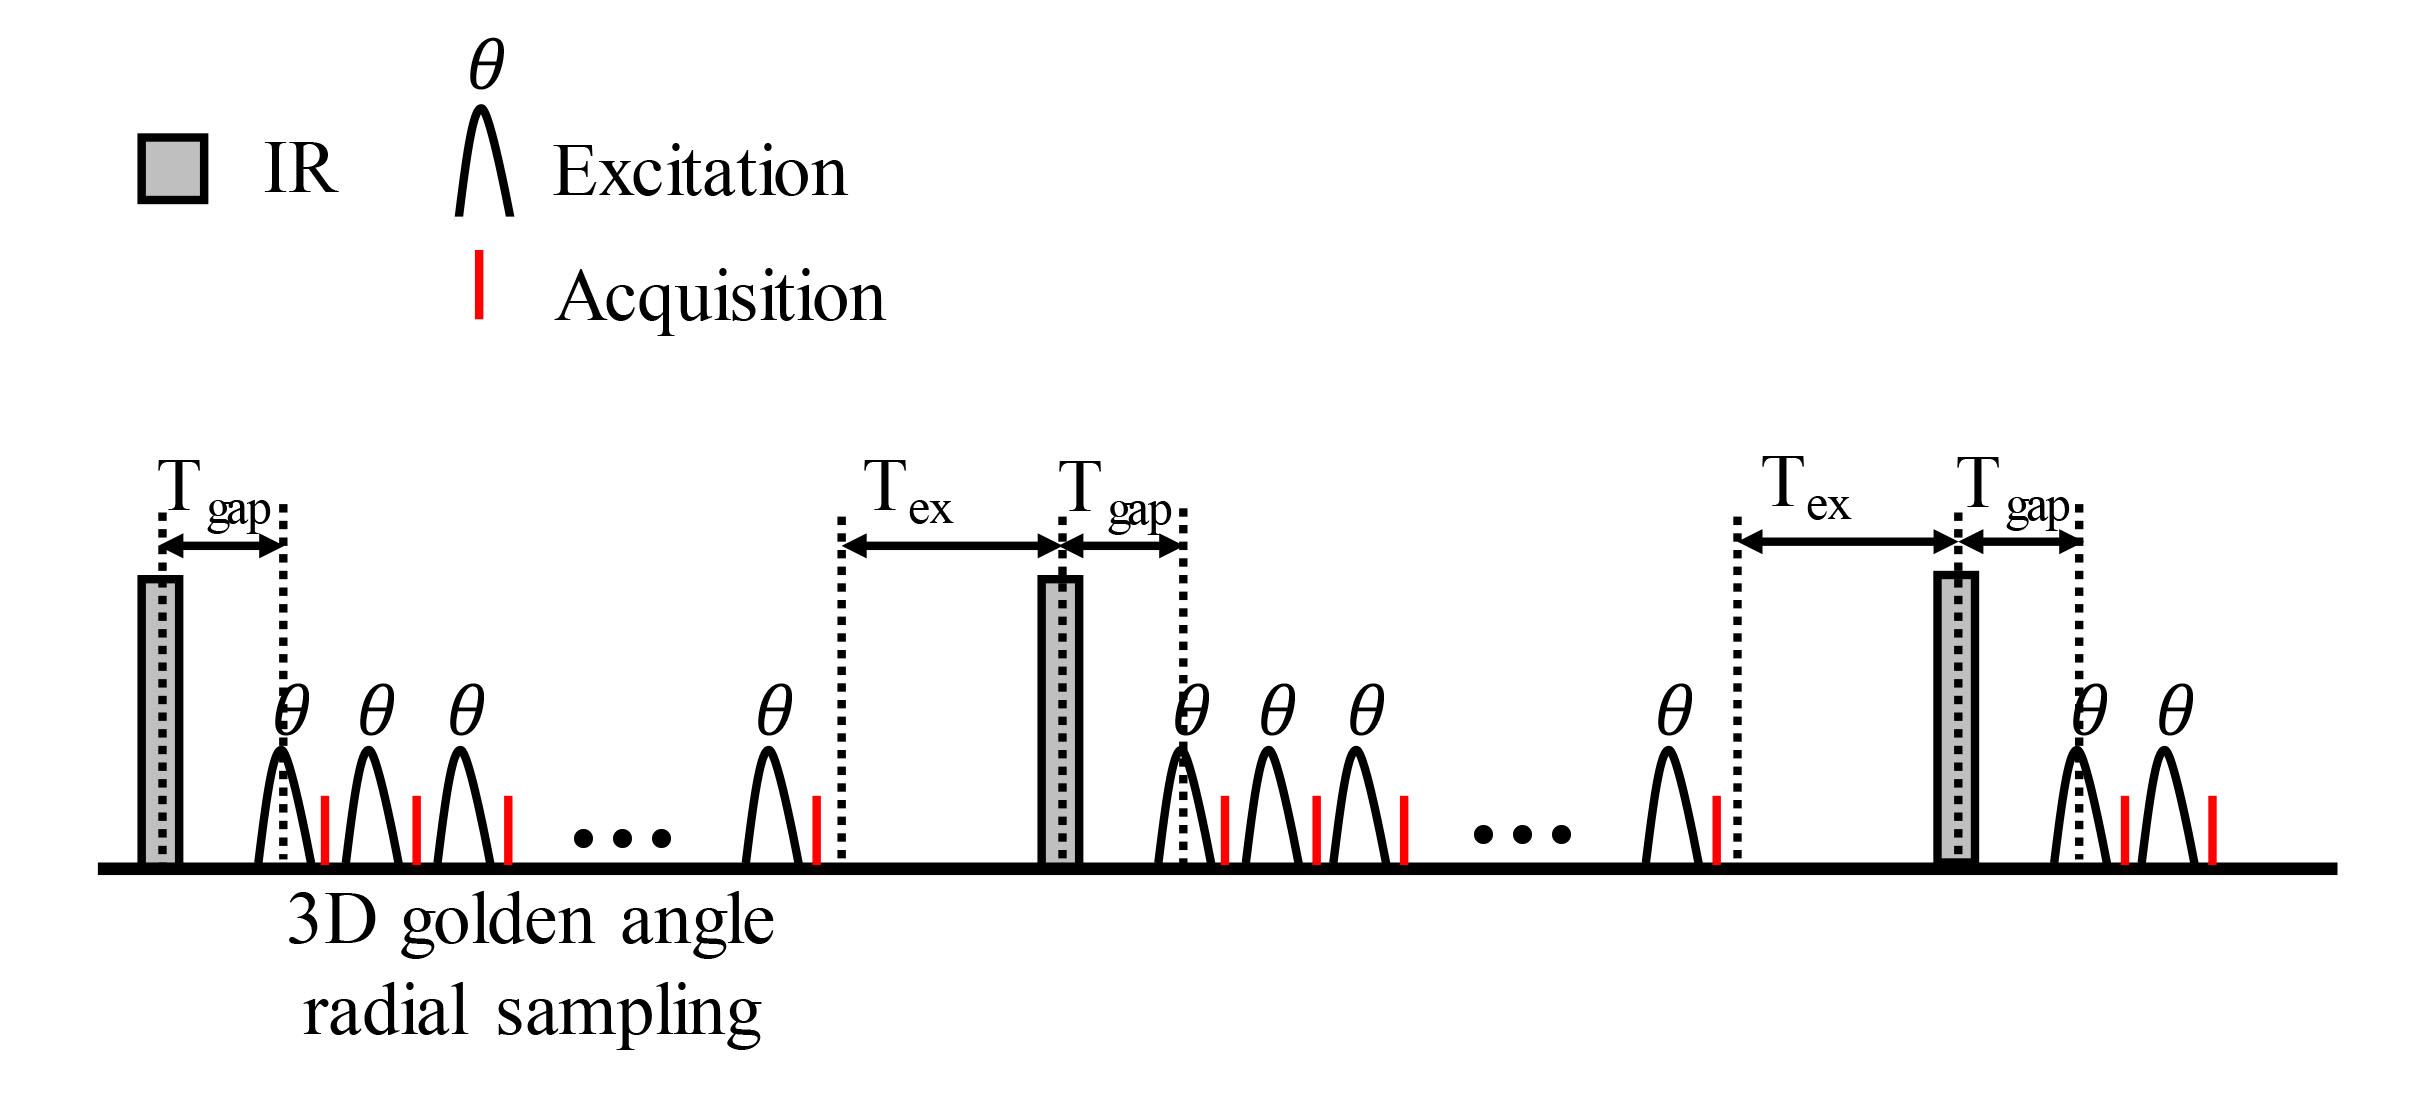
Sequence: GOAL-SNAP sequence9 was optimized for T1 quantification of the liver. The sequence included an inversion recovery (IR) preparation pulse followed by a series of 3D golden angle radial acquisition (Figure 1). The scan parameters were as follows: FOV=240-320 mm3, spatial resolution=2×2×2 mm3, TR/TE=10.3/3.2 ms, flip angle=8°, TFE factor=155, Tgap=11.5 ms, Tex=392 ms, IRTR=2000 ms, scan duration=7-10 min.Patients and MR Imaging: Three patients with HCCA were recruited after the institutional review board approval and obtaining informed consent. For patients with hyperbilirubinemia, MR scans were performed after biliary drainage. For patients with the insufficient liver remnant, PVE was also performed before the MR scan. For patients with normal bilirubin and sufficient liver remnant, MR scans were performed after hospital admission. All the scans were performed on a 3.0 T MR scanner (Ingenia CX, Philips Healthcare, Best, Netherlands) using a 16-channel torso coil and a 16-channel posterior coil. During the MR scan, 0.025 mmol/kg Gd-EOB-DTPA (Primovist; Bayer Schering Pharma, Berlin, Germany) was injected at a rate of 2 ml/s. GOAL-SNAP sequence was performed pre-contrast and 20 min after Gd-EOB-DTPA administration. Patients were instructed to breathe normally during the GOAL-SNAP acquisition.
Image Reconstruction and Analysis: A series of T1-weighted images were reconstructed using a sliding window method9 with a temporal width of 19 spokes (temporal resolution=196 ms) from GOAL-SNAP sequence. Low-rank and sparsity constraint (LRS) reconstruction method10 was applied to further improve the image quality. Then, T1 mapping of the liver was estimated by fitting the signal intensities extracted from a series of T1-weighted images to T1 inversion recovery curve9. The difference between the pre- and post-contrast T1 mapping was calculated by ΔT1=(T1pre-T1post)/T1pre pixel by pixel, which can reflect the liver function. For each of the left and the right lobes, twenty square ROIs (144 mm2) were drawn on different slices and the mean ΔT1 within each ROI was averaged. For each case, the difference between the ΔT1 of the left and the right lobe was compared using the paired t test or Wilcoxon rank-sum test. ΔT1 of the whole liver was defined as the mean ΔT1 within the whole liver region. The correlation between the ΔT1 of the whole liver and total bilirubin (TBIL) was tested using the Pearson or Spearman correlation.
Results
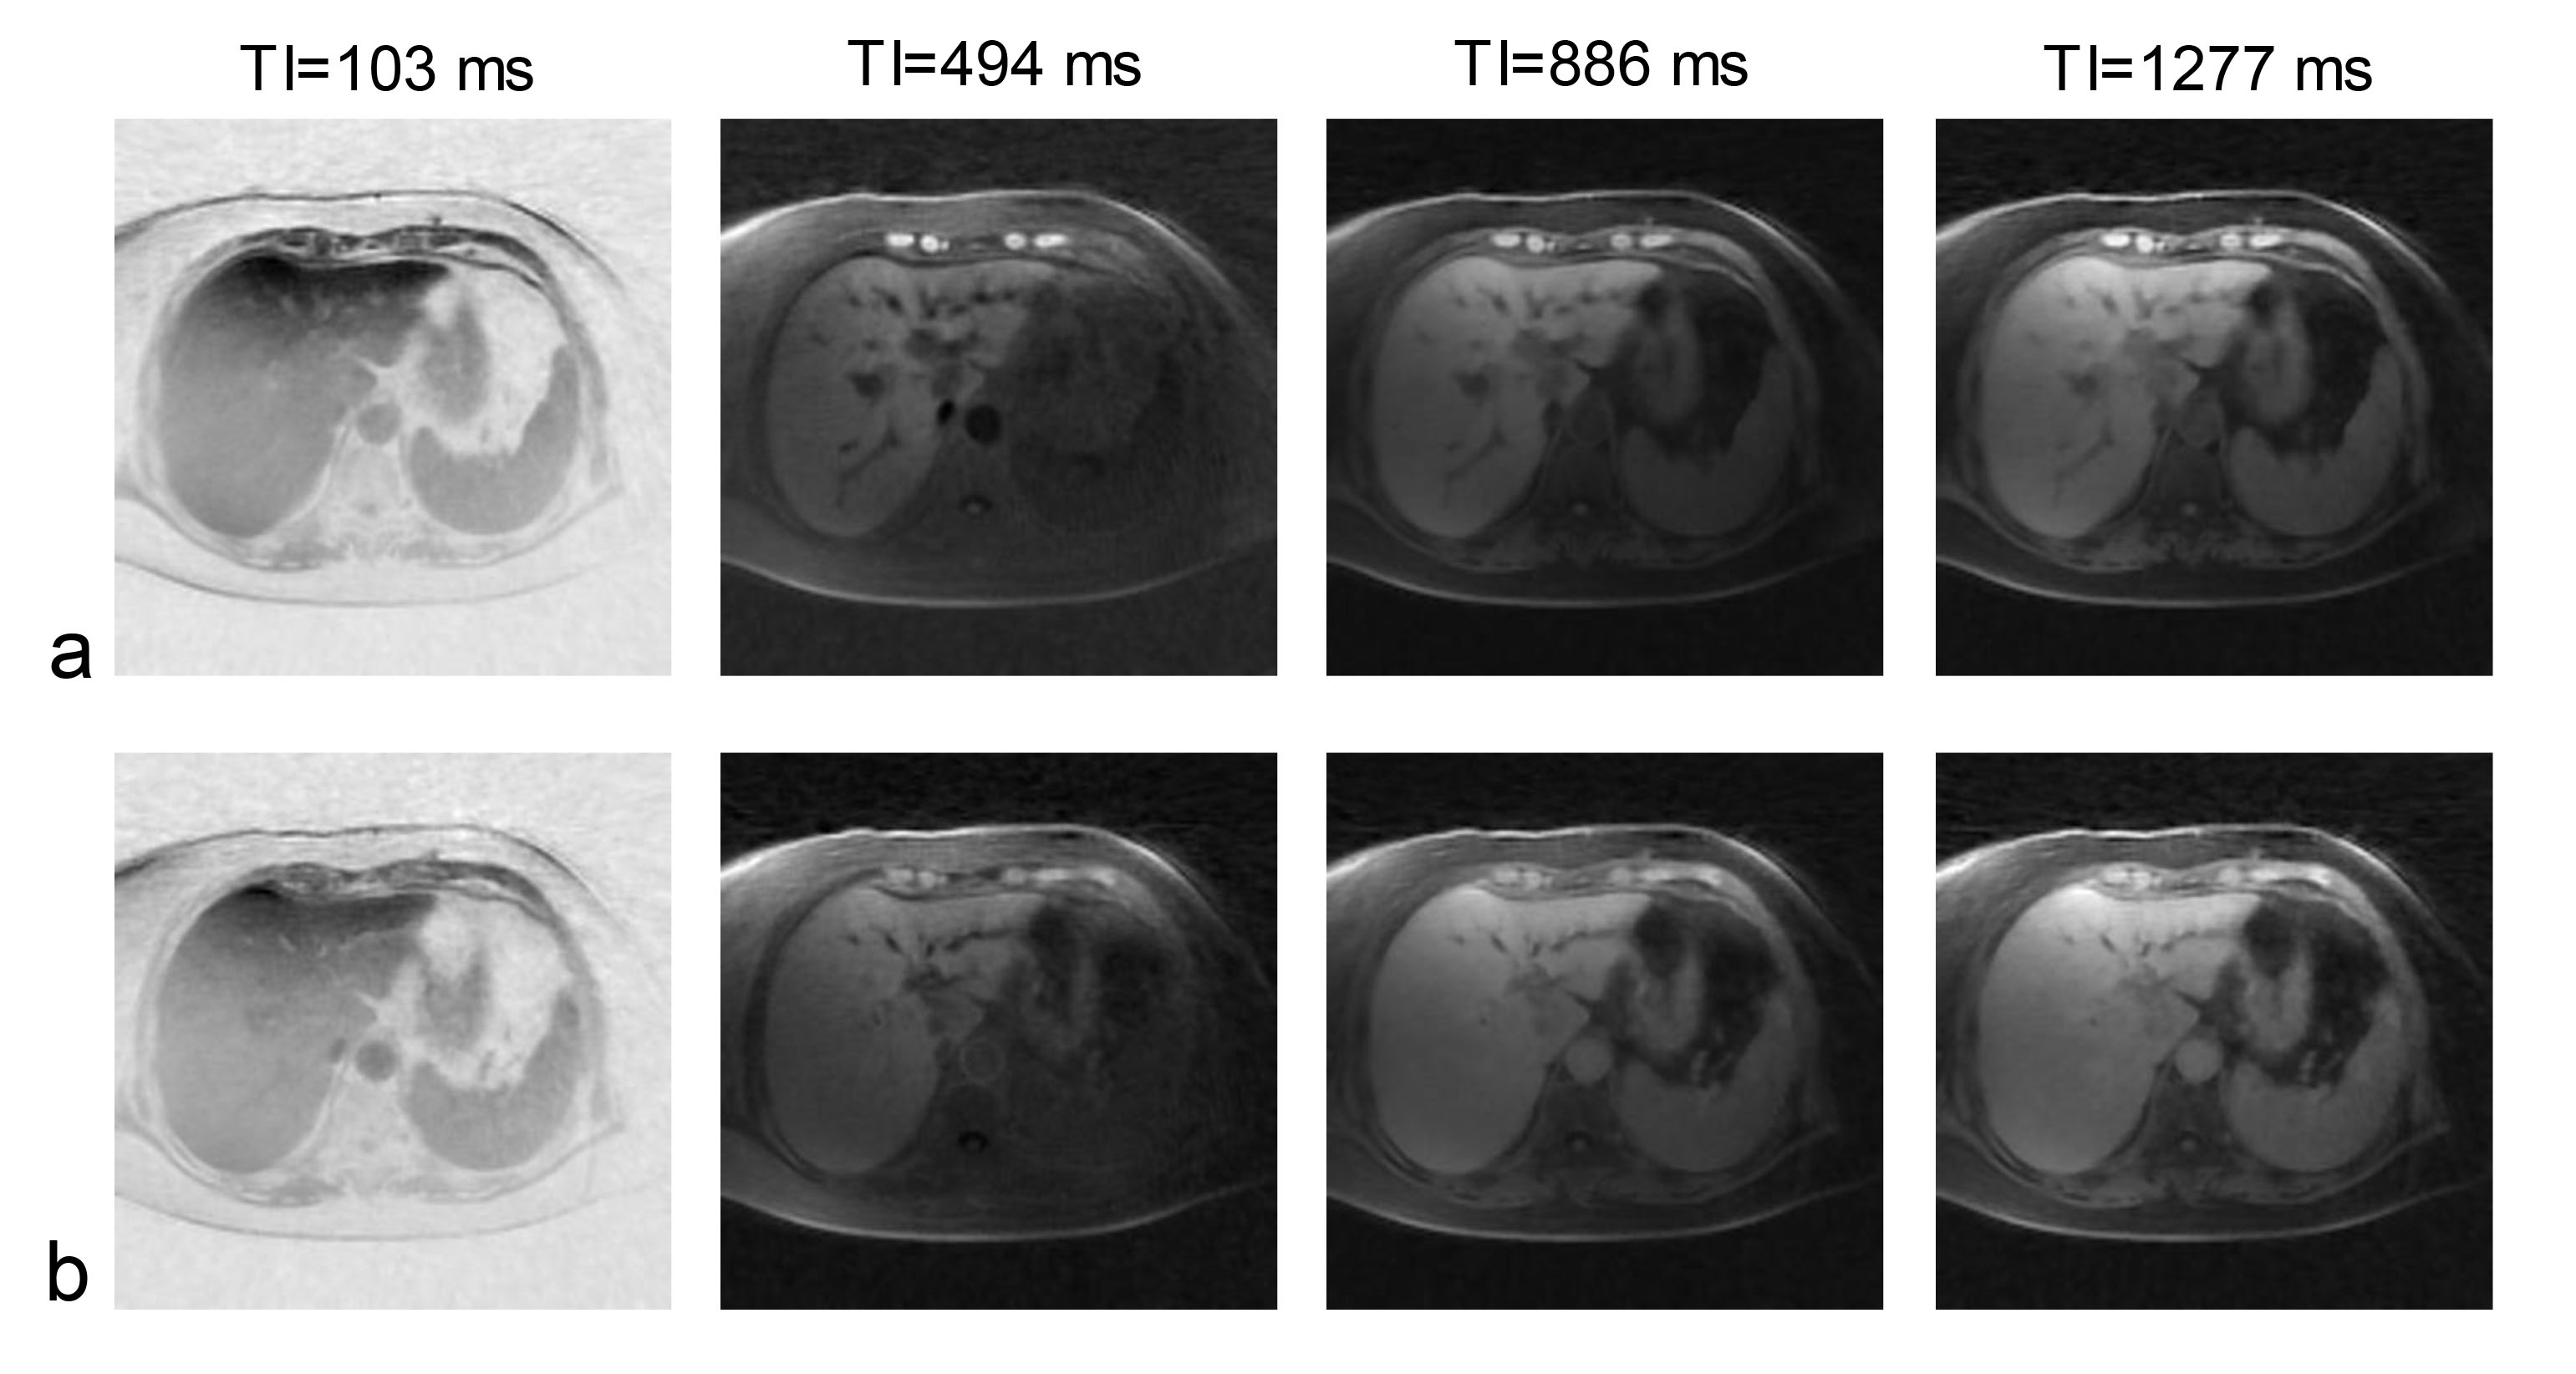
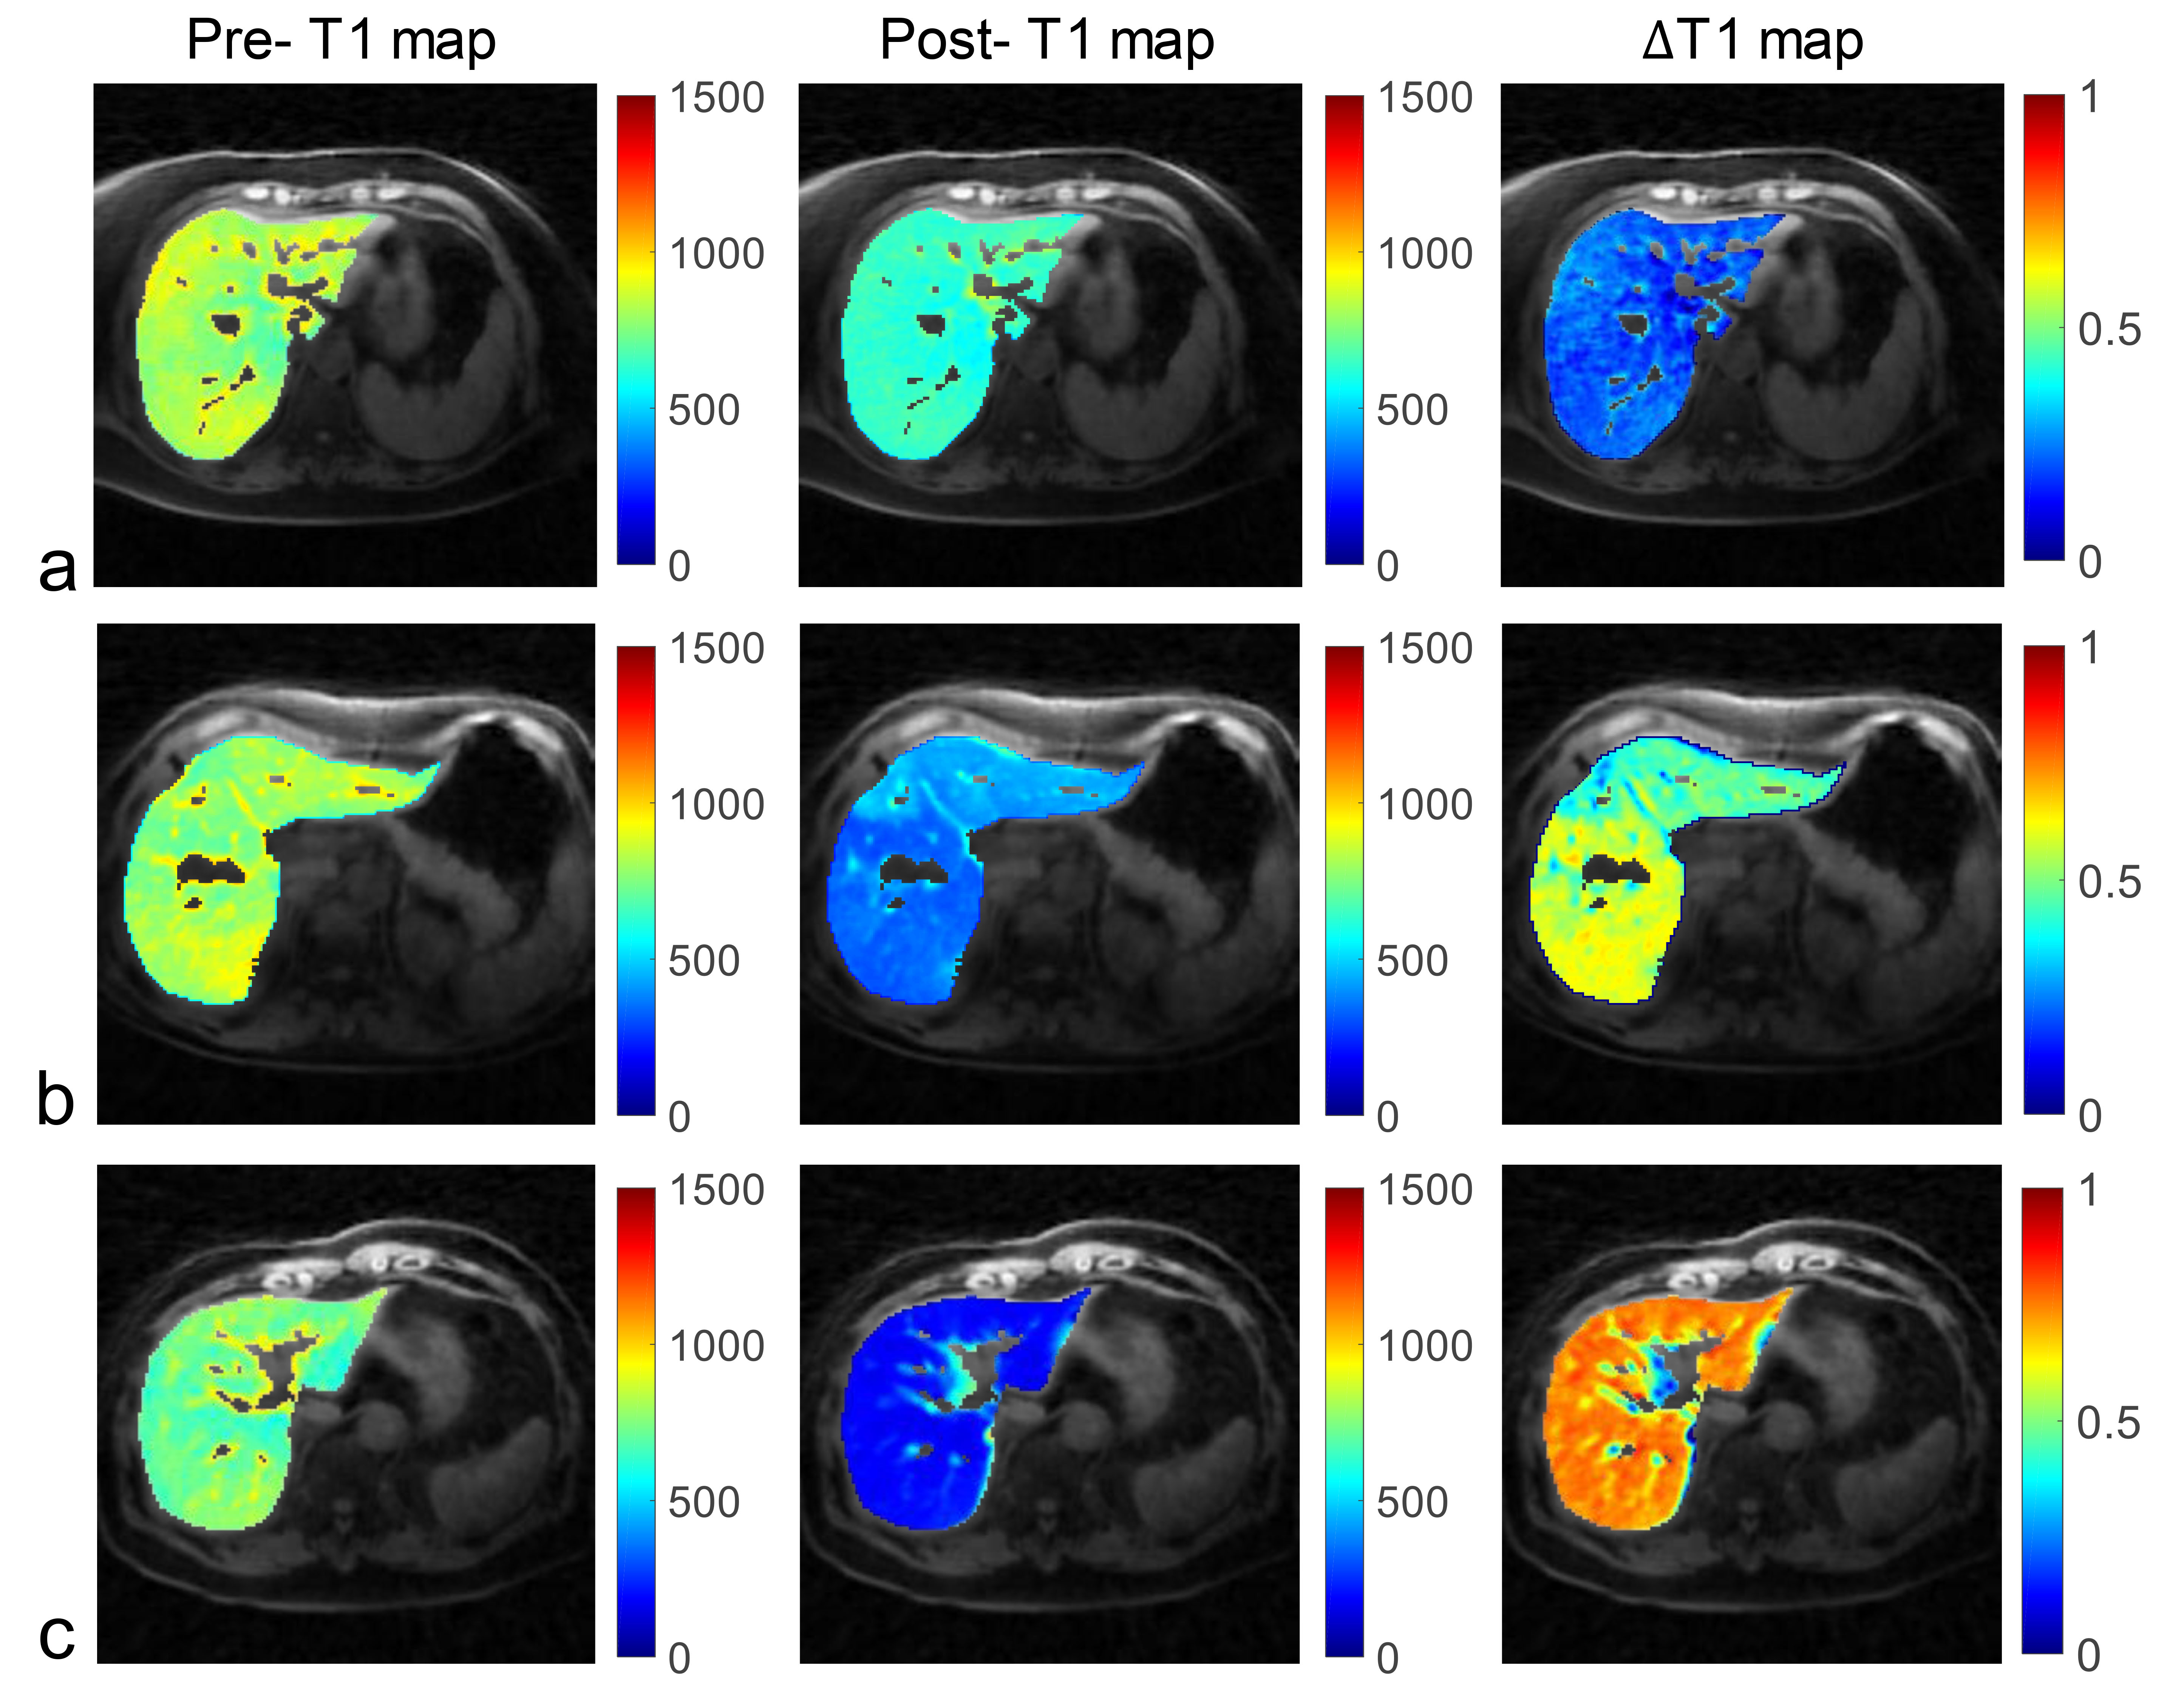
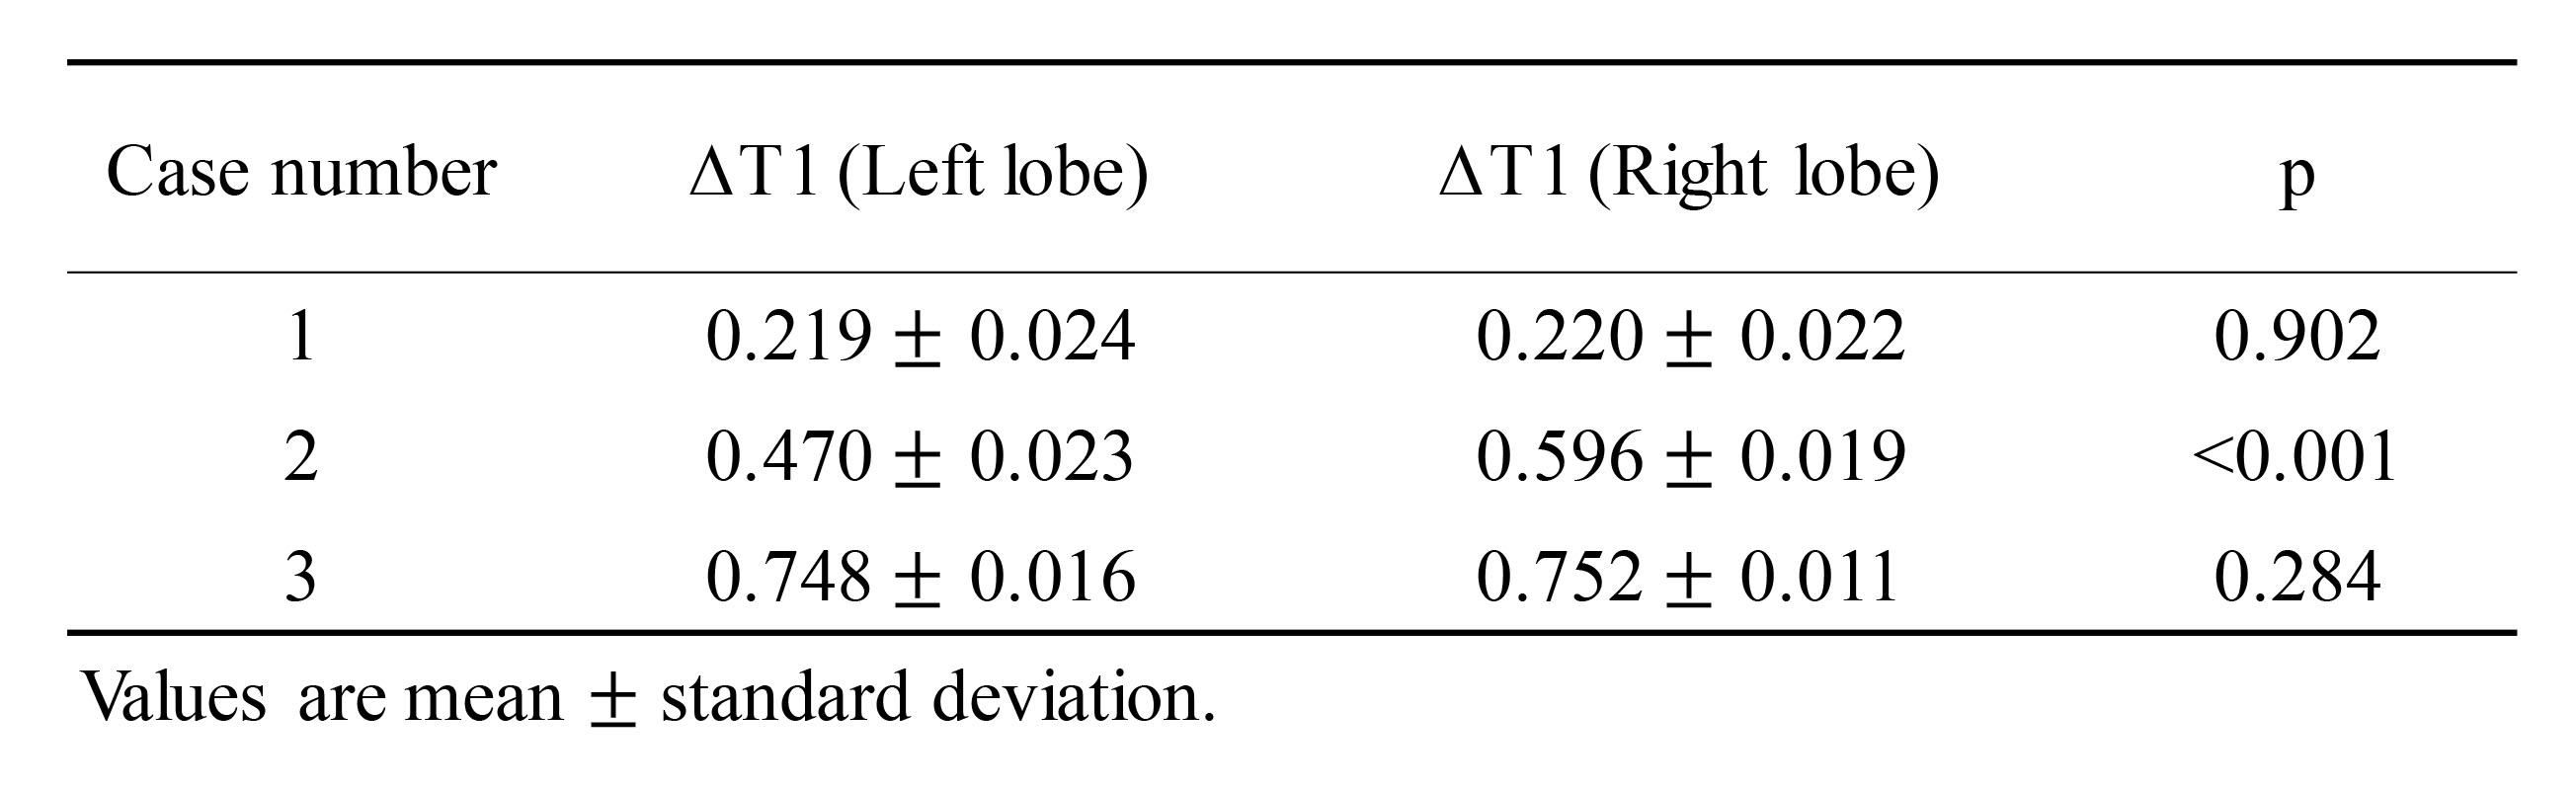
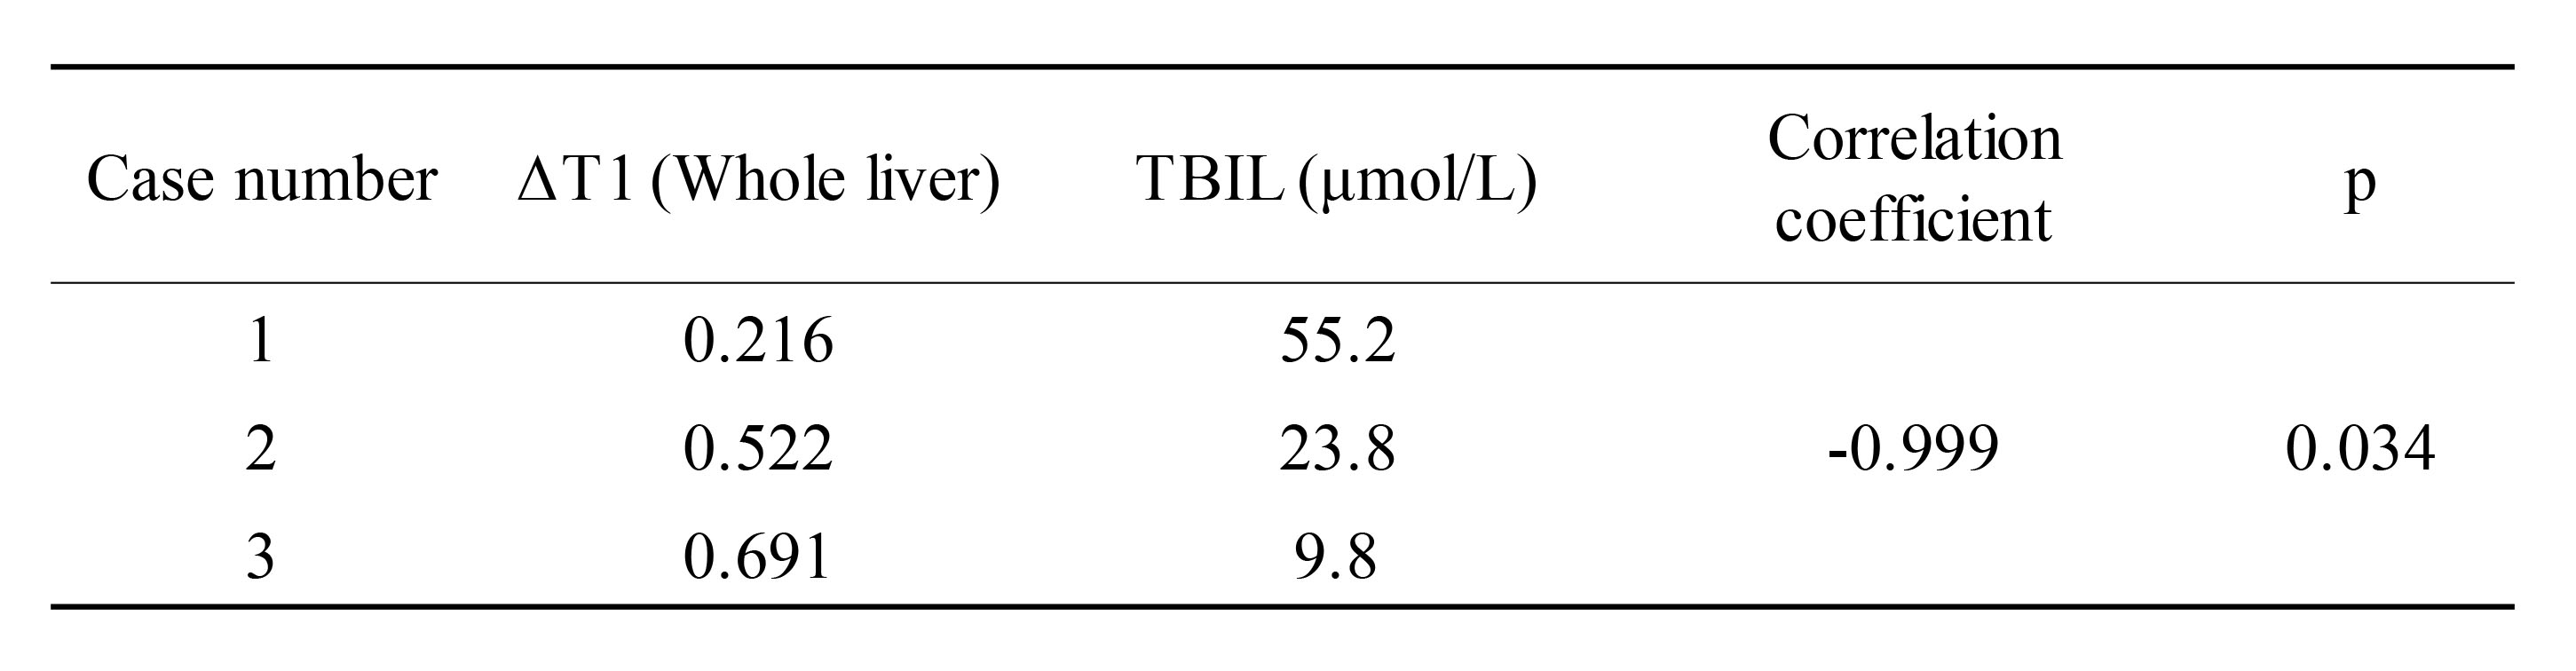
All three patients (3 females, age 62-67 years) completed the pre- and post-contrast GOAL-SNAP acquisitions. T1-weighted images at different inversion times (TI) reconstructed from pre-contrast (Fig.2a) and post-contrast (Fig.2b) GOAL-SNAP sequences of one patient (female, age 62 years) were shown in Figure 2. The pre-contrast T1 map, post-contrast T1 map and ΔT1 map of this patient were shown in Figure 3a. MR scan of this patient was acquired after bilateral drainage (without PVE). The TBIL decreased from 92.7μmol/L to 55.2μmol/L after drainage. No significant discrepancy was found on ΔT1 map between the left and the right lobes (mean 0.219 vs. 0.220, p=0.902, Fig.3a, Table 1). Maps of another patient (female, age 64 years) who underwent bilateral drainage and left PVE were shown in Figure 3b. The TBIL decreased from 288.64μmol/L to 23.8μmol/L after drainage and PVE. The left lobe and the right lobe showed significant differences on ΔT1 map (mean 0.470 vs. 0.596, p<0.001, Fig.3b, Table 1). Maps of the third patient (female, age 67 years) were shown in Figure 3c. This patient had normal bilirubin (TBIL 9.8μmol/L) and sufficient liver remnant, thus no drainage or PVE was performed. No significant difference was found on ΔT1 map between the left and the right lobes (mean 0.748 vs. 0.752, p=0.284, Fig.3c, Table 1). ΔT1 of the whole liver showed a significantly negative correlation with TBIL (correlation coefficient=-0.999, p=0.034, Table 2).Discussion and Conclusion
In this study, free-breathing T1 mapping quantification of the whole liver was achieved within one scan using GOAL-SNAP sequence. Preliminary results in patients with HCCA and the association between the measured ΔT1 and TBIL have demonstrated its clinical feasibility for liver function estimation. The functional discrepancy between the two liver lobes was affected by the extent of biliary drainage and PVE. Although no respiratory motion correction algorithm was applied, the proposed free-breathing technique didn’t show obvious motion artifacts on the reconstructed T1-weighted images and the estimated T1 map. This benefits from the inherent motion insensitivity of the 3D golden angle radial trajectory. Furthermore, more in-vivo studies are required to explore the clinical value of the proposed T1 mapping technique.Acknowledgements
None.References
1. Mansour JC, Aloia TA, Crane CH, Heimbach JK, Nagino M, Vauthey J-N. Hilar Cholangiocarcinoma: expert consensus statement. HPB 2015;17:691-9.
2. Nagino M, Takada T, Miyazaki M, et al. Preoperative biliary drainage for biliary tract and ampullary carcinomas. Journal of hepato-biliary-pancreatic surgery 2008;15:25-30.
3. Sumiyoshi T, Shima Y, Okabayashi T, et al. Functional discrepancy between two liver lobes after hemilobe biliary drainage in patients with jaundice and bile duct cancer: an appraisal using (99m)Tc-GSA SPECT/CT fusion imaging. Radiology 2014;273:444-51.
4. Sumiyoshi T, Shima Y, Okabayashi T, et al. Liver function assessment using 99mTc-GSA single-photon emission computed tomography (SPECT)/CT fusion imaging in hilar bile duct cancer: A retrospective study. Surgery 2016;160:118-26.
5. Kim JE, Kim HO, Bae K, Choi DS, Nickel D. T1 mapping for liver function evaluation in gadoxetic acid-enhanced MR imaging: comparison of look-locker inversion recovery and B(1) inhomogeneity-corrected variable flip angle method. European radiology 2019;29:3584-94.
6. Zhou ZP, Long LL, Qiu WJ, et al. Evaluating segmental liver function using T1 mapping on Gd-EOB-DTPA-enhanced MRI with a 3.0 Tesla. BMC medical imaging 2017;17:20.
7. Yoon JH, Lee JM, Kim E, Okuaki T, Han JK. Quantitative Liver Function Analysis: Volumetric T1 Mapping with Fast Multisection B(1) Inhomogeneity Correction in Hepatocyte-specific Contrast-enhanced Liver MR Imaging. Radiology 2017;282:408-17.
8. Obmann VC, Mertineit N, Marx C, et al. Liver MR relaxometry at 3T - segmental normal T(1) and T(2)* values in patients without focal or diffuse liver disease and in patients with increased liver fat and elevated liver stiffness. Scientific reports 2019;9:8106.
9. Qi H, Sun J, Qiao H, et al. Carotid Intraplaque Hemorrhage Imaging with Quantitative Vessel Wall T1 Mapping: Technical Development and Initial Experience. Radiology 2018;287:276-84.
10. Qi H, Qiao H, Sun A, et al. Highly Undersampled Kooshball Reconstruction with Low-rank Modeling and Sparsity Constraints for High-resolution T1 Mapping. In Proceedings of the 26th Annual Meeting of ISMRM 2018; Paris, France. p. 0248.
Figures