2336
AI Methods for Predicting Sensitivity of Total Neoadjuvant Treatment (TNT) in Rectal Cancer Based on Multiparameter MRI and Clinical Data1Department of Radiation Oncology, Cancer Center, West China Hospital, Sichuan University, Chengdu, China, 2Chengdu Institute of Computer Application, Chinese Academy of Sciences, Chengdu, China, 3University of Chinese Academy of Sciences, Beijing, China
Synopsis
This work aimed for developing a model for predicting sensitivity and response of total neoadjuvant treatment (TNT) for locally advanced rectal cancer (LARC) based on baseline magnetic resonance imaging (MRI) and clinical data by artificial intelligence method. The results showed that the models for predicting high sensitivity and pCR built with radiomics features achieved the mean area under the ROC curve (AUC) of 0.85 respectively, while the other built with deep-learning (DL) method yielded the mean AUC of 0.82 and 0.84 respectively. The models of two methods for predicting high sensitivity and pCR may be valuable in clinical practice.
Purpose
To develop a model for predicting sensitivity of TNT for rectal cancer based on baseline MRI and clinical data using artificial intelligence method.Introduction
It is very important to optimize neoadjuvant treatment for patients with rectal cancer. Recently, the National Comprehensive Cancer Network (NCCN) recommended total neoadjuvant treatment (TNT), which is an extensive and optimized therapeutic modality, as an acceptable treatment strategy for locally advanced rectal cancer (LARC). The treatment time of TNT is too long. If the sensitivity of neoadjuvant treatment regimens can be predicted before treatment, individualized and accurate treatment regimen can be provided. Multiparameter MRI is an important method for accurate staging and efficacy evaluation of rectal cancer. With the development of artificial intelligence and radiomics, more and more studies have been conducted on prediction of neoadjuvant treatment response based on multiparameter MRI1-5. So far, there was no well recognized model or marker to predict the efficacy of rectal cancer. Therefore, we conduct a study to solve the problems mentioned above. In this study, we would preliminarily develop a model for predicting sensitivity of TNT for patients with LARC based on baseline MRI and clinical data using artificial intelligence method.Materials and Methods
The present study enrolled 101 patients with LARC who underwent baseline MR examinations retrospectively. All patients have underwent TNT. Patients received induction chemotherapy (ICT) followed by neoadjuvant concurrent chemoradiotherapy (CRT). After that, consolidation chemotherapy (CCT) were delivered. Finally, surgical resection with total mesorectal excision (TME) would be performed 8-10 weeks after CRT. We defined two groups of response and sensitivity as CR (complete response) vs non-CR (Group 1), and high sensitivity (TRG 0 and TRG 1) vs moderate sensitivity (TRG 2 or patients with TRG 3 and tumor volume of MRI decreased by at least 20% from baseline) vs low sensitivity (TRG 3 and tumor volume of MRI did not decrease by 20% from baseline) (Group 2), respectively. The regions of interest (ROIs) are manually outlined at each slice of the lesion on T2-weighted images (T2WI) by two experienced reader. If two readers have disagreement with each other, the final consensus conclusion will be drawn after discussion. Additionally, clinical data together with T2WI are also analyzed. The following clinical data at baseline are included: erythrocyte count, leukocyte count, platelet count, neutrophil count, tumor markers in the blood, liver enzyme, etc. Then the T2WI and clinical data are analyzed using radiomics-clinical model (RC) (Figure 1) and deep learning-clinical model (DLC) (Figure 2). Receiver operating characteristic (ROC) curves analysis is performed to assess diagnostic performance (Figure 3). The predictive capability of response is determined by the sensitivity, specificity, negative predictive value (NPV), and positive predictive value (PPV) (Table 2).Results
Seventy patients were used as a training cohort, and 31 patients as a validation cohort. Table 1 outlined the patients characteristics. There was no low sensitivity but only high sensitivity and moderate sensitivity, because TNT is the strongest neoadjuvant therapy. Figure 1 and Figure 2 were shown the structures of the radiomics-clinical model and the deep learning-clinical model. The models for predicting high sensitivity and pCR built with radiomics features achieved the mean area under the ROC curve (AUC) of 0.85 respectively, while the other built with DL yielded the mean AUC of 0.82 and 0.84 respectively (Figure 3). The highest prediction accuracy was the radiomics-clinical model for predicting pCR (Table 2). There was no significant difference between radiomics-clinical model and deep learning-clinical model (Table 2).Discussion
In the current study, we have built models for predicting sensitivity of TNT for LARC. Radiomics-clinical model and deep learning-clinical model both had good performance. There was no significant difference between radiomics-clinical model and deep learning-clinical model. We concluded that it might be due to the small sample size. Deep learning-clinical model was trained by big data to made sure higher accuracy and prediction performance6,7. In addition, deep learning-clinical model and radiomics-clinical model could achieve similar prediction effect with such small sample size, which indicates that deep learning-clinical model is worth further exploration in the future.Conclusion
We have built models for predicting sensitivity of TNT for rectal cancer based on MRI and clinical data by Radiomics and DL. The models of two methods for predicting high sensitivity and pCR have moderate prediction performance and may be valuable in clinical practice.Acknowledgements
Supported by grants from National Natural Science Foundation of China (82073338). Ganlu Ouyang and Zhebin Chen contributed equally to this work.References
1. Bibault J-E, Giraud P, Housset M, et al. Deep Learning and Radiomics predict complete response after neo-adjuvant chemoradiation for locally advanced rectal cancer. Scientific Reports. 2018;8(1).
2. Horvat N, Veeraraghavan H, Khan M, et al. MR Imaging of Rectal Cancer: Radiomics Analysis to Assess Treatment Response after Neoadjuvant Therapy. Radiology. 2018;287(3):833-843.
3. Shi L, Zhang Y, Nie K, et al. Machine learning for prediction of chemoradiation therapy response in rectal cancer using pre-treatment and mid-radiation multi-parametric MRI. Magn Reson Imaging. 2019;61:33-40.
4. Nie K, Shi L, Chen Q, et al. Rectal Cancer: Assessment of Neoadjuvant Chemoradiation Outcome based on Radiomics of Multiparametric MRI. Clin Cancer Res. 2016;22(21):5256-5264.
5. Zhang XY, Wang L, Zhu HT, et al. Predicting Rectal Cancer Response to Neoadjuvant Chemoradiotherapy Using Deep Learning of Diffusion Kurtosis MRI. Radiology. 2020;296(1):56-64.
6. Benke K, Benke G. Artificial Intelligence and Big Data in Public Health. Int J Environ Res Public Health. 2018;15(12).
7. Tai AMY, Albuquerque A, Carmona NE, et al. Machine learning and big data: Implications for disease modeling and therapeutic discovery in psychiatry. Artif Intell Med. 2019;99:101704.
8. Tran, D., Bourdev, L., Fergus, R., Torresani, L., & Paluri, M. (2015). Learning spatiotemporal features with 3d convolutional networks. In Proceedings of the IEEE international conference on computer vision (pp. 4489-4497).
9. He, K., Zhang, X., Ren, S., & Sun, J. (2016). Deep residual learning for image recognition. In Proceedings of the IEEE conference on computer vision and pattern recognition (pp. 770-778).
10. van Griethuysen, J. J. M., Fedorov, A., Parmar, C., Hosny, A., Aucoin, N., Narayan, V., Beets-Tan, R. G. H., Fillion-Robin, J. C., Pieper, S., Aerts, H. J. W. L. (2017). Computational Radiomics System to Decode the Radiographic Phenotype. Cancer Research, 77(21), e104-e107. https://doi.org/10.1158/0008-5472.CAN-17-0339
11. Chen, T., & Guestrin, C. (2016, August). Xgboost: A scalable tree boosting system. In Proceedings of the 22nd acm sigkdd international conference on knowledge discovery and data mining (pp. 785-794).
Figures
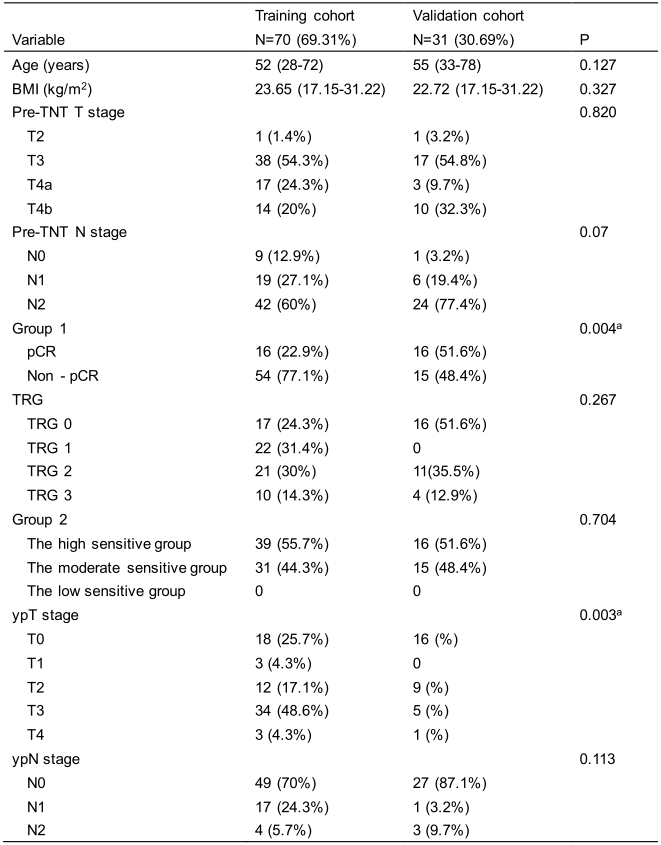
Table 1 Patient Characteristics in the training and validation cohort.
NOTE: Fisher exact tests, as appropriate, were used to compare the differences in categorical variables (pre-TNT T stage, pre-TNT N stage, response, TRG, sensitivity, ypT stage, ypN stage), whereas a two-sample t test was used to compare the differences in numerical variables (age and BMI).
Abbreviations: BMI, ballistic missile interceptor; TNT, total neoadjuvant treatment.
aP < 0.05.
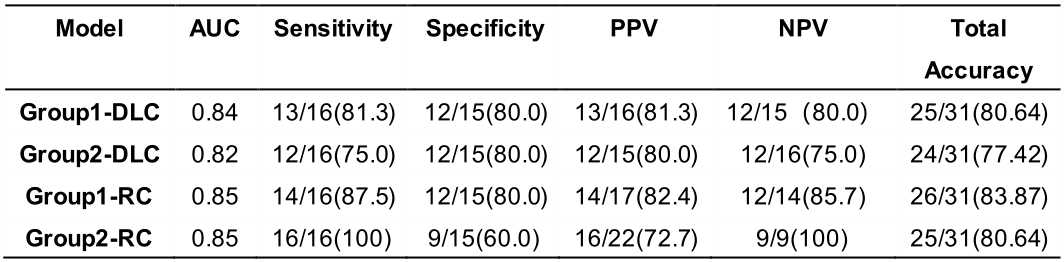
Table 2 Performance of models.
Abbreviations: ACC, accuracy; AUC, the mean area under the ROC curve; PPV, positive predictive value; NPV, negative predictive value (NPV); DLC, deep learning-clinical model; RC, radiomics-clinical model.
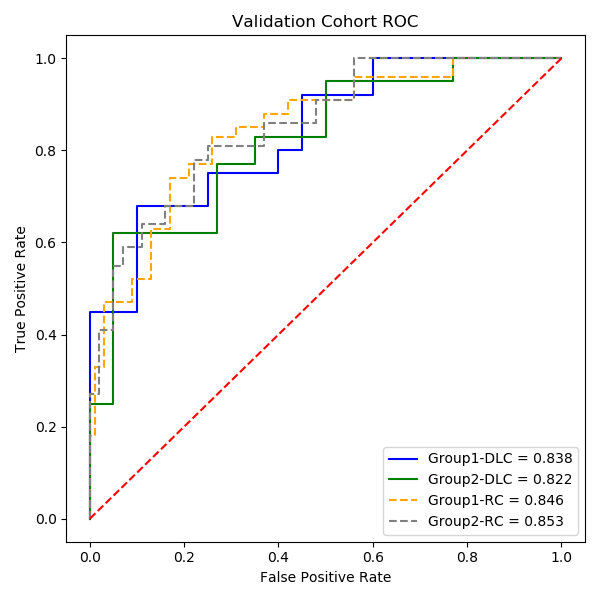
Figure 1 ROC curves for predicting the sensitivity and response to total neoadjuvant treatment (TNT).
Each patient in validation cohort for assessment of the total neoadjuvant treatment (TNT) is shown via the ROC curves. The deep learning-clinical model had an AUC of 0.838 and 0.822 for pCR and high sensitivity, respectively. The radiomics-clinical model had an AUC of 0.846 and 8.53 for pCR and high sensitivity, respectively.
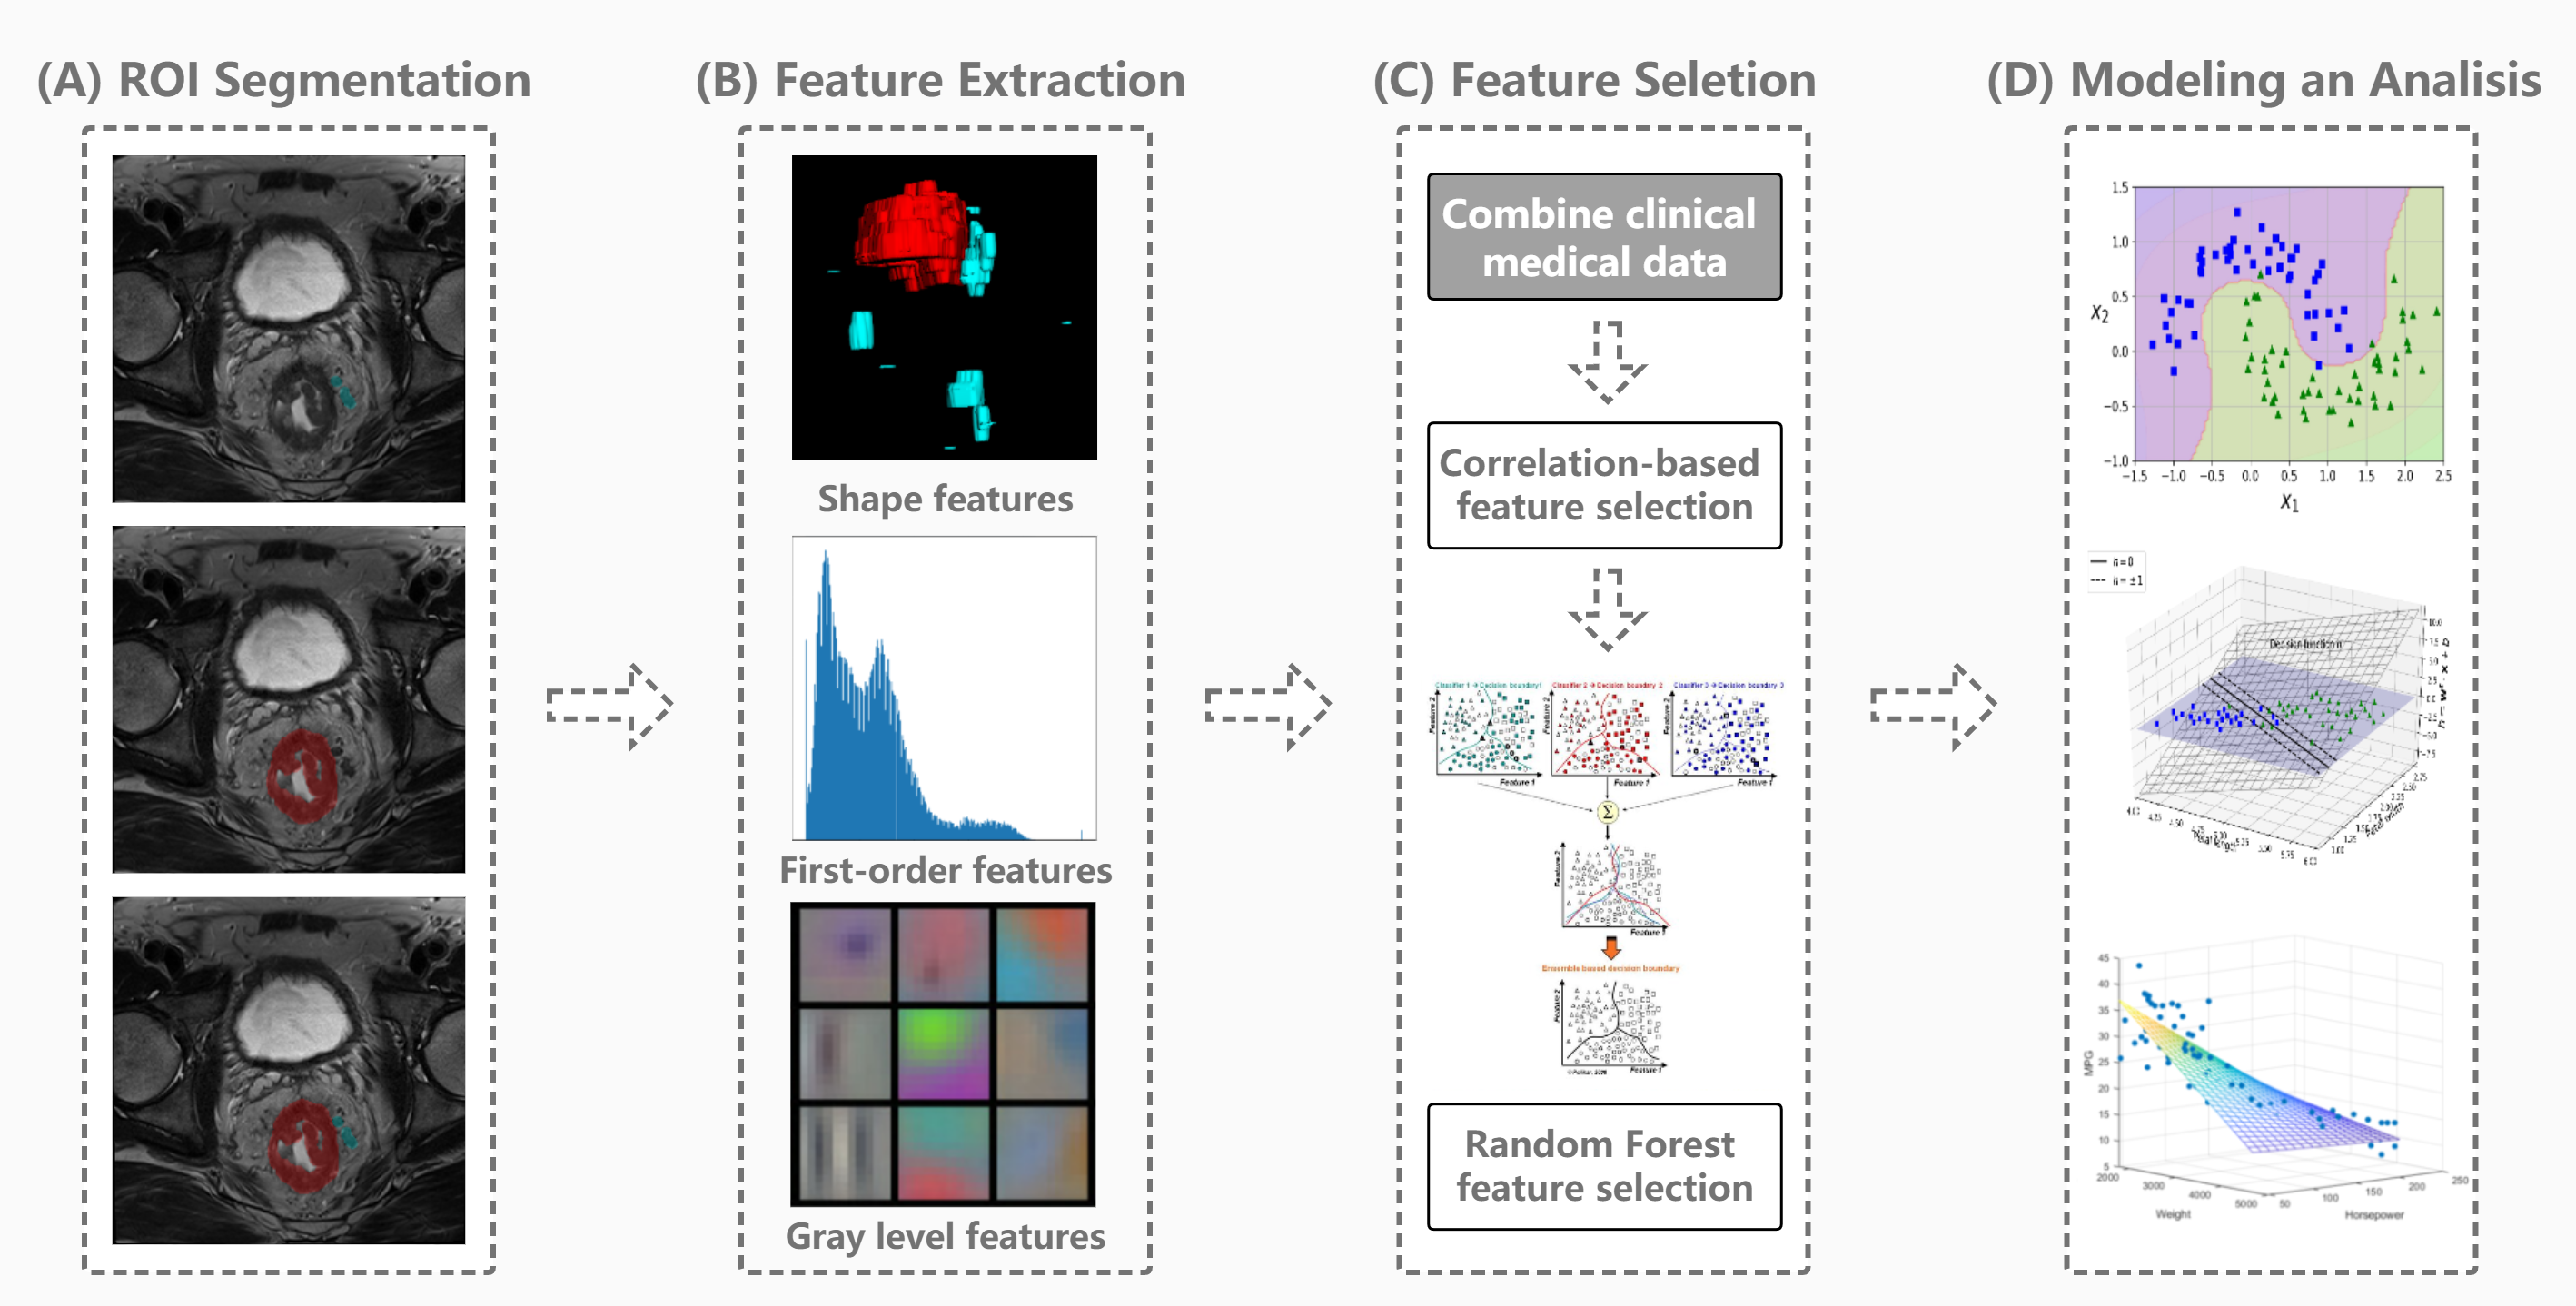
Figure 2 Flow chart and structure of radiomics-clinical model (RC).
(A) ROIs including tumors and lymph nodes are manually segmented in anatomical T2WI using ITK-SNAP software. (B) Radiomics features are extracted by pyradiomics10 in python, including First Order Statistics, Shape-based, Gray Level feature, etc. (C) Feature selection process including the correlation-based and random forest feature selection algorithm are performed for building T2WI radiomics and clinical signature. (D) Logistic regression is used to build a radiomics and clinical features combined model.
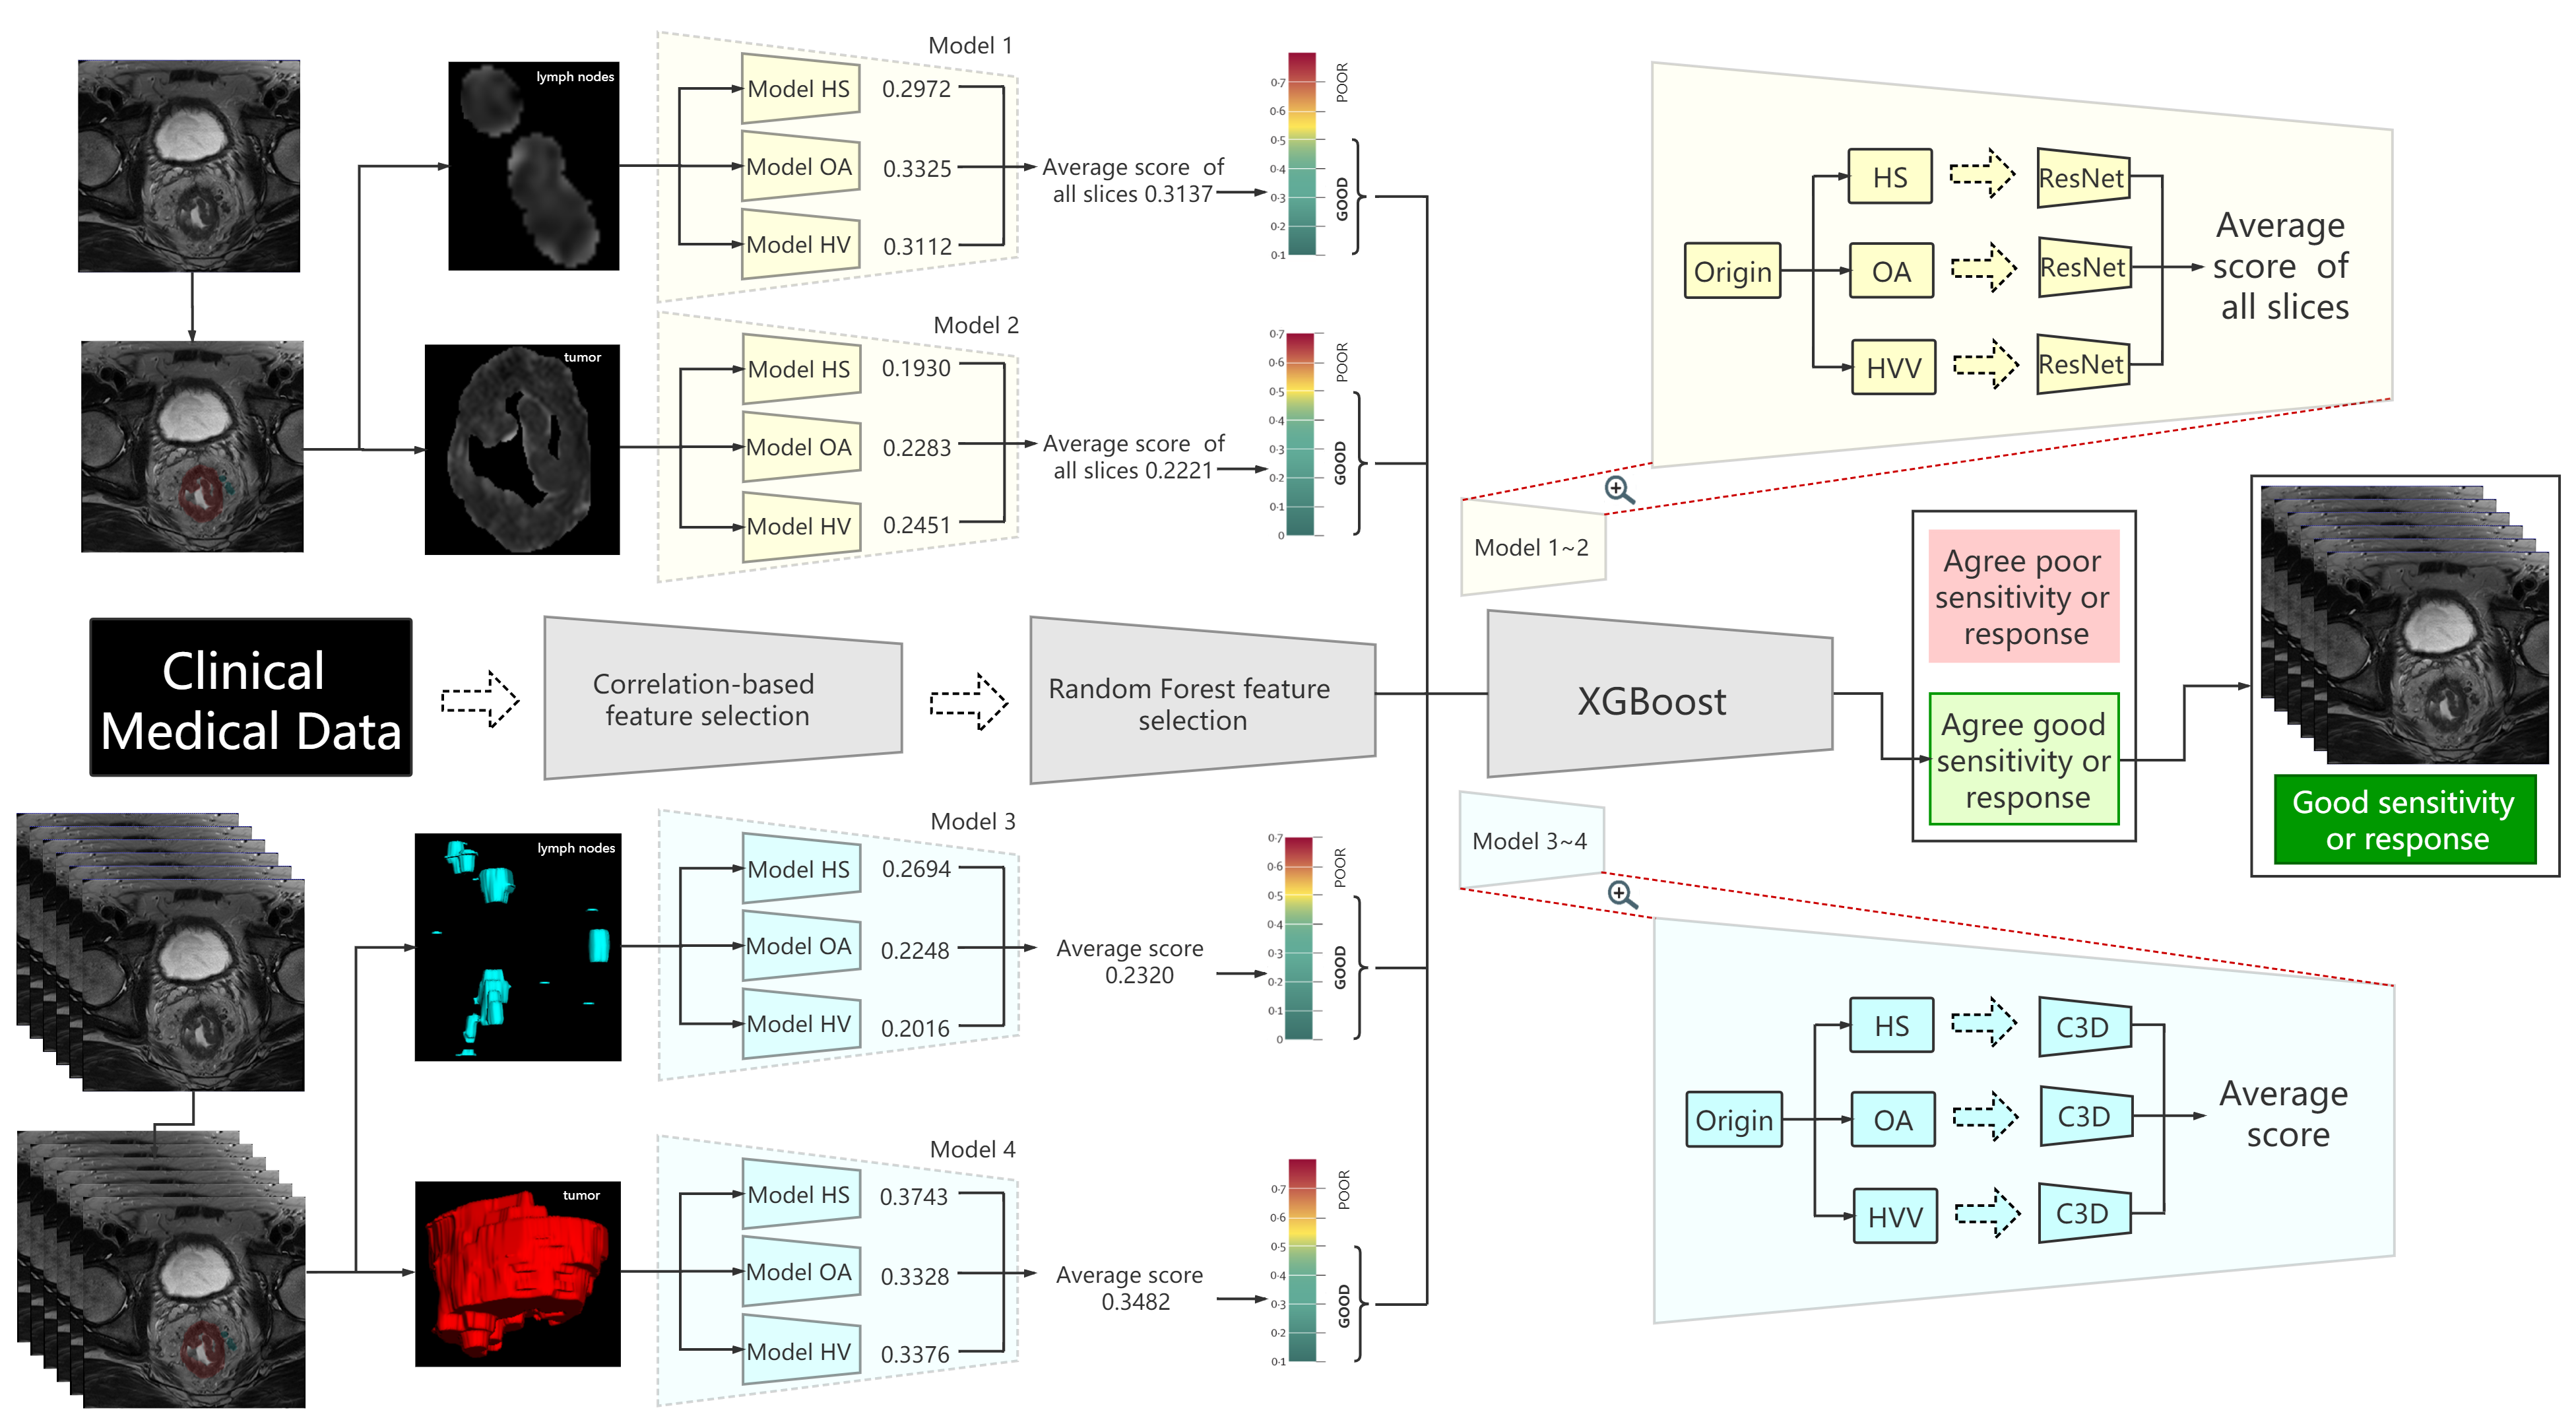
Figure 3 Flow chart and structure of deep learning-clinical model (DLC).
ROIs are processed as heterogeneity in shapes (HS), heterogeneity in voxel values (HVV) and overall appearance (OA), which represents the characteristics of ROI, shape of ROI, ROI + perROI (5-pixel-circum surrounding ROI) respectively. Six ROIs are analyzed using six ResNet9 models and C3D8 models respectively. Average of scores are ensemble score, two for ResNet9 and another two for C3D8. Outputs of the four deep learning models are combined with clinical features to predict the final result using XGBoost11.