2331
The combination of T2 mapping and diffusion kurtosis imaging (DKI) enhances the diagnosis of rectal cancer with and without vascular invasion1Radiology, The First Affiliated Hospital of Dalian Medical University, Dalian, China, 2Philips Healthcare, Beijing, China
Synopsis
Rectal cancer with and without vascular invasion differ greatly in terms of biological behavior, treatment, and prognosis. The T2 mapping and DKI allows non-invasive evaluation of tissue composition. In this study, we investigate the performance of the combination of T2 mapping and DKI on differentiating rectal cancer with and without vascular invasion. The results indicate a better differential diagnosis is achieved by the joint use of T2 mapping and DKI.
Introduction
Rectal cancer is one of the most common cancer and the leading causes of cancer-related death1. And predicting rectal cancer with and without vascular invasion is of great significance for the treatment and prognosis of rectal cancer. Therefore non-invasive evaluation techniques like imaging examination that evaluates the composition and properties of the lesions are needed. T2 mapping and DKI allow non-invasive evaluation of tissue composition and status2-3. The purpose of this study was to explore the value of T2 mapping combined with DKI in the differential diagnosis of rectal cancer with and without vascular invasion.Materials and Methods
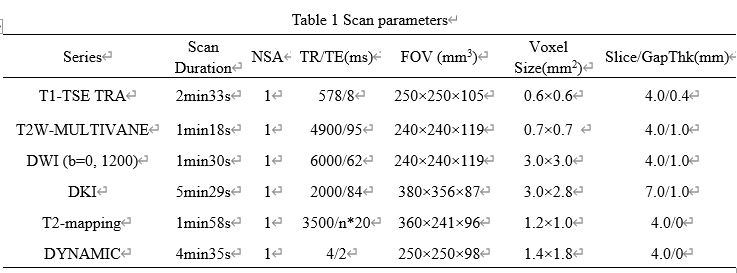
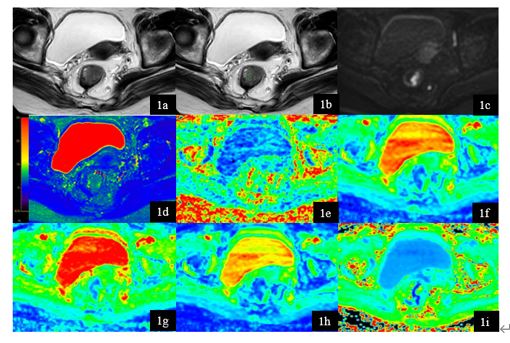
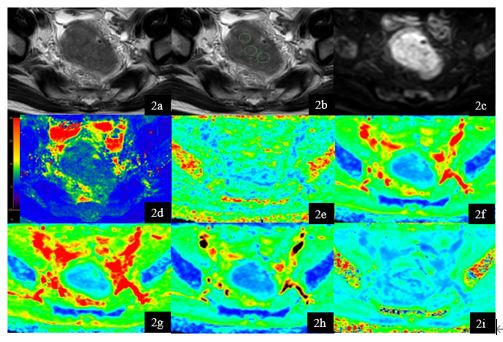
This study has been approved by the local IRB. 21 patients with rectal cancer lesions were retrospectively analyzed. According to the presence of vascular invasion, all patients were divided into two groups: 10 patients with vascular invasion (group A, 6 males, 4 females, age 64.1±13.72 years) and 11 patients without vascular invasion (group B, 8 males, 3 female, age 64±8.98 years). T2 mapping, DKI, and conventional MRI sequences included T1W, T2W, DWI, and DCE were performed on a 3.0T MR scanner with a 16-channel abdominal coil (Ingenia CX, Philips Healthcare, the Netherlands) (detail parameters listed in Table 1). Two experienced radiologists executed the measurements independently. Raw data of T2 mapping was transfered to a workstation (Intellispace Portal 9, Philips Healthcare) for post-processing. The DKI parameter maps were generated using Functool software on a GE AW 4.6 workstation. Three circular ROIs were manually placed on the slice with the largest area of the lesion by using the high-resolution T2W image as a reference. The Inter-class correlation coefficient (ICC) was used to test the measurement consistency between the two observers. The mean values of the T2 and DKI parameters were used for comparison between groups A and B using the Mann-Whitney U test. ROC curves of the above parameters were plotted to analyze the diagnostic efficacy in rectal cancer with and without vascular invasion. Logistic regression was employed to calculate the diagnostic efficacy of the combination of T2 mapping and DKI. The difference between AUCs was compared by using the Delong test. A p-value < 0.05 was considered statistically significant.Result
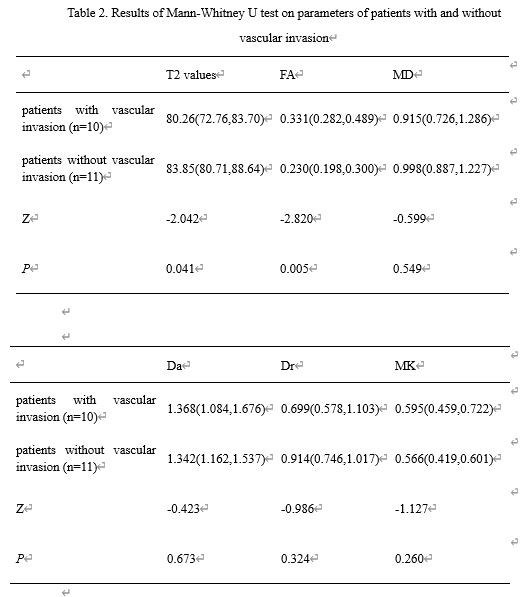
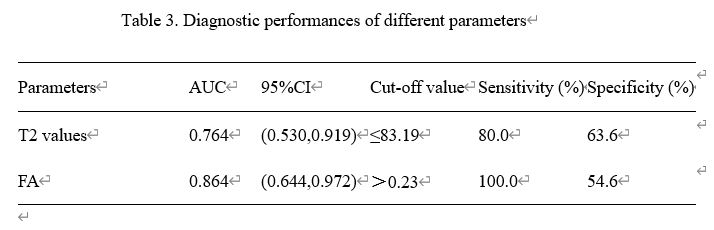
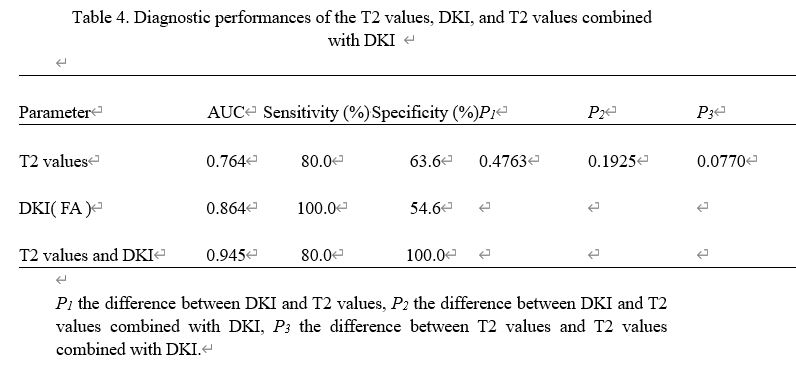
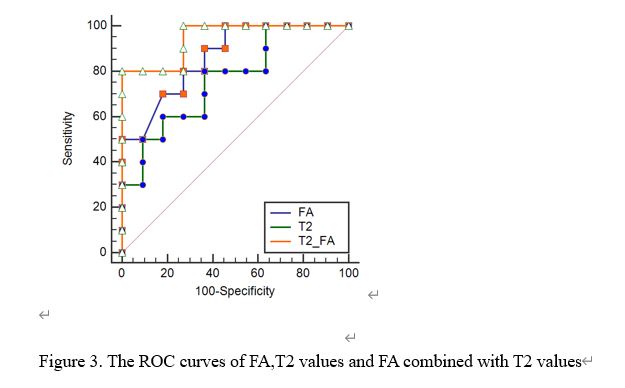
T2 values and DKI parameters (FA, MD, Da, Dr, and MK) measured by the two observers were consistent well (ICC > 0.75). The median (25th Percentile, 75th Percentile) of T2 values and FA values for group A were 80.26(72.76,83.70) ms, 0.331(0.282,0.489) and for group B were 83.85(80.71,88.64) ms, 0.230(0.198,0.300), respectively. T2 values and FA values showed a significant difference between the two groups (p < 0.05), and the other DKI parameters showed no significant differences (p>0.05). The Area under curve (AUC) of T2 values and FA values were 0.764 and 0.864 and the corresponding sensitivity and specificity of T2 values and FA values were 80.0%, 63.6%, and 100.0%, 54.6%. With the combination of T2 values and FA values for rectal cancer with and without vascular invasion, the diagnostic efficacy increased (AUC=0.945), and the sensitivity (80.0%) and the specificity (100.0%).Discussion
T2 mapping imaging combined with DKI can effectively reflect lesion changes between rectal cancers with and without vascular invasion. T2 values were significantly lower in the group with vascular invasion than the group without vascular invasion. It may be due to the high degree of proliferation of rectal cancer with vascular invasion, which causes elevated cell density and thus restrict the water molecular motion. FA values were significantly higher in the group with vascular invasion than the group without vascular invasion, which indicates the higher structural heterogeneity of rectal cancer with vascular invasion.Conclusion
In conclusion, the combination of T2 mapping and DKI can enhance the differential diagnosis of rectal cancer with and without vascular invasion.Acknowledgements
-References
[1] 1. Siegel RL, Miller KD, Sauer AG, et al. Colorectal cancerstatistics, 2020. CA Cancer J Clin. 2020; 0:1-20.
[2] Adams Lisa C, Bressem Keno K, Jurmeister Phillipp, et al. Use of quantitative T2 mapping for the assessment of renal cell carcinomas: first results. Cancer Imaging, 2019, 19: 35.
[3] Cao L, Chen J, Duan T et al. Diffusion kurtosis imaging (DKI) of hepatocellular carcinoma: correlation with microvascular invasion and histologic grade. Quant Imaging Med Surg, 2019, 9:590-602.
Figures