2330
Feasibility of quantitative T2 mapping imaging in the diagnosis and chemotherapy response tracking of rectal cancer1The First Affiliated Hospital of Dalian Medical University, Dalian, China, 2Philips Healthcare, Beijing, China
Synopsis
Clinical diagnosis and real-time evaluation of chemotherapy response for rectal cancer remain challenging due to the lack of effective non-invasive examinational means. The quantitative T2 mapping technique is an effective method for MRI relaxometry in tissues. In this study, we demonstrated that T2 values were significantly higher in rectal cancer than those in the healthy rectal wall, and significantly increased after chemotherapy. Therefore, quantitative T2 mapping might be a promising non-invasive method in the diagnosis and chemotherapy response tracking of rectal cancer.
Summary of Main Findings
In this study, we found T2 values were significantly higher in rectal cancer than those in the healthy rectal wall and significantly increased after chemotherapy. As a non-invasive method, Quantitative T2 mapping has potentials in the diagnosis and chemotherapy response tracking of rectal cancer.Introduction
Rectal cancer is the third most common cancer and the second major cause of death throughout the world among all cancers[1]. However, clinical diagnosis and real-time evaluation of chemotherapy response for rectal cancer remain challenging due to the lack of effective non-invasive examinational means. The quantitative T2 mapping technique is sensitive to the status of tissues, which determine the relaxation properties of water proton. Previous studies have shown that T2 mapping is capable of detecting renal cell carcinomas and prostate cancer[2-3]. In this study, We investigated the feasibility of T2 mapping in the diagnosis and chemotherapy response tracking of rectal cancer.Methods
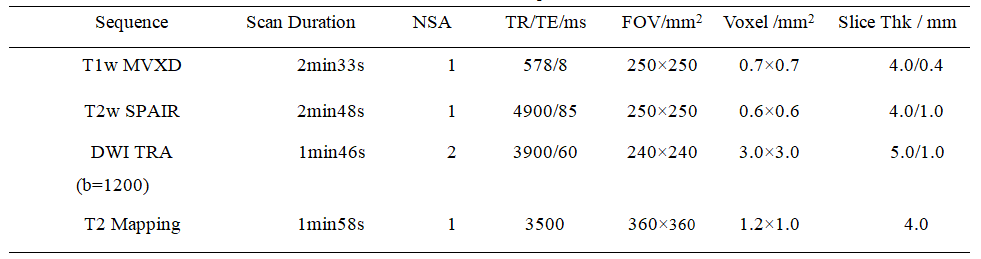
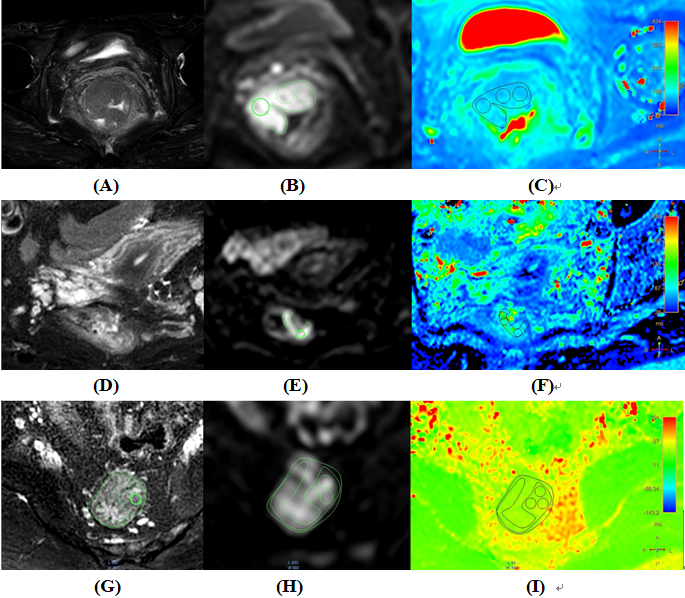
This retrospective study was approved by the local IRB. A total of 58 subjects with informed consent underwent 3T MRI examinations (Ingenia CX; Philips Healthcare, the Netherlands with a 16-channel abdominal coil) from January 2019 to November 2020. We investigated 34 rectal cancer patients confirmed by pathology in our hospital (14 males, 20 females,63.09±11.57 years), 10 patients receiving chemotherapy (7 males, 3 females, 57.00±15.07 years) and 14 healthy volunteers with a healthy rectal wall (6 males, 8 females, 30.57±9.89 years). T1w MVXD, T2w SPAIR, DWI TRA (b=1200), and T2 Mapping were performed with the scan parameters listed in Table 1. Two experienced radiologists (radiologist 1, more than 10 years of experience with rectal cancer MRI; radiologist 1, 2 years of experience with rectal cancer MRI) performed the measurement independently. Based on the high-resolution anatomical information and lesion information on DWI, three different ROIs were drawn on the axial slice to display the largest area of the malignant lesion for the patients before and after chemotherapy (Figure 3 A-F). For the healthy volunteers, three different ROIs from the rectal wall were selected on an axial slice with good image quality (Figure 3 G-I). The T2 values were calculated by taking the mean of values from the selected ROI. Since the number of cases was relatively small, the Mann-Whitney U test was used to calculate and analyze the differences in healthy, rectal cancer, and chemotherapy groups on SPSS (IBM). Finally, ROC analysis was performed to evaluate the value of T2 mapping in the diagnosis and chemotherapy response tracking of rectal cancer. For all tests, values of p <0.05 were statistically significant.Results
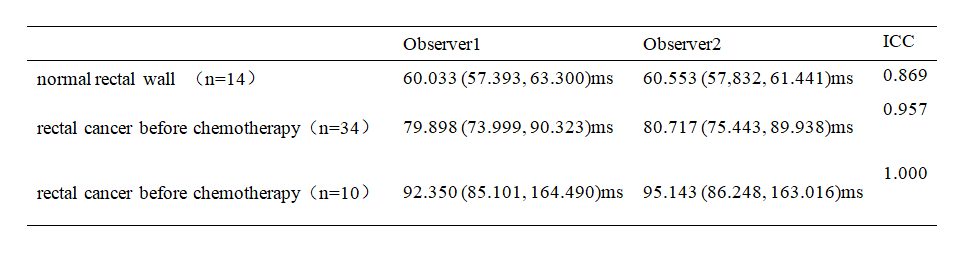
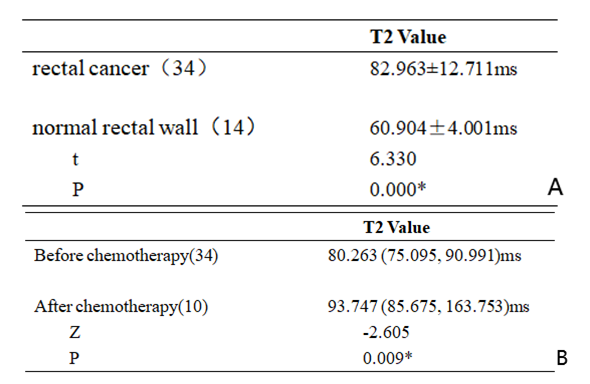
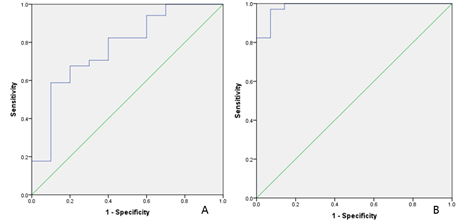
Measurement consistency between the two observers from three kinds of cases was good (ICC > 0.75) (Table 2). T2 values of the rectal cancer group (82.963±12.711 ms) were statistically higher than those of the healthy group (60.904±4.001 ms, p<0.05, Table 3-A). T2 values of the rectal cancer group after chemotherapy decreased significantly (before chemotherapy, 80.263 (75.095, 90.991)ms, after chemotherapy, 93.747 (85.675, 163.753)ms, p<0.05, Table 3-B). The AUC of T2 mapping values to distinguish rectal cancer before and after chemotherapy was 0.774 with sensitivity of 0.588 and specificity of 0.900 and the feasible threshold was 81.738(Figure 2-A). The AUC of T2 mapping values to distinguish normal rectal wall and rectal cancer was 1 with sensitivity of 0.971 and specificity of 0.929 and the feasible threshold was 66.183(Figure 2-B).Discussion
T2 values in rectal cancer were significantly higher than that in the healthy rectal wall and increased significantly after chemotherapy. Edema and inflammation will appear after chemotherapy in rectal cancer, which may explain the higher values of T2 in lesions. There are two limitations in our study. First, the relatively small group of subjects might induce statistical bias. Second, the time between chemotherapy and MRI examination is not equal and certain cases in this study might have passed the edema phase and generated a proliferation of fibrous tissue that decrease T2 values. Further precise studies with larger samples should be conducted.Conclusion
In conclusion, quantitative T2 mapping is sensitive to the occurrence and treatment response of rectal cancer, which makes it a promising non-invasive method for clinical applications.Acknowledgements
NoneReferences
[1] Siegel Rebecca L, Miller Kimberly D, Fedewa Stacey A et al. Colorectal cancer statistics, 2017[J]. CA Cancer J Clin, 2017, 67: 177-193.
[2] Adams Lisa C, Bressem Keno K, Jurmeister Phillipp et al. Use of quantitative T2 mapping for the assessment of renal cell carcinomas: first results[J]. Cancer Imaging, 2019, 19: 35.
[3] Sabouri Shirin, Chang Silvia D, Safdie Richard et al. Luminal Water Imaging: A New MR Imaging T2 Mapping Technique for Prostate Cancer Diagnosis[J]. Radiology, 2017, 284: 451-459.
Figures