2328
The value of quantitative T2-mapping in distinguishing rectal tubular adenocarcinoma from non-tubular adenocarcinoma1The First Affiliated Hospital of Dalian Medical University, Dalian, China, Dalian, China, 2Philips Healthcare,Beijing,China, Beijing, China
Synopsis
This study aims to evaluate the value of quantitative T2-mapping in distinguish rectal tubular adenocarcinoma from non-tubular adenocarcinoma, which can provide rich information and help clinical decision-making. The results showed that the quantitative value of T2mapping of rectal tubular adenocarcinoma was significantly different from that of rectal non-tubular adenocarcinoma. Therefore, quantitative T2 mapping can be used as a non-invasive method for diagnosis rectal tubular adenocarcinoma and non-tubular adenocarcinoma.
Synopsis
This study aims to evaluate the value of quantitative T2-mapping in distinguish rectal tubular adenocarcinoma from non-tubular adenocarcinoma, which can provide rich information and help clinical decision-making. The results showed that the quantitative value of T2mapping of rectal tubular adenocarcinoma was significantly different from that of rectal non-tubular adenocarcinoma. Therefore, quantitative T2 mapping can be used as a non-invasive method for diagnosis rectal tubular adenocarcinoma and non-tubular adenocarcinoma.(AUC:0.824; sensitivity 88.2%;specificity:75%)Introduction
As the third most common and fatal malignant tumors in the world, rectal tubular adenocarcinoma has been closely concerned[1] . It can be difficult to distinguish rectal tubular adenocarcinoma and non-tubular adenocarcinoma using traditional MR imaging methods due to similar signals.Rectal cancer non-tubular adenocarcinoma is more malignant,research has shown that non-tube adenocarcinoma is an independent risk factor for lymph node metastasis at station 3 in patients with rectal cancer[2]. T2 mapping has been applied in quantitative assessment of various diseases in tissues such as heart, nerve and bone joints[3]. In this study, the possibility of quantitative T2 mapping for differential rectal tubular adenocarcinoma and non-tubular adenocarcinoma was investigated.Materials and Methods
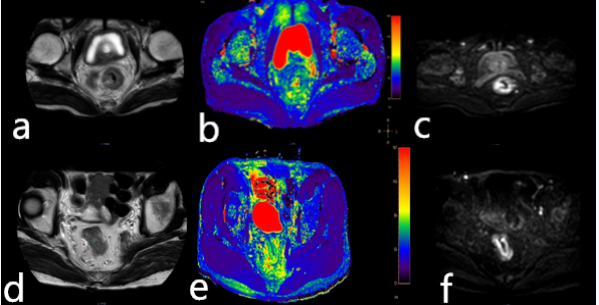
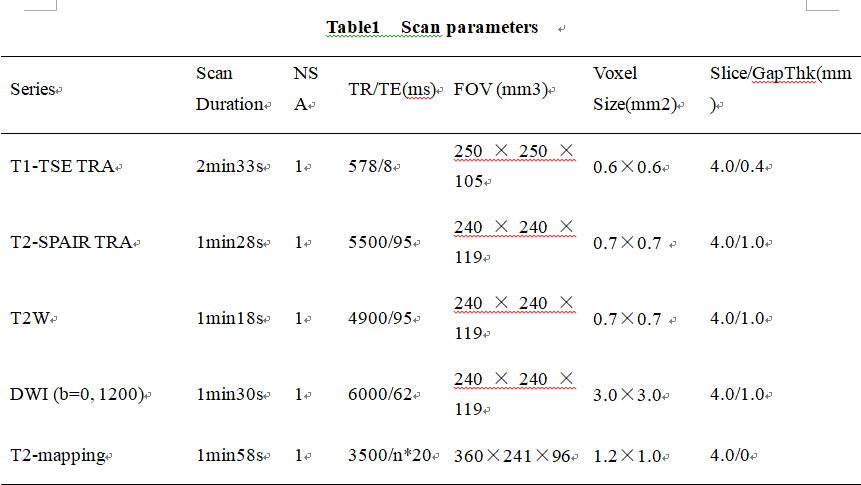
A total of 25 cases with informed consent were scanner for a retrospective study from March 2019 to December 2020. This study was approved by the local IRB. These cases were divided into two groups: rectal tubular adenocarcinoma group (n=17, 12 male , 5 female , mean age: 62.88 ±9.93, range: 33- 77 years) and non-tubular adenocarcinoma group (n=8, 5 male, 3 female , mean age: 62.00±15.86, range: 38- 83 years). All cases were examined using a 3.0T MR scanner (IngeniaCX, Philips Healthcare, Best, the Netherlands), including T1w, T2w, DWI with detailed scan parameters in Table I. Three circular ROIs were manually placed on the T2 mapping image with the largest lesion area according to the anatomical lesion location on the T2-weighted and DWI images. All ROIs were approximately 25-100mm2, which were shown in Figure1. The two groups data were in accordance with the normal distribution, therefore, the independent sample t test was adopted to compare the rectal tubular adenocarcinoma group with the non-tubular adenocarcinoma group via the average T2 values measured in the three ROIs.Results
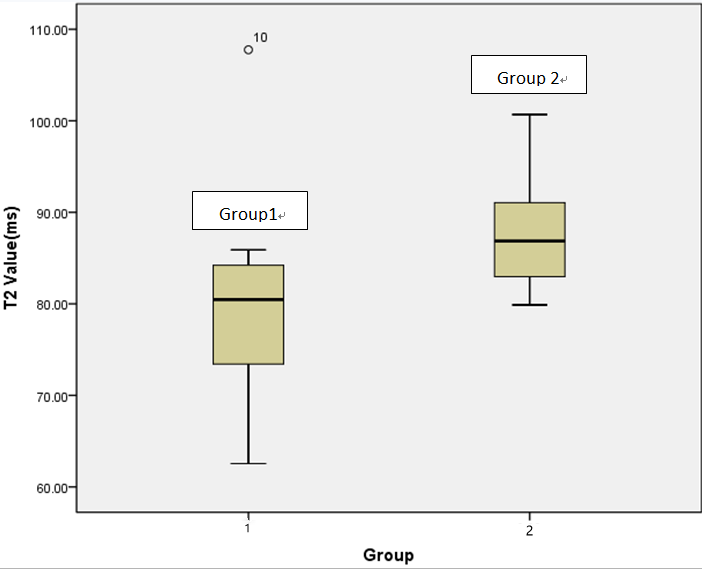
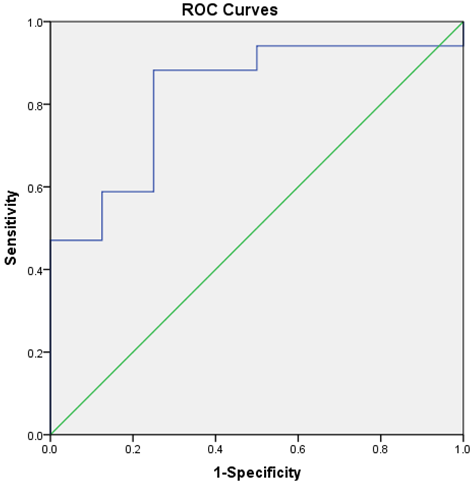
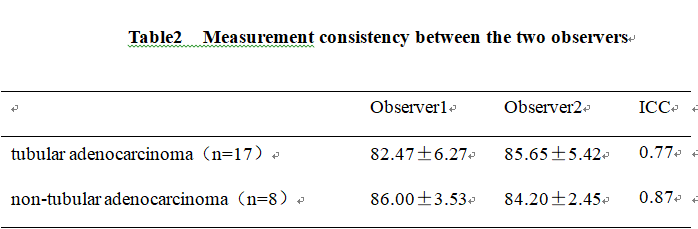
The consistency of measurements by two radiologists was in good agreement (ICC > 0.75).The quantitative value of T2 mapping in the rectal tubular adenoma group was (79.29±10.01)%, and the value in the non-rectal tubular adenoma group was (87.80±6.82)%, which were shown in Table2. The T2 value of non-rectal tubular adenoma group was much higher than that of rectal tubular adenoma group (t=-2.166, P<0.05). The significant difference between these two groups can be seen in Figure2. The area under the ROC curve was 0.824. The sensitivity and specificity of the T2 values corresponding to the feasible thresholds were 88.2% and 75%, respectively, which were shown in Figure3.Discussion and Conclusion
The quantitative value of T2 mapping for rectal tubular adenocarcinoma is significantly different from non-tubular adenocarcinoma. In the non-tubular adenocarcinoma group with higher risk of malignancy, tumor cells have more frequent proliferation activity and would produce more proteins and peptides[4], resulting in a stronger T2 mapping value than tubular adenocarcinoma. Therefore, T2 mapping can be used as a non-invasive technique to distinguish rectal tubular adenocarcinoma from non-tubular adenocarcinoma.Acknowledgements
No acknowledgement found.References
[1]Siegel RL, Miller KD, Fedewa SA, et al. Colorectal cancer statistics, 2017[J]. Ca A Cancer Journal for Clinicians, 2017, 67:104-117.
[2] Luo Yang, Chen Jianjun, Qin Jun, Yu Minhao, Qin Shaolan, Qiu Yier, Zhong Ming. Influence of low ligation of inferior mesenteric artery during laparoscopic radical rectal cancer surgery on lymph node dissection at station 3 and analysis of risk factors for lymph node metastasis at station 3 [J]. Chinese Journal of Digestive Surgery, 2018, 17(02): 154-160.
[3]Adams Lisa C,Bressem Keno K,Jurmeister Phillipp, et al. Use of quantitative T2 mapping for the assessment of renal cell carcinomas: first results [J] .Cancer Imaging, 2019, 19- 35.
[4]Mariska Damen, Maarten van Leeuwen, Andrew Webb, et al. Measurement of T1and T2relaxation times of the pancreas at 7T usinga multi‐transmit system[J]. Magnetic Resonance Materials in Physics, Biology and Medicine, 2019, 32:703-708.
Figures