2325
Glutamine transporter downregulation mediates metabolic reprogramming in pancreatic tumors1Division of Cancer Imaging Research, The Russell H. Morgan Department of Radiology and Radiological Science, The Johns Hopkins University School of Medicine, Baltimore, MD, United States
Synopsis
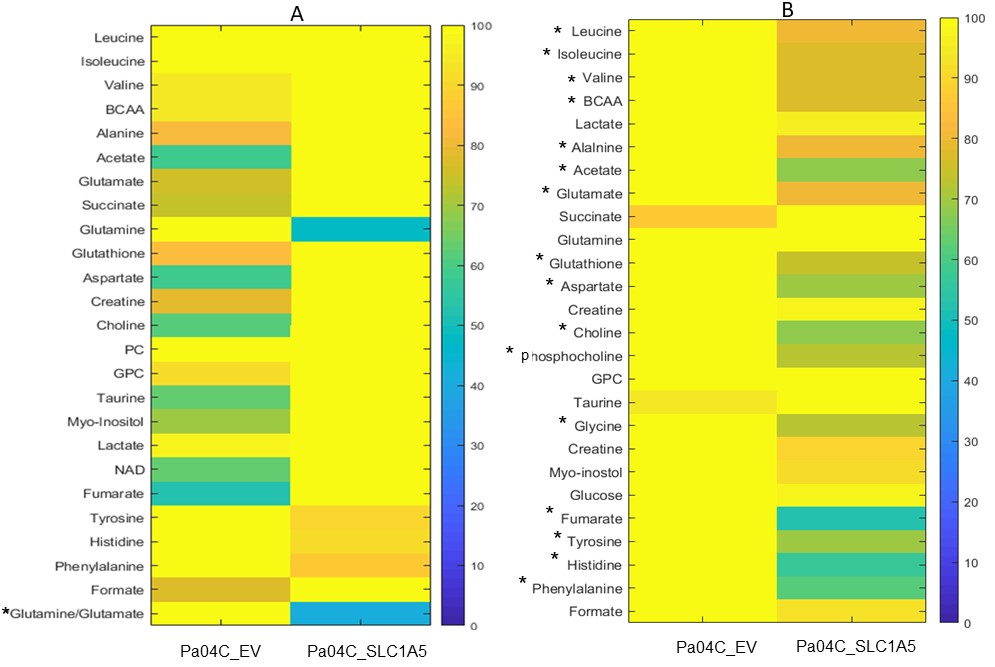
Pancreatic cancer cells are glutamine dependent for growth and proliferation. The glutamine transporter SLC1A5 is upregulated in pancreatic cancer and is being actively investigated as a pharmacological target. We genetically engineered human pancreatic cancer cells to express SLC1A5 shRNA to downregulate SLC1A5. 1H MRS was used to analyze metabolic differences in SLC1A5 downregulated Pa04C_SLC1A5 pancreatic cancer cells and tumors compared to empty vector cells and tumors. SLC1A5 downregulation resulted in a significantly lower glutamine/glutamate ratio in Pa04C_SLC1A5 cells. In Pa04C_SLC1A5 tumors we observed a significant reduction of several metabolites highlighting the metabolic reprogramming that occurred in tumors with SLC1A5 downregulation.
Introduction
Pancreatic ductal adenocarcinoma (PDAC) is an aggressive disease that is the fourth leading cause of cancer related death in the United States1. PDAC exhibit limited response to chemo- and radiotherapy. Identifying novel targets for PDAC treatment is a major need for effective treatment strategies. Because pancreatic cancer cells are ‘glutamine avid’ 2, targeting glutamine metabolic pathways can provide novel options for treatment. The glutamine transporter, SLC1A5, is being actively investigated as a pharmacological target in cancer 3. Here we have engineered human pancreatic cells expressing shRNA to downregulate the glutamine transporter SLC1A5. We performed high-resolution 1H magnetic resonance spectroscopy (MRS) to understand the metabolic reprogramming that occurs with SLC1A5 downregulation.Method
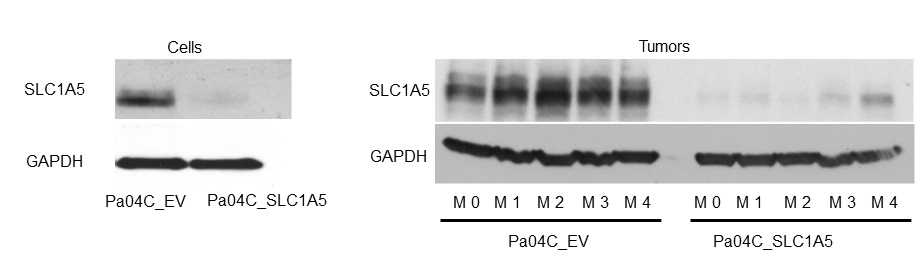
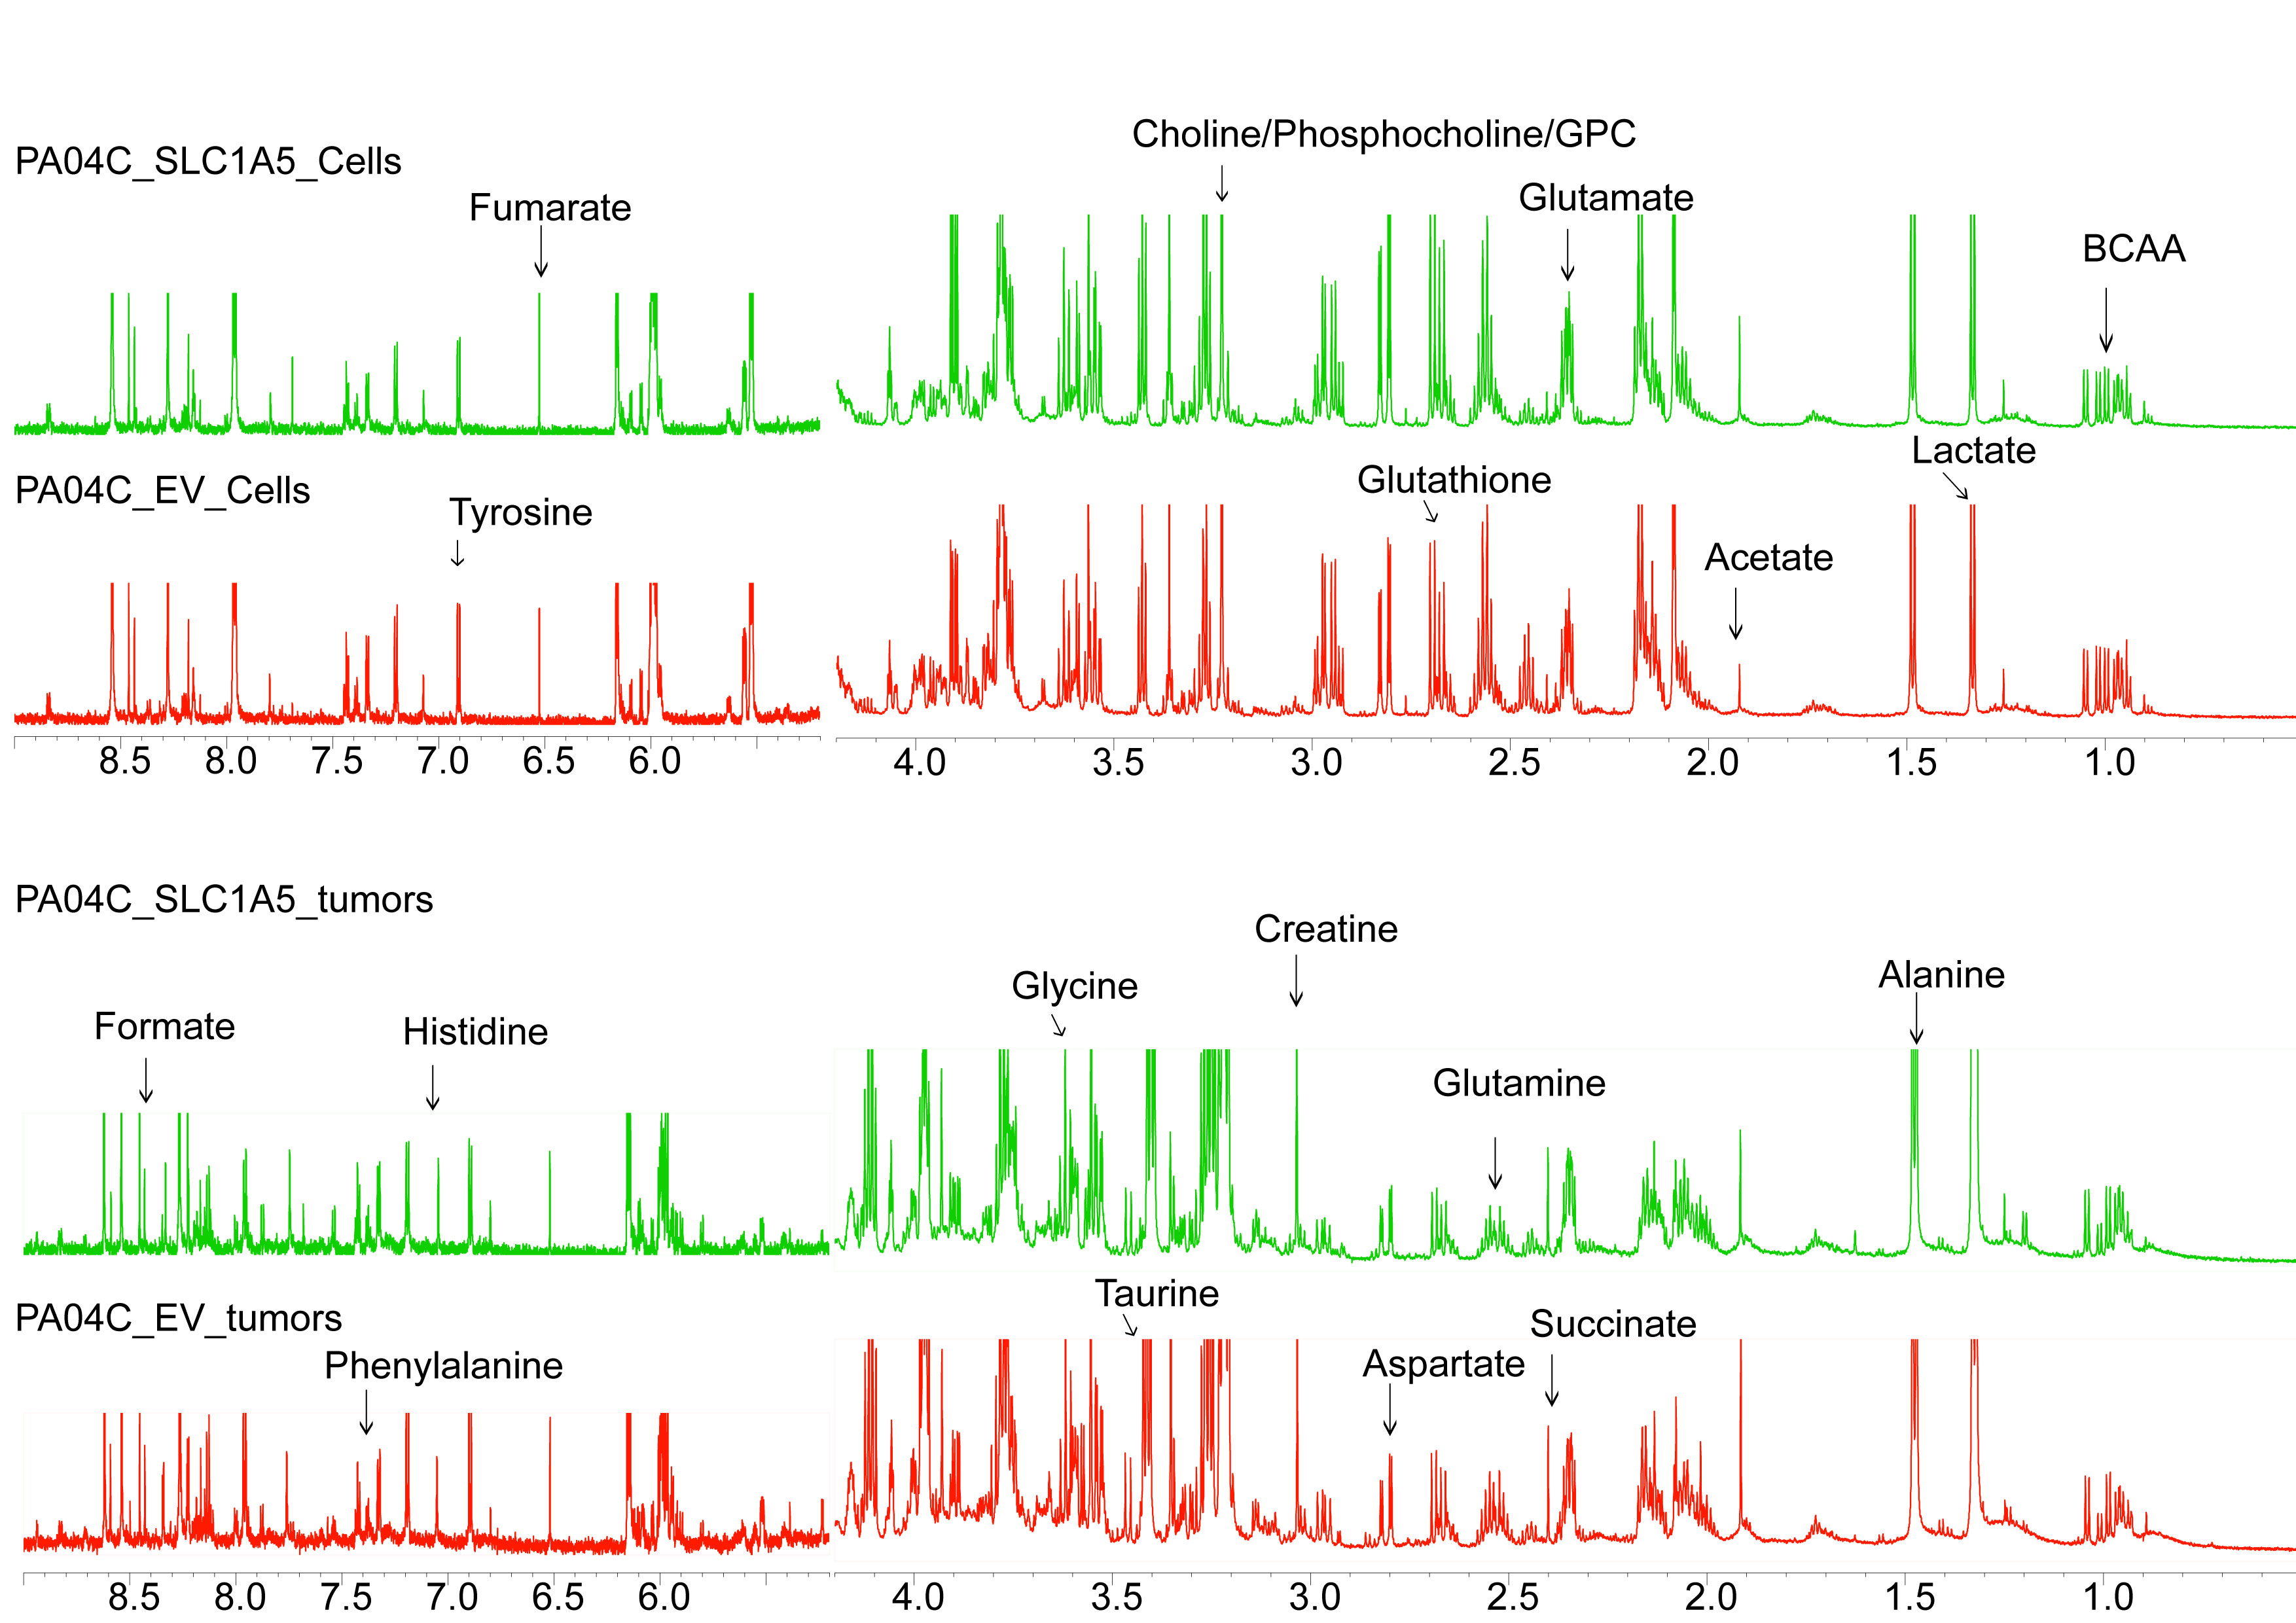
Patient derived pancreatic cancer cells (Pa04C) were genetically engineered to express shRNA against SLC1A5 (Pa04C-SLC1A5) using lentiviral transduction. Downregulation of SLC1A5 was verified with q-RT-PCR and immunoblotting. Pa04C cells genetically engineered to express an empty vector (Pa04C_EV) using lentiviral transduction were used as controls. Tumors were derived by injecting 2x10⁶ EV or Pa04C_SLC1A5 cells in the flank of 4 to 6-week-old male SCID mice. Tumor growth was monitored, and tumors excised and snap frozen at the end of the experiment. Dual phase extraction was performed on cells (EV n= 4, Pa04C_SLC1A5 n= 4) and tumors (EV n= 7, Pa04C_SLC1A5 n= 9), as previously described4. High-resolution 1H MR spectra were obtained from the aqueous phase extracts on a 750 MHz spectrometer. All data acquisition, processing and quantification was performed with TOPSPIN 3.5 software.Result and Discussion
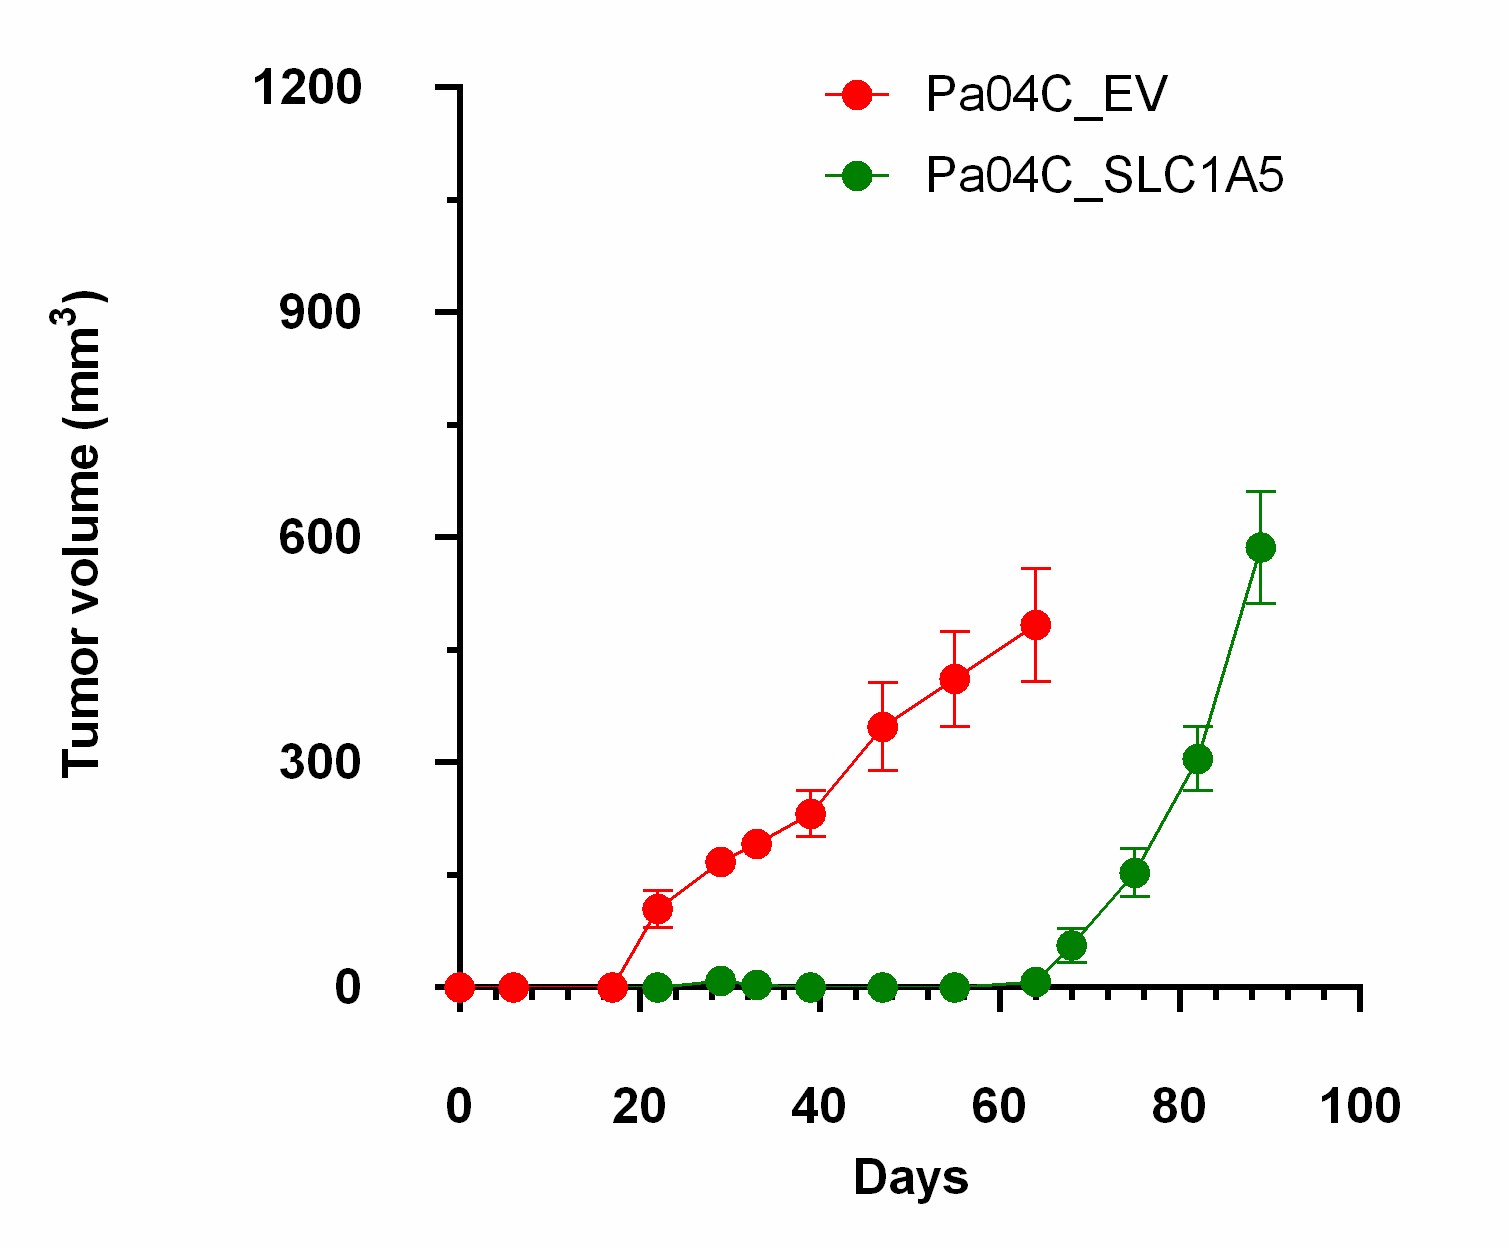
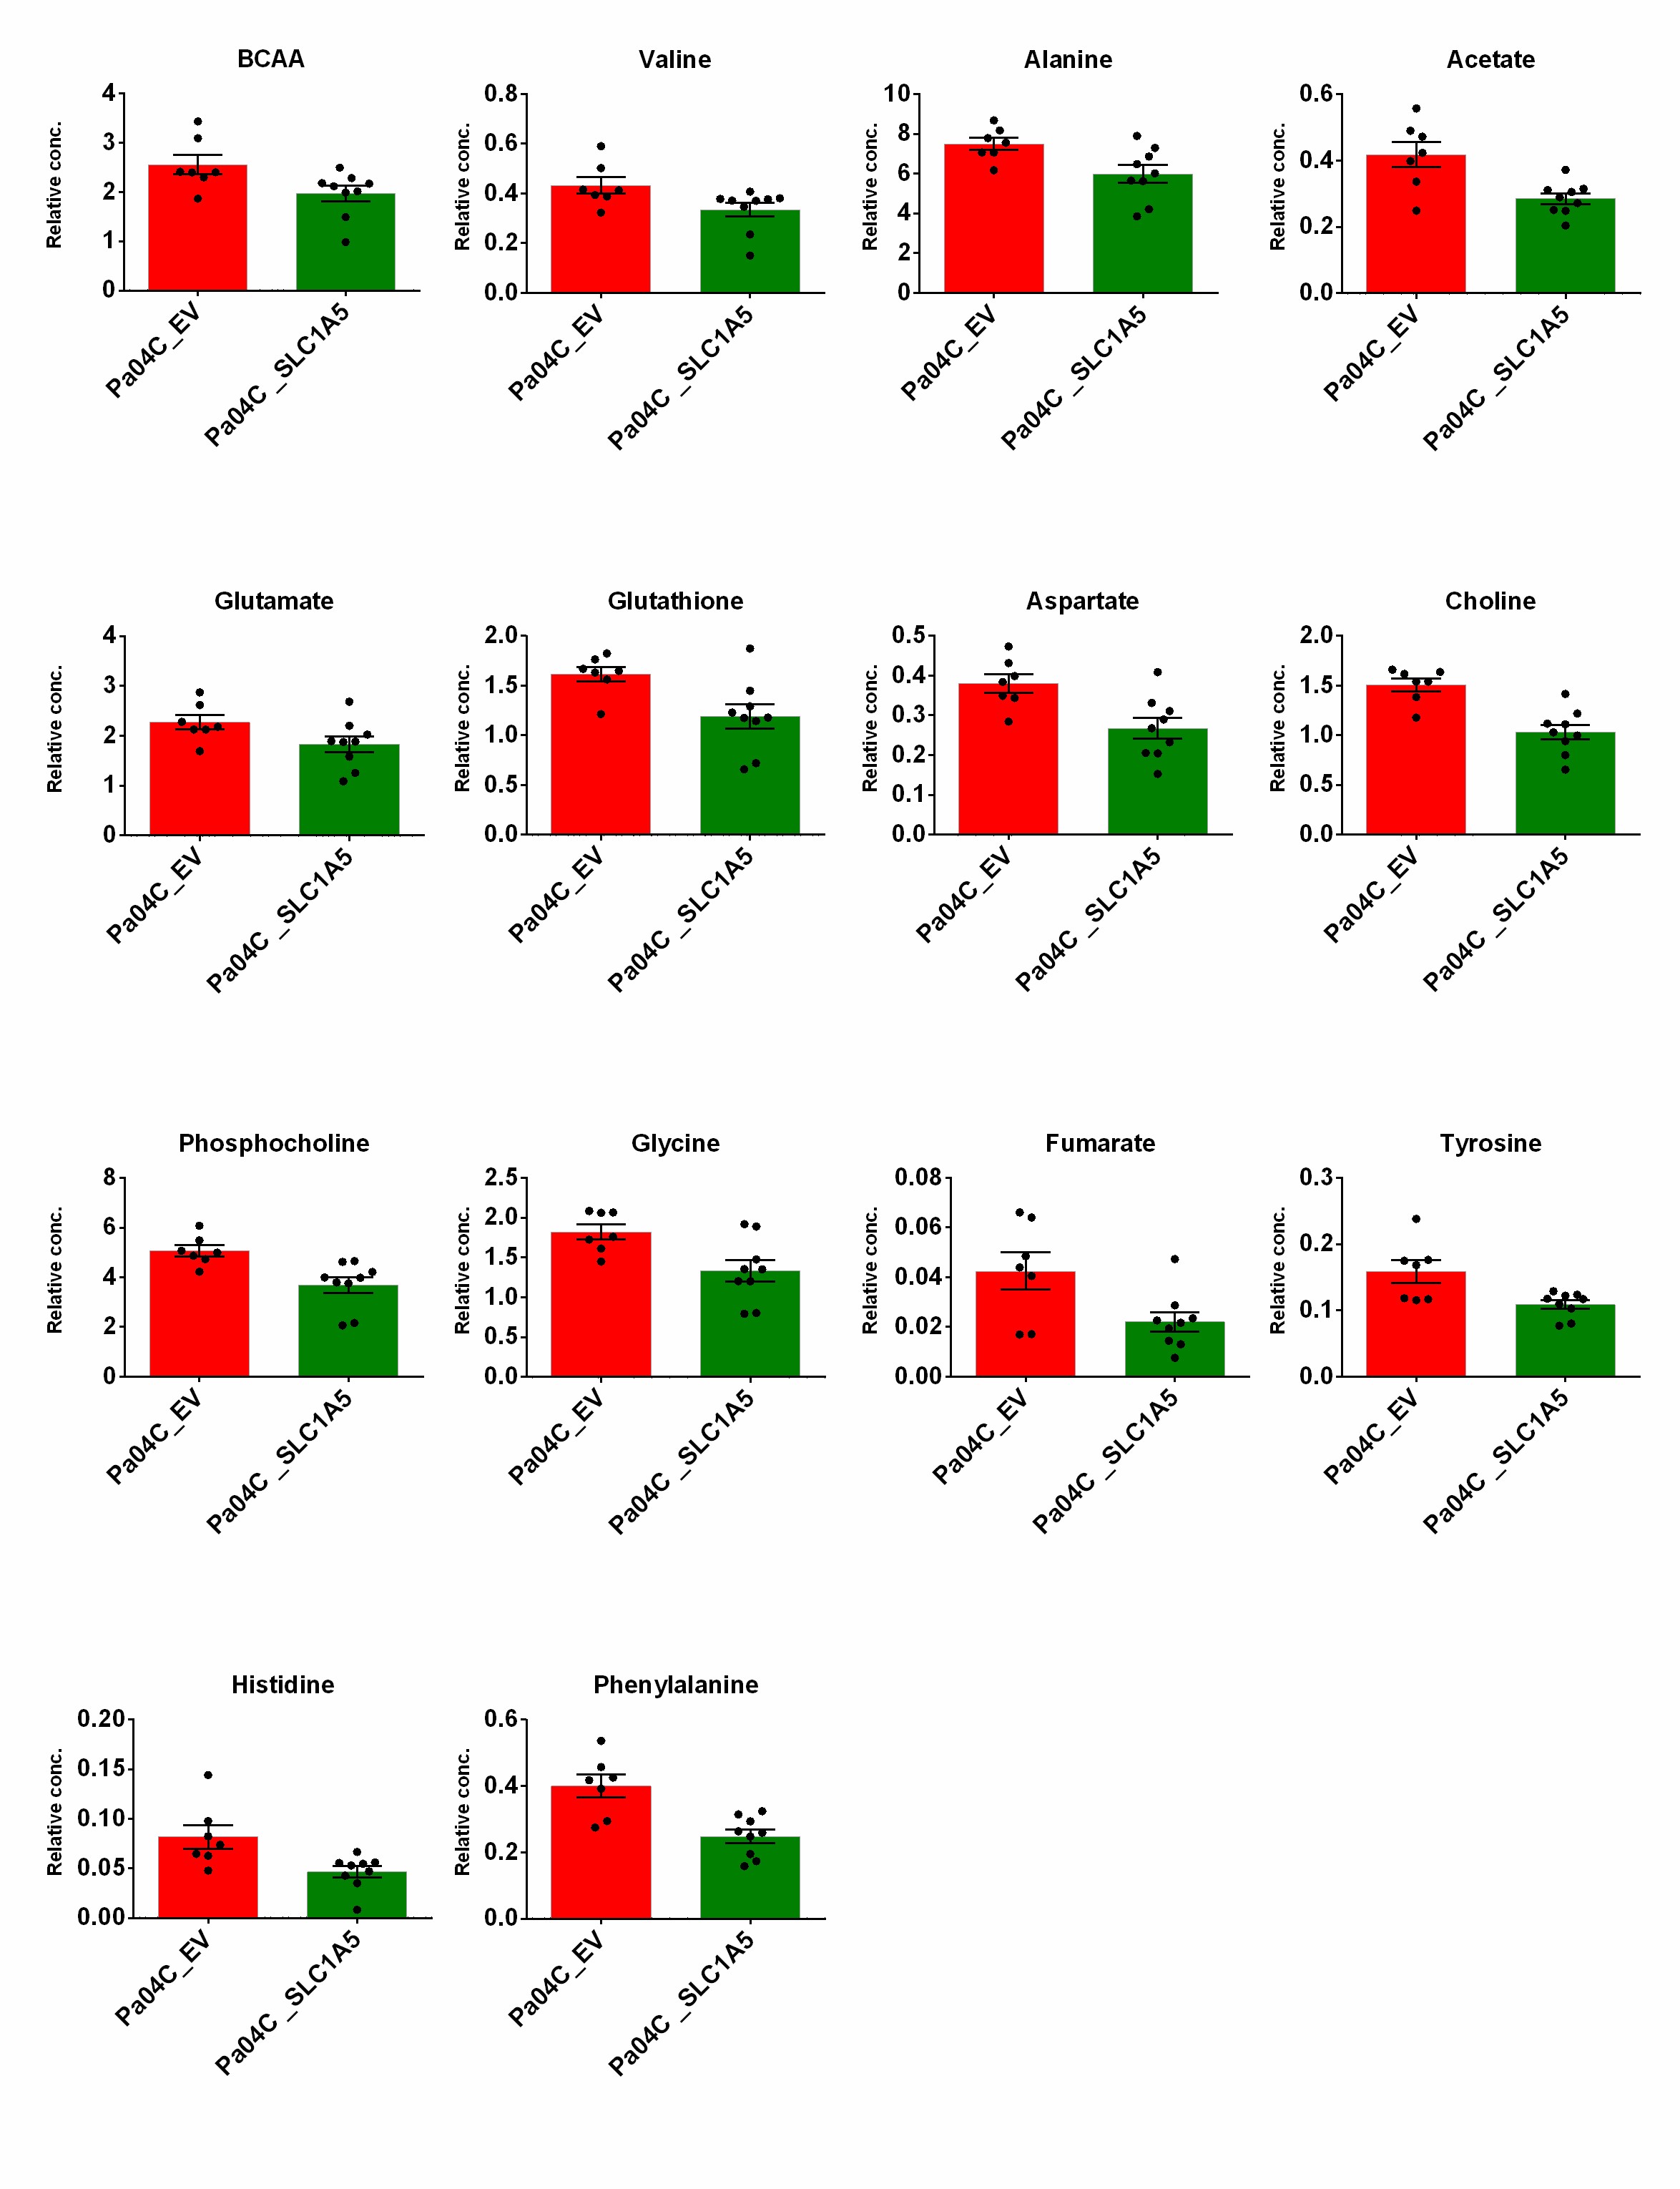
We verified significant downregulation of SLC1A5 in Pa04C_SLC1A5 cells and tumors compared to EV cells and tumors (Figure 1). Downregulation of SLC1A5 also resulted in a significantly growth delay of Pa04C_SLC1A5 tumors compared to EV tumors (Figure 2). Representative 1H MR spectra from EV and Pa04C cells and tumors are presented in Figure 3. Metabolic heat maps generated from quantitative 1H MRS, of cell and tumor aqueous extracts (Figure 4), identified significant downregulation of the glutamine/glutamate ratio in cells with SLC1A5 downregulated. Other than the significant decrease of glutamine/glutamate in the Pa04C_SLC1A5 cells, no other significant metabolic differences were detected in these cells. In tumors, however, SLC1A5 downregulation resulted in a significant decrease of branched chain amino acids (BCAA), valine, alanine, glutamate, acetate, aspartate, glutathione, choline, phosphocholine, glycine, fumarate, tyrosine, phenylalanine and histidine. These changes are summarized in the bar graphs in Figure 5. SLC1A5 downregulation clearly resulted in significant tumor growth delay, supporting its importance as a therapeutic target. Our data expand the understanding of the diverse metabolic reprogramming that occurs following SLC1A5 downregulation in tumors in vivo that may lead to the development of additional metabolic targets. These data also identify the role of the tumor microenvironment in the metabolic reprogramming identified in tumors.Acknowledgements
Supported by NIH R01CA193365 and R35CA209960.References
1. Coothankandaswamy, V.; Cao, S.; Xu, Y.; Prasad, P. D.; Singh, P. K.; Reynolds, C. P.; Yang, S.; Ogura, J.; Ganapathy, V.; Bhutia, Y. D., Amino acid transporter SLC6A14 is a novel and effective drug target for pancreatic cancer. Br J Pharmacol 2016, 173 (23), 3292-3306.
2. Son, J.; Lyssiotis, C. A.; Ying, H.; Wang, X.; Hua, S.; Ligorio, M.; Perera, R. M.; Ferrone, C. R.; Mullarky, E.; Shyh-Chang, N.; Kang, Y.; Fleming, J. B.; Bardeesy, N.; Asara, J. M.; Haigis, M. C.; DePinho, R. A.; Cantley, L. C.; Kimmelman, A. C., Glutamine supports pancreatic cancer growth through a KRAS-regulated metabolic pathway. Nature 2013, 496 (7443), 101-5.
3. Bhutia, Y. D.; Ganapathy, V., Glutamine transporters in mammalian cells and their functions in physiology and cancer. Biochim Biophys Acta 2016, 1863 (10), 2531-9.
4. Winnard, P. T., Jr.; Bharti, S. K.; Sharma, R. K.; Krishnamachary, B.; Mironchik, Y.; Penet, M. F.; Goggins, M. G.; Maitra, A.; Kamel, I.; Horton, K. M.; Jacobs, M. A.; Bhujwalla, Z. M., Brain metabolites in cholinergic and glutamatergic pathways are altered by pancreatic cancer cachexia. Journal of cachexia, sarcopenia and muscle 2020.
Figures