2324
Comparison of MR values at 3T and 14T in a mouse model of pancreatic ductal adenocarcinoma.1Radiology, University of Washington, Seattle, WA, United States, 2Applied Physics Laboratory, University of Washington, Seattle, WA, United States, 3Gastroenterology, University of Washington, Seattle, WA, United States
Synopsis
Pancreatic cancer is expected to become the second leading cause of the cancer related deaths in the USA by 2020. The goal of all pre-clinical magnetic resonance imaging (MRI) studies is to translate the pre-clinical MR values to the clinical scanners and ultimately to human population. MRI has been proven to be extremely useful in clinical trials for monitoring tumor development and assessing therapeutic effects of novel therapeutic strategies. The aim of this study was to measure (T2) relaxation time and magnetization ratio (MTR) in a mouse model of pancreatic ductal adenocarcinoma (PDA) at pre-clinical (14T) and clinical (3T) scanner.
Introduction
Pancreatic cancer is expected to become the second leading cause of cancer-related deaths in the USA by 2020 [1]. The most common and deadly form of pancreatic cancer is pancreatic ductal adenocarcinoma (PDA). The 5-year overall survival rate is less than 8%, with average life expectancy after the diagnosis with the metastatic disease being 3-6 months. Multi-parametric magnetic resonance imaging (mp-MRI) has yielded good results in pancreatic cancer detection, location in monitoring therapeutic effects [2, 3]. The goal of this study is to compare MRI T2 and MTR values in PDA mouse model between 14T and 3T scanners.Materials and Methods
All experimental procedures were approved by the Institutional Animal Care and Use Committee of the University of Washington. A genetic murine model, KrasLSL-G12D/+, Trp53LSL-R172H/+, Cre (KPC; n=12) of PDA were employed for this study. Mice were imaged both at 3T; Ingenia 3T, Philips and 14T; Bruker Avance 600 MHz/89 mm wide-bore vertical MR spectrometer (Bruker Corp., Billerica, MA). At 3T, quantitative T2 maps were generated using a multi-slice multi echo sequence using the following parameters (TR/TE = 3000/ 20 to 170 ms, with 10 ms spacing). In order to cover the entire abdominal region, 18 contiguous slices were acquired without any interslice gap. Magnetization transfer (MT) images were acquired using following parameters (TR/TE = 73/3.9 ms; flip angle =18o, FOV = 100 x 59x 26 mm3). A series of 33 images were acquired covering the whole abdominal area. At 14T MRI, the quantitative T2 maps were generated using a multi-slice multi echo sequence, with fat signal suppressed, utilizing following parameters: TR = 4000 ms; TE = 12 with 6 ms spacing; number of average (NA) = 1. In order to cover the entire abdominal region, 10 contiguous slices were acquired without any interslice gap. Magnetization transfer (MT): MT images were acquired using a gradient echo sequence (TR/TE = 625/2 ms, flip angle =30o, FOV = 30 x 30mm2) with an off-resonance frequency of 7000 Hz and a saturation pulse block pulse shape, 50 ms width, and 10 µT amplitude. A series of 10 images were acquired covering the tumor. 3T and 14T data were transferred from the scanners were analyzed using Horos (v 3.3.6, https://horosproject.org/) and Image J (version 1.52, http://imagej.nih.gov/ij/)software respectively. Briefly, regions of interest (ROI) were drawn to delineate the entire tumor including the cystic areas.Results
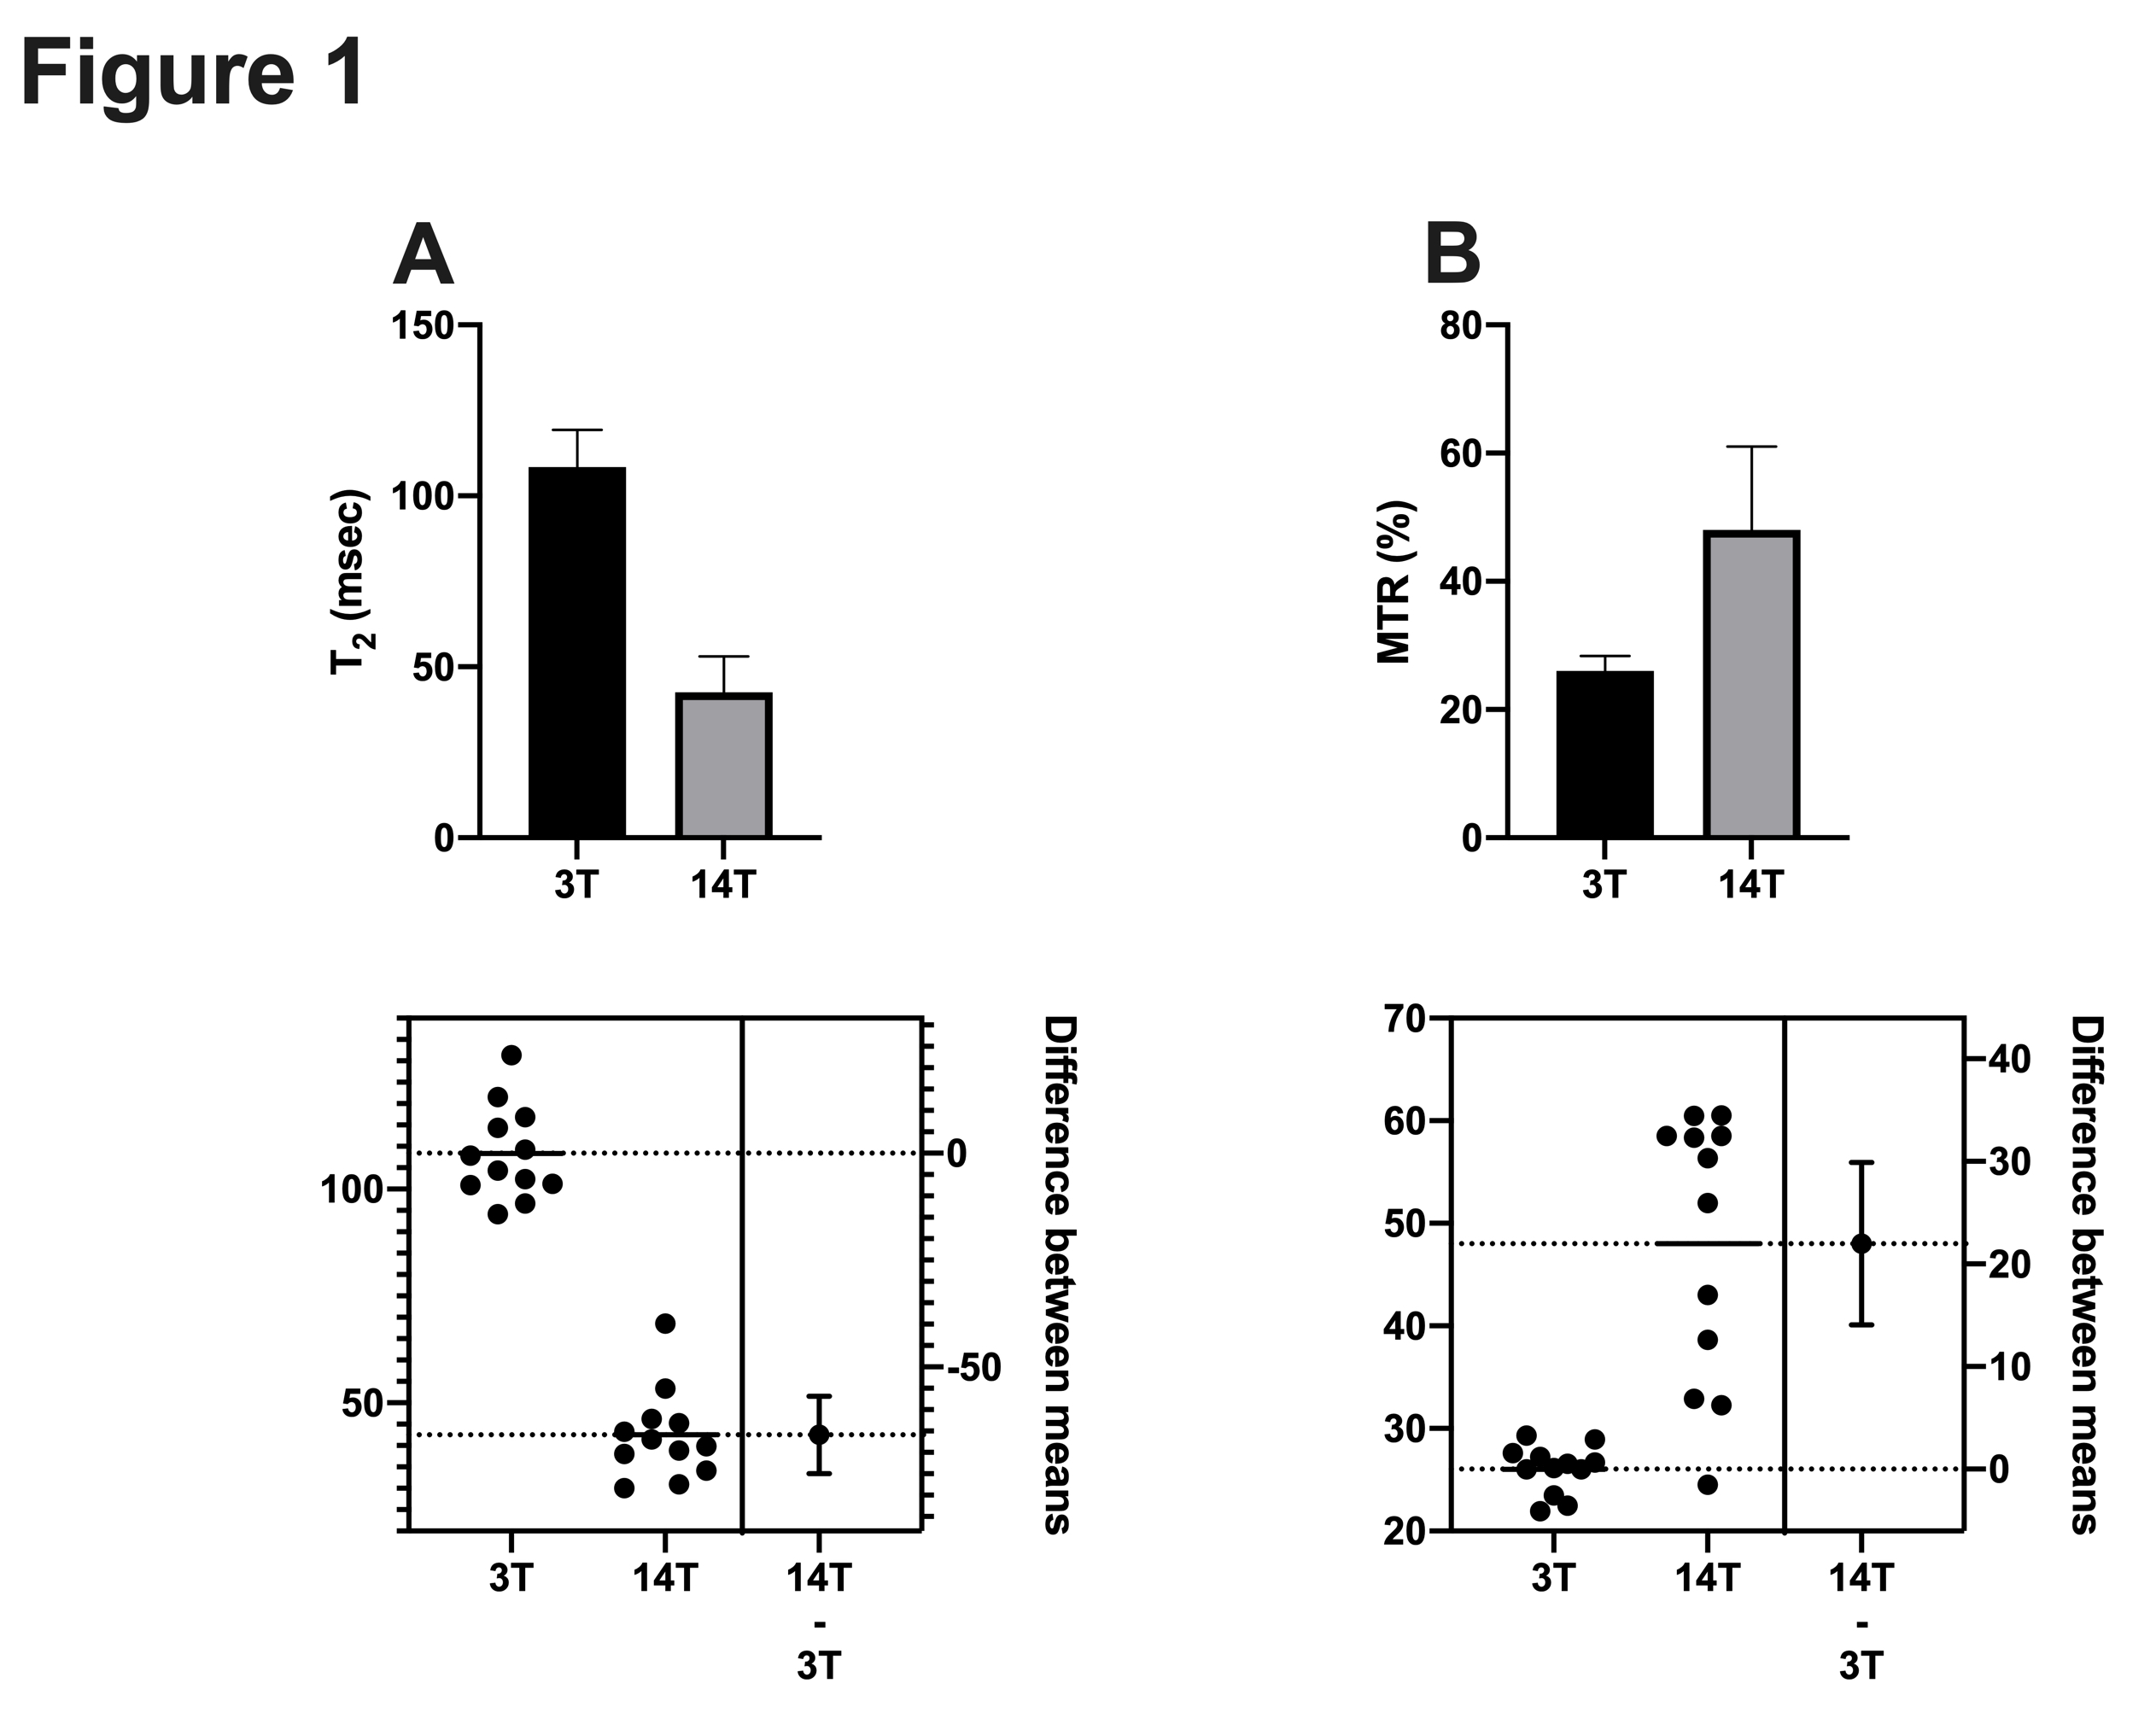
PDA T2 were significantly longer 108.4 ± 10.4 ms (mean ± SD) at 3.0 T compared to 42.5 ± 10.5 at 14.1 T (p < 0.05) (Figure 1A). On the other hand, MTR values were significantly shorter 26.04 ± 2.33 at 3.0T compared to 48.01 ± 12.2 % (p<0.05) at 14.1 T (Figure 1 b).Conclusions
The MR measurements provided in this study provide important information for designing and translating preclinical results to clinical protocols at 3.0 TAcknowledgements
This work is supported by NIH R01CA188654.References
1. Siegel, R.L., K.D. Miller, and A. Jemal, Cancer statistics, 2020. CA Cancer J Clin, 2020. 70(1): p. 7-30.2.
2. Maloney, E., et al., Non-Invasive Monitoring of Stromal Biophysics with Targeted Depletion of Hyaluronan in Pancreatic Ductal Adenocarcinoma. Cancers (Basel), 2019. 11(6).3.
3. Vohra, R., et al., Evaluation of pancreatic tumor development in KPC mice using multi-parametric MRI. Cancer Imaging, 2018. 18(1): p. 41.
Figures