2323
Differentiation of solid pseudopapillary tumor and neuroendocrine tumor of pancreas using enhanced T2 * weighted angiography
Longshuang Wang1, Yi Wang2, Ailian Liu3, and Qinhe Zhang3
1School of Medical Imaging,Dalian Medical University,Dalian, China, Dalian Liaoning, China, 2Department of Radiology, Dalian Friendship Hospital, Dalian, China, Dalian Liaoning, China, 3Department of Radiology, the First Affiliated Hospital of Dalian Medical University, Dalian Liaoning, China
1School of Medical Imaging,Dalian Medical University,Dalian, China, Dalian Liaoning, China, 2Department of Radiology, Dalian Friendship Hospital, Dalian, China, Dalian Liaoning, China, 3Department of Radiology, the First Affiliated Hospital of Dalian Medical University, Dalian Liaoning, China
Synopsis
It is difficult to differentiate the solid pseudopapillary tumor of the pancreas (SPTP) from pancreatic neuroendocrine tumors (PNET), due to their similar imaging characteristics. Enhanced T2 * weighted angiography (ESWAN) technique can simultaneously obtain amplitude, phase, R2 * and T2 * values, which can quantitatively assess the magnetic sensitivity characteristics of tissues. There was significant difference in R2 * (AUC: 0.707; sensitivity: 91.3%; specificity: 46.7%)and T2*(AUC: 0.829; sensitivity: 73.9%; specificity: 86.7%)between SPTP and PNET. Therefore, ESWAN may be an effective method to identify SPTP and PNET.
Summary of Main Findings
In this study, we compared the amplitude, phase, R2 * and T2 * values of SPTP and PNET ESWAN sequences. The results showed that the R2 * value of sptp was significantly higher than that of PNET, and R2 * value was significantly lower than that of PNET.Introduction
Both SPTP and PNET are rare tumors in the pancreas. Although PNET is a blood rich tumor, about 41% - 49% of them have no obvious enhancement after contrast enhanced scanning[1]. SPTP has malignant potential, and content in the lesions are mainly composed of solid components, which are difficult to differentiate from PNET[2]. There are significant differences between SPTP and PNET in invasion, treatment and prognosis. Correct preoperative diagnosis is of great importance in guiding clinical treatment and judging the prognosis. ESWAN sequence could assess the difference of magnetic sensitivity in different tissues due to the presence of iron in blood[3]. It can provide multiple quantitative parameters.Purpose
To evaluate the diagnostic value of multiple quantitative parameters of ESWAN sequence in the differential diagnosis of SPTP and PNET.Methods
15 cases of SPTP and 23 cases of PENT were enrolled in our study. There were significant differences in age and lesion size between two groups (Table 1). A 1.5T MR scanner (Ge signa hdxt) with phased array coil was used. Scanning sequence and parameters were described in T1WI: TR / TE, 620 ms / 90 ms, matrix, 320 × 192, NEX, 1, slice / gap, 6.0 mm/1.5 mm, FOV, 38 cm × 38 cm, scanning time, 17 s; T2WI: TR / TE, 6000 ms / 102 ms, matrix 288 × 224, nex 3, slice / gap, 6.0 mm/1.5 mm, FOV, 38 cm × 38 cm, scanning time, 17 s. ESWAN: TR/TE, 16.4 ms / 2.1 ms, angle, 20°, matrix, 256 × 192, FOV, 38 cm × 38 cm, slice, 2 mm. The phase, amplitude, R2* and T2* images were obtained by functool software. Measurement of Magnitude value,Phase value,R2 * value and T2* value,were performed by two radiologists ,with 5-year and 10-year MRI diagnosis experience, respectively), using double-blind method on the workstation. Three circular ROIs were placed in the solid part of the lesions with an area of about 25-100 mm2.All data were anlyzed by SPSS 26.0. Intra class correlation coefficients (ICC) were used totest the consistency of the measurements of two observers. ICC < 0.40 was poor consistency, 0.40 ≤ ICC < 0.75 was medium consistency, ICC ≥ 0.75 was good consistency. Kolmogorov-smirov test was used to test the normal distribution. The differences between two groups were analyzed by Independent sample T test or Mann Whitney U test. Receiver operator characteristic curve (ROC curve) was used to analyze the diagnostic efficacy, and area under curve (AUC), threshold, sensitivity and specificity were obtained.Results
The results of two observers were in good agreement(Table2).The the value of R2* in SPTP group were significantly smaller than those in PENT group, but the value of T2* was sm bigger aller than that in PENT group, with statistical significance (P<0.05)(Table3). The areas under the curves were 0.707 for R2*(sensitivity91.3%,specificity46.7%,Cutoff value≤22.44), 0.829 for T2* (sensitivity73.9%, specificity86.7%,Cutoff value≥48.4).(Figure 1).Discussion
Reconstructed images including amplitude, phase, R2 * and T2 * images were obtained to quantitatively reflect the magnetic sensitivity characteristics of tissues based on ESWAN. R2 * value (representing the apparent transverse relaxation rate) is positively correlated with the concentration of paramagnetic substances. It can evaluate the changes of local tissue oxygen content quantitively and is related to hypoxia, bleeding, abnormal blood vessels. With the increasing of blood metabolite concentration (such as deoxyhemoglobin), R2 * value increases significantly[4]. PNET size is smaller, mainly containing solid components, and tumor stromal blood sinus is rich[5]. In addition, the oxygen content of PNET is higher than STPT, which may be why R2 * of PNET is significantly higher than STPT.Conclusion
R2 * and T2 * based on ESWAN sequence may be an effective way to distinguish SPTP from PNET, which is of great significance for clinical preoperative diagnosis and prognosis judgment.Acknowledgements
No acknowledgement foundReferences
[1].JEON S K,LEE J M,JOO I,et al. Nonhypervascular Pancreatic Neuroendocrine Tumors: Differential Diagnosis from Pancreatic Ductal Adenocarcinomas at MR Imaging-Retrospective Cross-sectional Study[J].Radiology.2017,284(1): 77-78.[2].Serra S, Chetty R.Revision 2:an immunohistochemical approach and evaluation of solid pseudopapillary tumor of the pancereas [J].J Clin Pathol.2008,61(11):1153-1159.[3].Li Z,Cao L,Dong W,et al.Prevalence and Risk Factors of Cerebral Microbleeds in Patients with Nonvalvular Atrial Fibrillation:An Enhanced T2*-Weighted Angiography Imaging Study.Eur NEUROL,2019,81(3-4):112-119.[4].Karlsson M, Ekstedt M, Dahlström N, et al. Liver R2 * is affected by both iron and fat: a dual biopsy-validated study of chronic liver disease. J Magn Reson Imaging. 2019, 50(1): 325-333.[5].d'Assignies G, Couvelard A, Bahrami S, et al.Pancreatic endocrine tumors:Tumor blood flow assessed and correlate with prognostic factors. Radiology,2009,250(2):407-416.Figures
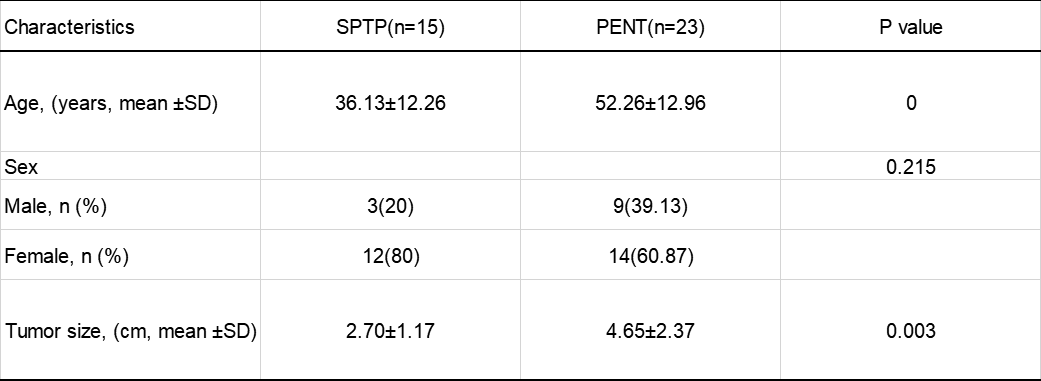
Table 1. Clinical Characteristics of SPTP and PENT
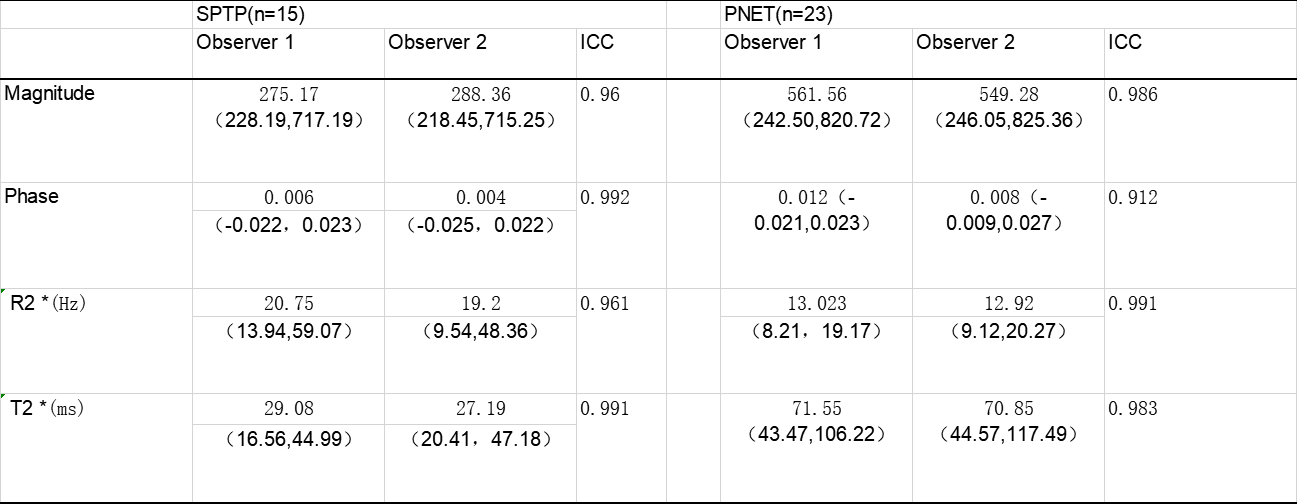
Table 2. Two observers measure lesions the consistency analysis of various parameters
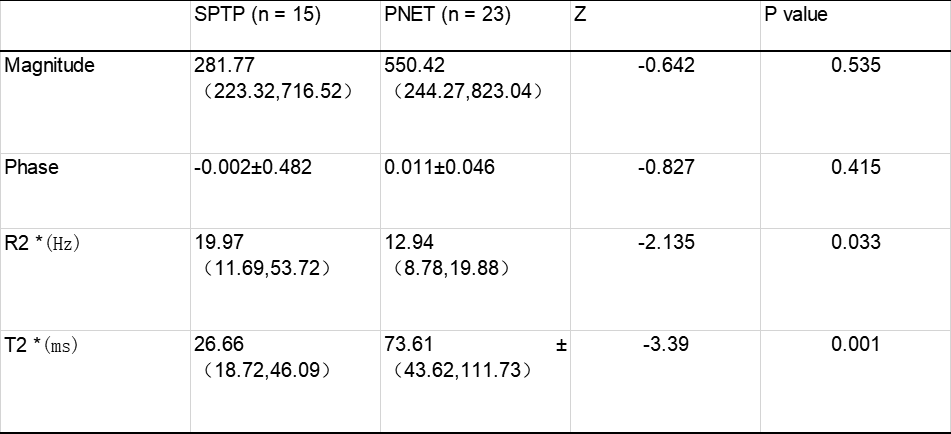
Table 3. Two groups of lesions each parameter value comparison results
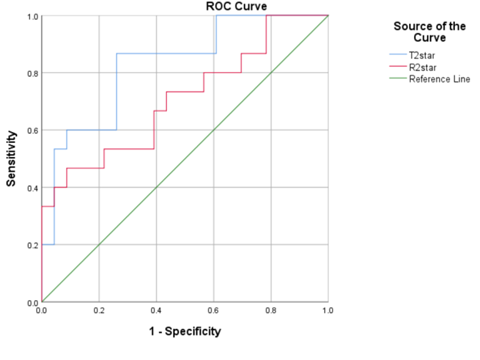
Figure 1 ROC curve of R2* and T2*
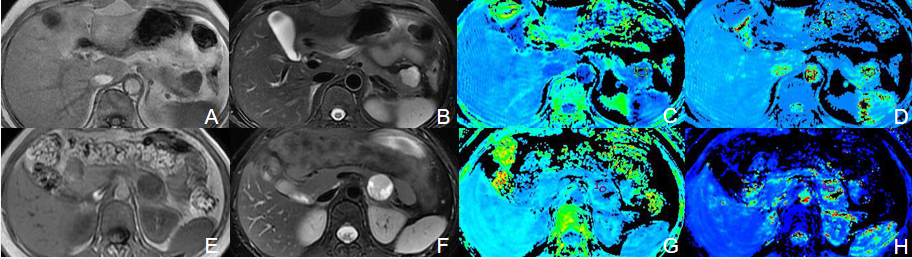
Figure 2. Patient,female,49 years old,PNET, pathological type:neuroendocrine tumor of tail of pancreas (G2).A-D: the T1WI image(hypointense),T2WI image(hyperintense), images of R2*,images of T2*,respectively.Patient,female 26 years old,SPTP,pathological type: solid pseudopapillary tumor of pancreas. E-H:the T1WI image (hypointense), T2WI image (hyperintense), images of R2*, images of T2*, respectively.