2321
Monitoring tumor microenvironment in a mouse model of pancreatic ductal adenocarcinoma using MRI during early stages of tumor development.1Radiology, University of Washington, Seattle, WA, United States, 2Applied Physics Laboratory, University of Washington, Seattle, WA, United States, 3Gastroenterology, University of Washington, Seattle, WA, United States
Synopsis
Pancreatic cancer is expected to become the second leading cause of the cancer related deaths in the USA by 2020. A genetically engineered mouse model (KPC) offers an alternative to transplantation models for preclinical therapeutic evaluation as it expresses mutations similar to human pancreatic cell. Magnetic resonance imaging can be used to monitor tumor microenvironment in variety of tumors. The goal of this study was to monitor tumor microenvironment in KPC mouse model during the early stages of tumor development.
Introduction
Recently, a genetically engineered mouse model (KPC) has been developed that offers an alternative to transplantation models for preclinical therapeutic evaluation as it expresses mutations similar to human pancreatic cells [1] and develops pancreatic tumors whose pathophysiology and molecular features resemble those of human PDAC [2]. Multi-parametric magnetic resonance imaging (mp-MRI) has yielded good results in pancreatic cancer detection, location in monitoring therapeutic effects [3, 4]. Previously, we have demonstrated changes in the tumor microenvironment in the tumors ranging from 100 mm3 and up [4]. The purpose of this study was to monitor the tumor micro-environment using MRI when the size of the tumor is less than 100mm3.Materials and Methods
KPC mice (n = 6) were imaged using 14T Bruker Avance 600 MHz/89 mm wide-bore vertical MR spectrometer (Bruker Corp., Billerica, MA). Anatomical images: The multi-slice MRI protocol, covering the whole tumor, started with fat-suppressed T1 weighted coronal images (repetition time (TR) = 2000 ms, echo time (TE) = 5.49 ms, number of averages (NA) = 1, field of view (FOV) = 30 × 30 mm2, rare factor = 8, matrix size = 128 × 256; for anatomical reference. Subsequently, 20 axial images were acquired to calculate tumor volume. T1 weighted images were acquired using following parameters: TE = 9.66 ms, TR = 5500, 3000, 1500, 1000, 385.8 ms, NA = 1, spatial resolution of 0.117 x 0.234 mm/pixel. The quantitative T2 maps were generated using a multi-slice multi echo sequence, with fat signal suppressed, utilizing following parameters: TR = 4000 ms; TE = 12 echoes equally spaced from 6.28 ms to 75.4 ms; NA = 1. Diffusion weighted images were acquired with 8 different b values (0, 30, 60, 100, 150, 200, 300, 500) s/mm2. Low b values (i.e., <100 s/mm2 were used to generate perfusion fraction maps, and higher b values (i.e., >100 s/mm2 were used to generate tissue diffusivity maps.Magnetization transfer ratio (MTR) images were acquired using a gradient echo sequence (TR/TE = 625/2 ms, flip angle =30o) with an off-resonance frequency of 7000 Hz and a saturation pulse block pulse shape, 50 ms width, and 10 µT amplitude. A series of 10 images were acquired with FOV = 30 mm x 30 mm, matrix size = 256 x 256 yielding spatial resolution of 0.117 x 0.117 mm/pixel. On a single 1 mm slice, delineating tumor, amide proton transfer (APT) imaging was performed. CEST imaging data were acquired using RARE sequence (continuous-wave block pulse, B1 = 0.5 μT, duration = 2 s), which was applied at 25 frequency offsets from − 360 Hz to 360 Hz with an interval of 0.5 ppm to estimate a center frequency shift (water saturation shift referencing (WASSR) approach). Other imaging parameters were: TR/TE = 2200/7 ms, FOV = 30 × 30 mm2, matrix size = 128 × 128, flip angle = 180o, and number of excitations = 1. For saturation a single slice was acquired with 6 frequency offsets at ±3.0, ±3.5, ±4.0 ppm, with an off-resonance RF pulse applied for 3 s at a power level of 2 μT. Other parameters were: TR/TE = 5000/7 ms, matrix = 128 × 128 (reconstructed phase encoding steps = 128; acquisition phase encoding steps = 96), FOV = 30 × 30 mm2, rare factor = 8. Finally, a control image with the saturation offset at 300 ppm was also acquired.All data were analyzed using Image J ((http://imagej.nih.gov/ij/), and Horos software (v 3.3.6, https://horosproject.org/).Results
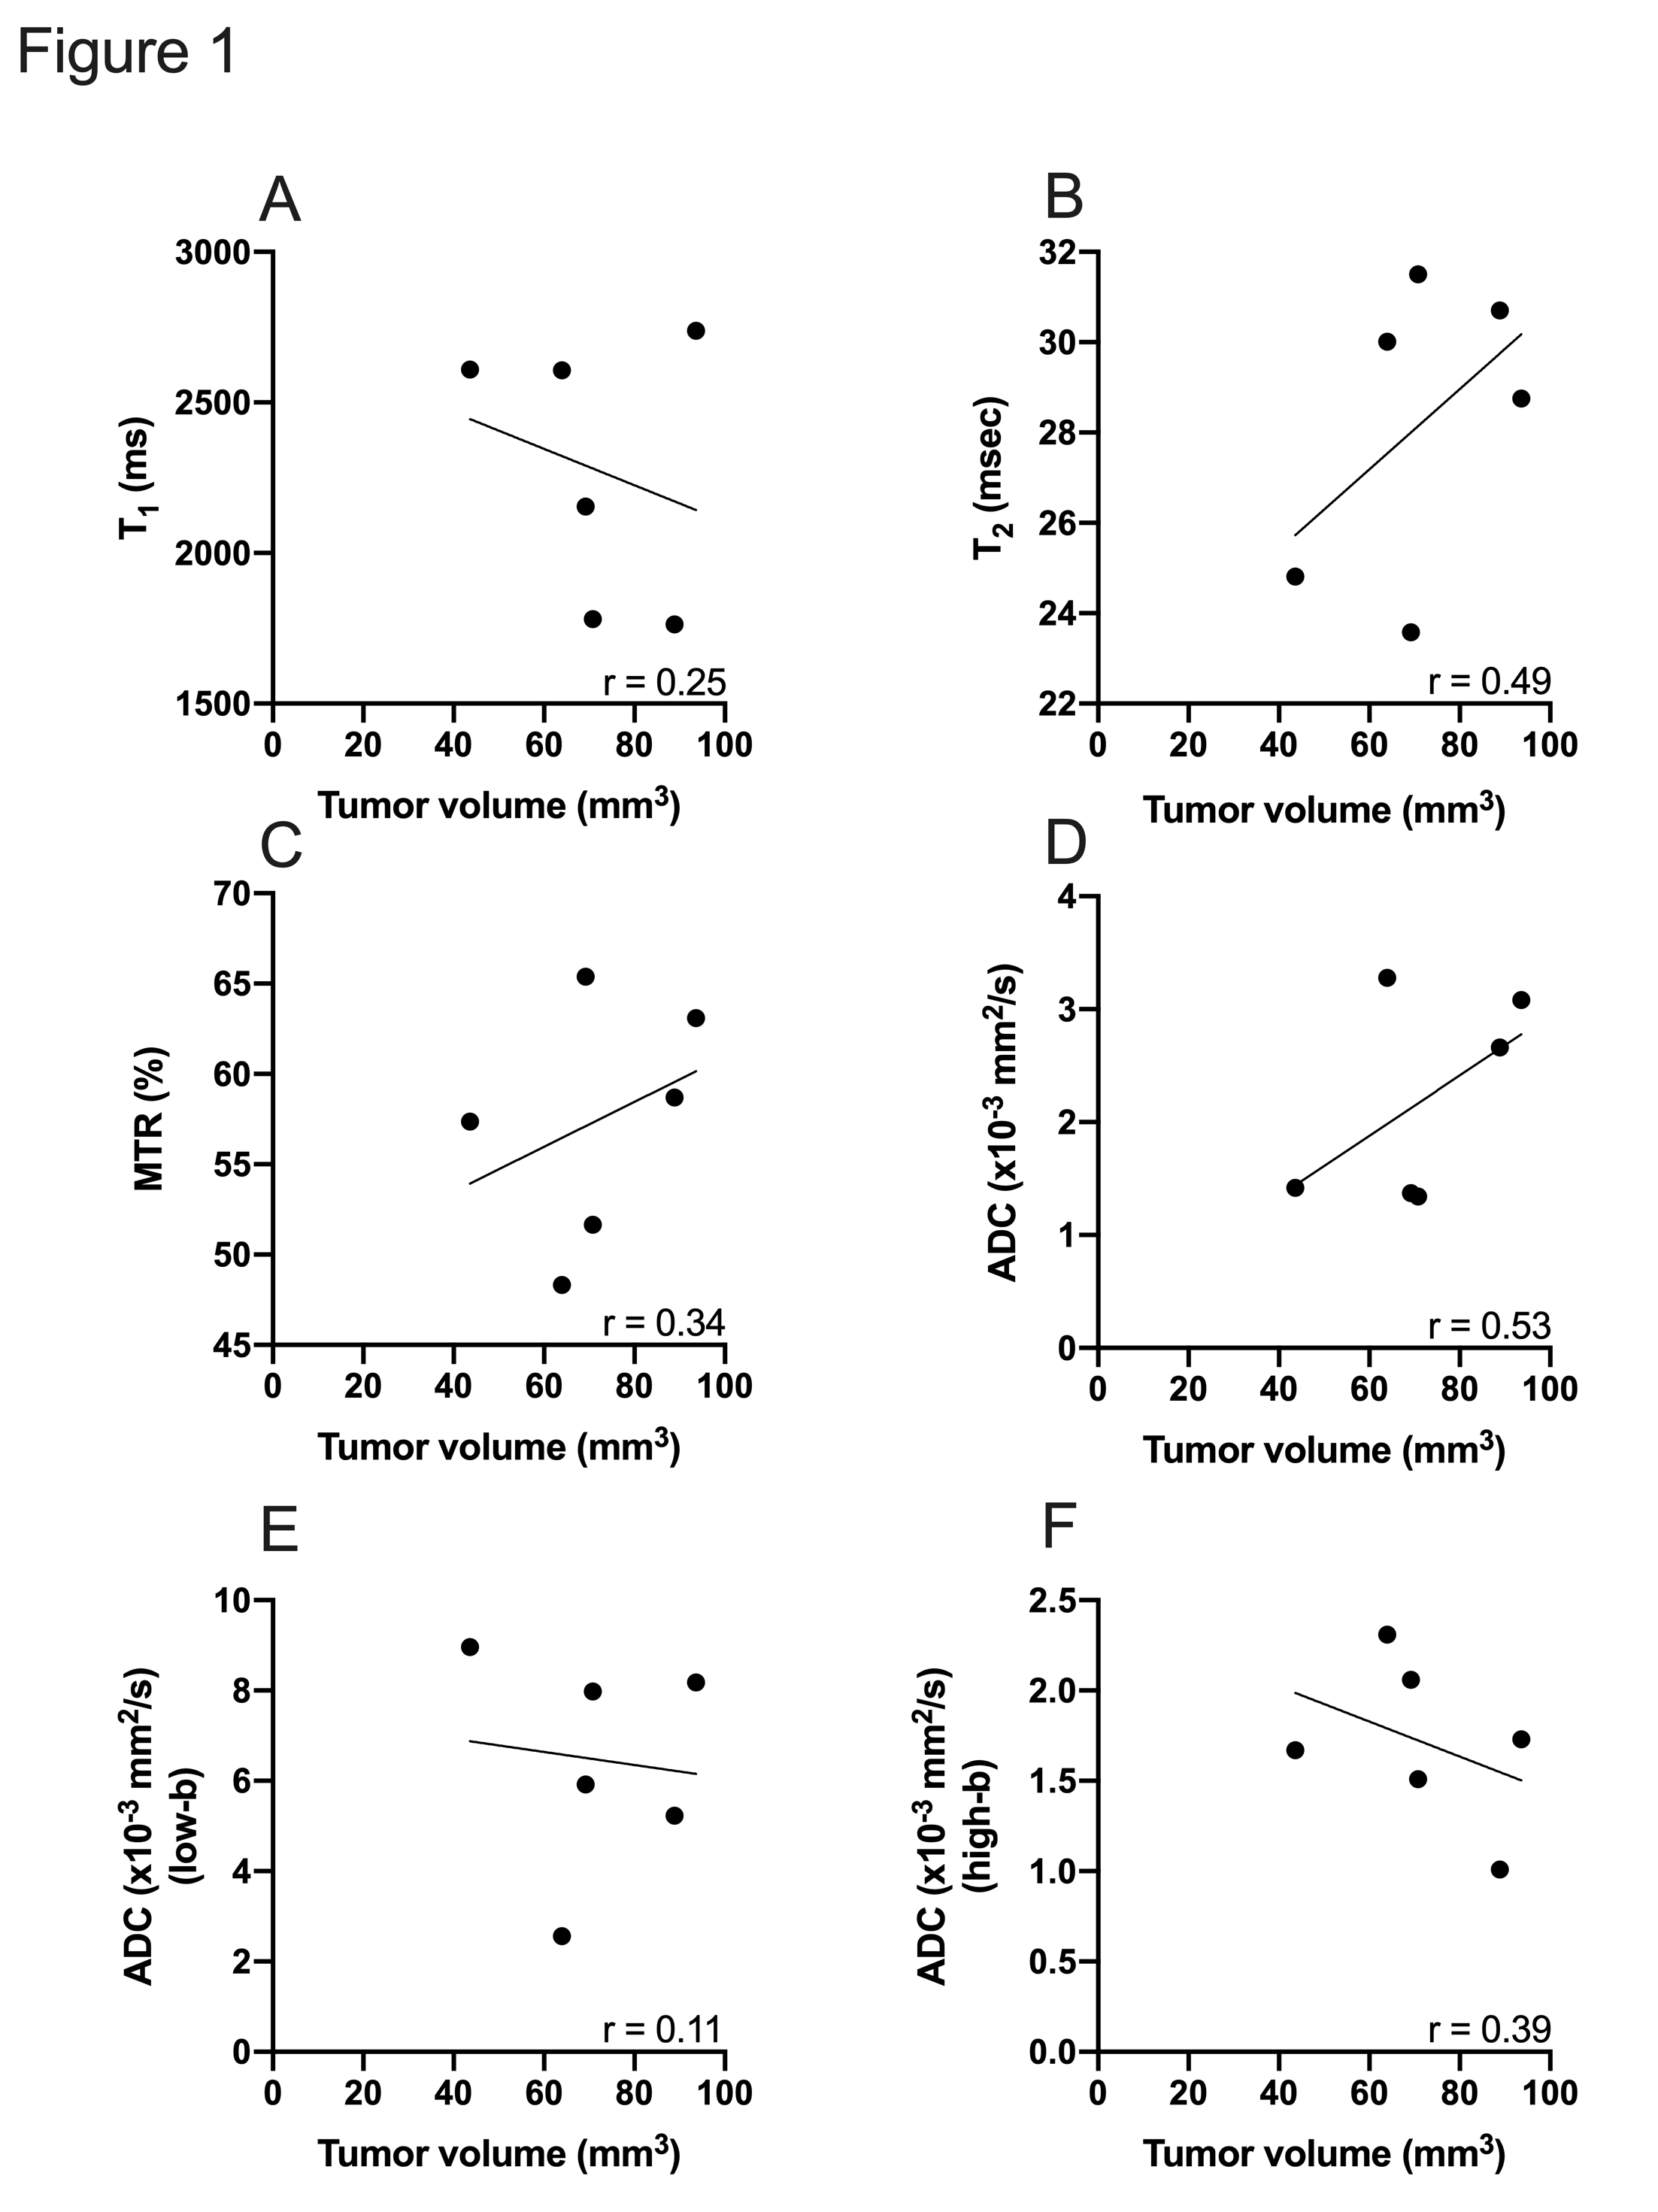
Multi-parametric data was analyzed based on the tumor volume. All mice included in the study had a tumor volume of less than 100 mm3. T2 and ADC demonstrated a moderate positive correlation with the tumor volume (r= 0.49 and 0.53 respectively) (Figure 1). However, other parameters failed to demonstrate a similar correlation with the increase in tumor size.Conclusions
We have previously demonstrated an increase in T2 with an increase in tumor size [4] which, in part, was dependent on the presence of cystic areas throughout the tumor. Furthermore, one could speculate that increase in fluid content with the presence of cystic areas, ADC increases as well. In the present study, we have demonstrated that there is a positive correlation between tumor volume and T2 and ADC indicating accumulation of cystic areas even during the early stages of tumor development.Acknowledgements
This work is supported by NIH R01CA188654.References
1. Hingorani, S.R., et al., Trp53R172H and KrasG12D cooperate to promote chromosomal instability and widely metastatic pancreatic ductal adenocarcinoma in mice. Cancer Cell, 2005. 7(5): p. 469-83.2.
2. Hruban, R.H., et al., Pathology of genetically engineered mouse models of pancreatic exocrine cancer: consensus report and recommendations. Cancer Res, 2006. 66(1): p. 95-106.3.
3. Maloney, E., et al., Non-Invasive Monitoring of Stromal Biophysics with Targeted Depletion of Hyaluronan in Pancreatic Ductal Adenocarcinoma. Cancers (Basel), 2019. 11(6).4.
4. Vohra, R., et al., Evaluation of pancreatic tumor development in KPC mice using multi-parametric MRI. Cancer Imaging, 2018. 18(1): p. 41.
Figures