2319
Predicting fibrosis grades of pancreatic ductal adenocarcinoma using intravoxel incoherent motion diffusion-weighted imaging1Department of Radiology, The Third Affiliated Hospital of Soochow University, Changzhou, China, 2Clinical Science, Philips Healthcare, Shanghai, China
Synopsis
This study explored the feasibility of evaluating fibrosis of patients with PDAC and correlate it with histopathological features using IVIM-DWI compared with DWI. No statistically significant differences were found in ADC and D* values between the high- and low-fibrosis groups. A significant negative correlation between D values and fibrosis and a significant positive correlation between f values and fibrosis were observed. D and ƒ values derived from the IVIM model had high sensitivity and diagnostic performance for grading fibrosis in PDAC compared with the conventional DWI model. IVIM-DWI could serve as an imaging biomarker for predicting the fibrosis grade of PDAC.
Introduction
Pancreatic ductal adenocarcinoma is a highly fatal disease with a 5-year survival rate of approximately 10% in the USA (1). Surgical resection in combination with chemotherapy provides the best overall survival but 80% of patients are unresectable. Systemic chemotherapy remains the primary treatment modality with the purposes of palliating cancer-related symptoms and prolonging life. Besides a survival benefit, the chemotherapy has the ability to downstage unresectable disease and provides an opportunity of a curative surgery in approximately 10% - 30% of patients (2). However, the result of chemotherapy on PDAC patients is inconsistent from no reaction to complete remission. The tumor microenvironment (TME) plays an important role in the chemotherapy of PDAC. The TME is comprised of acellular stroma, pancreatic stellate cells, immune cells and soluble factors (3). Pancreatic stellate cells are activated by cancer cells to produce fibrosis surrounding the tumor. The resultant desmoplasia is known to be responsible for creating a mechanical barrier around the tumor cells, preventing appropriate vascularization and thus limiting exposure to chemotherapy and leading to poor immune cell infiltration (4). As a result, efforts are being made to develop new therapies that target both tumor cells and fibrous tissue (5-7). Treatment planning and monitoring of therapy would benefit from assessing the fibrosis non-invasively and correctly. Diffusion weighted imaging uses a single exponential model to measure the ADC values to reflect the diffusion motion of water molecules in tissues quantitatively (8). By measuring diffusion properties of water molecules, DWI is capable of non-invasively probing tissue properties and physiology at cellular and macromolecular level (9). Several studies have applied the mean ADC value was significantly higher in the loose fibrosis group than in the dense fibrosis group (10, 11), and negative correlated with fibrosis(12). However, the ADC values obtained by traditional DWI contain both water molecule diffusion and microcirculatory perfusion. IVIM is an advanced imaging technique that was first proposed by Le Bihan et al (13). IVIM-DWI can separate water molecule diffusion and microcirculatory perfusion-related diffusion which compensates for the shortcomings of traditional DWI. Several studies have applied IVIM-DWI better diagnostic performance than traditional ADC values (14-16). The studies of IVIM techniques includes distinguishing benign and malignant tumors, predicting the pathological grade of malignant tumors, evaluating the grade of fibrosis, evaluating the postoperative tumor recurrence or efficacy after radiotherapy or chemotherapy, and evaluating tissue perfusion et al (17-25)[a1] . However, there are few studies on IVIM-DWI assessment of PDAC fibrosis, and their conclusions are inconsistent. Klauss et al. (26) found no correlation between D values and fibrosis, though H et al. (11) think that D values are negatively correlated with fibrosis while Klaassen et al. (27) found it is positive. As a result, the small sample sizes in most studies, inconsistent scanning techniques, inconsistent study population, and different pathological evaluation methods were still insufficient to draw a robust conclusion for the performance of IVIM-DWI. The purpose of this study is to make further efforts to speculate whether IVIM-DWI parameters could effectively predict the histopathology of PDAC.Methods
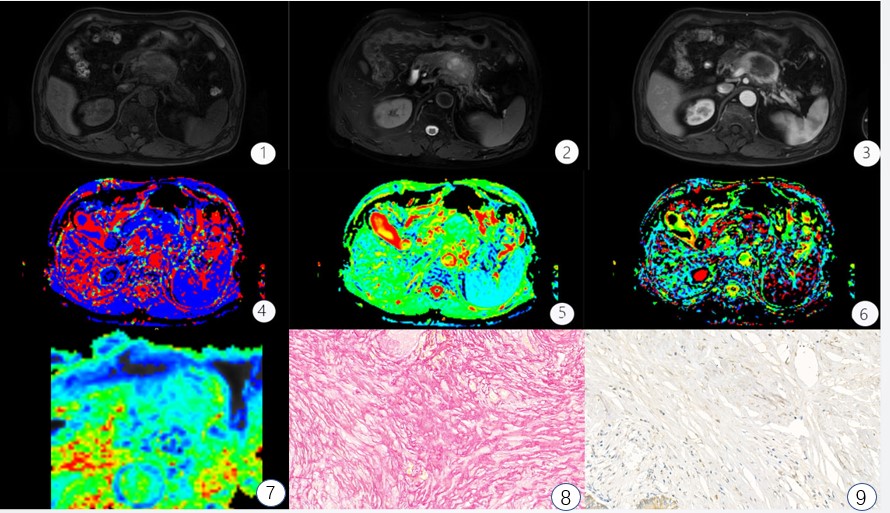
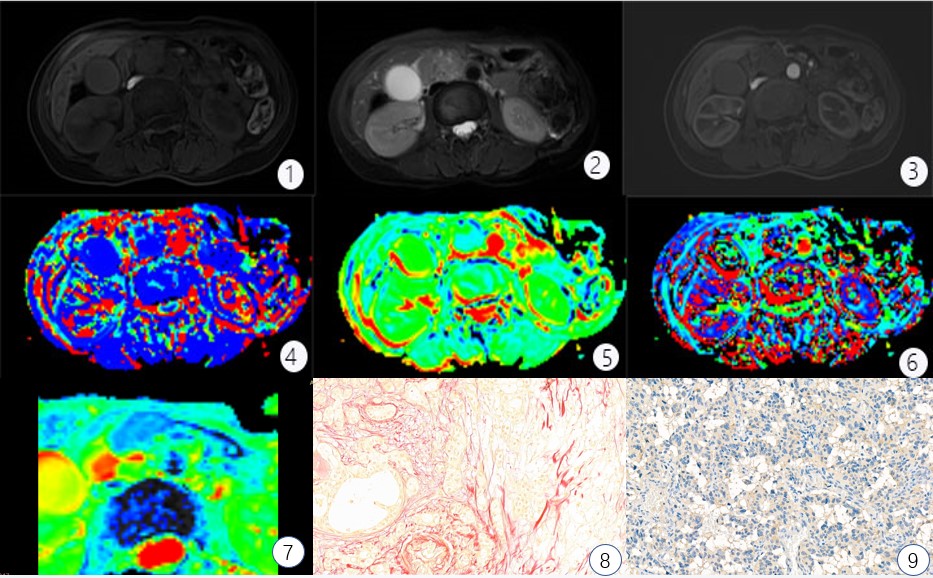
This retrospective study assessed 50 patients with surgically resected, pathologically confirmed PDAC who underwent DWI and IVIM-DWI with 10 b values (b = 0, 10, 20, 40, 60, 80, 100, 150, 200, and 500 s/mm2) from December 2018 to May 2020 using a 3.0T Ingenia magnetic resonance imaging scanner (Philips Healthcare, the Netherlands). The tumor tissue was stained with sirius red, CD34, and CK19 to quantitate fibrosis, microvascular density (MVD), and tumor cell density. Patients were classified into low- and high-fibrosis groups based on histopathological features. Apparent diffusion coefficient (ADC), diffusion coefficient (D), false diffusion coefficient (D*), and perfusion fraction (f) generated from IVIM-DWI were measured in tumor areas by two radiologists independently. Intraobserver and interobserver variabilities were assessed using intraclass correlation coefficient. ADC, D, D*, and f values were compared between high- and low-fibrosis groups using the Student t test. The association between quantitative DWI parameters and histopathology was assessed using correlation analysis (Fig. 1,2).Results
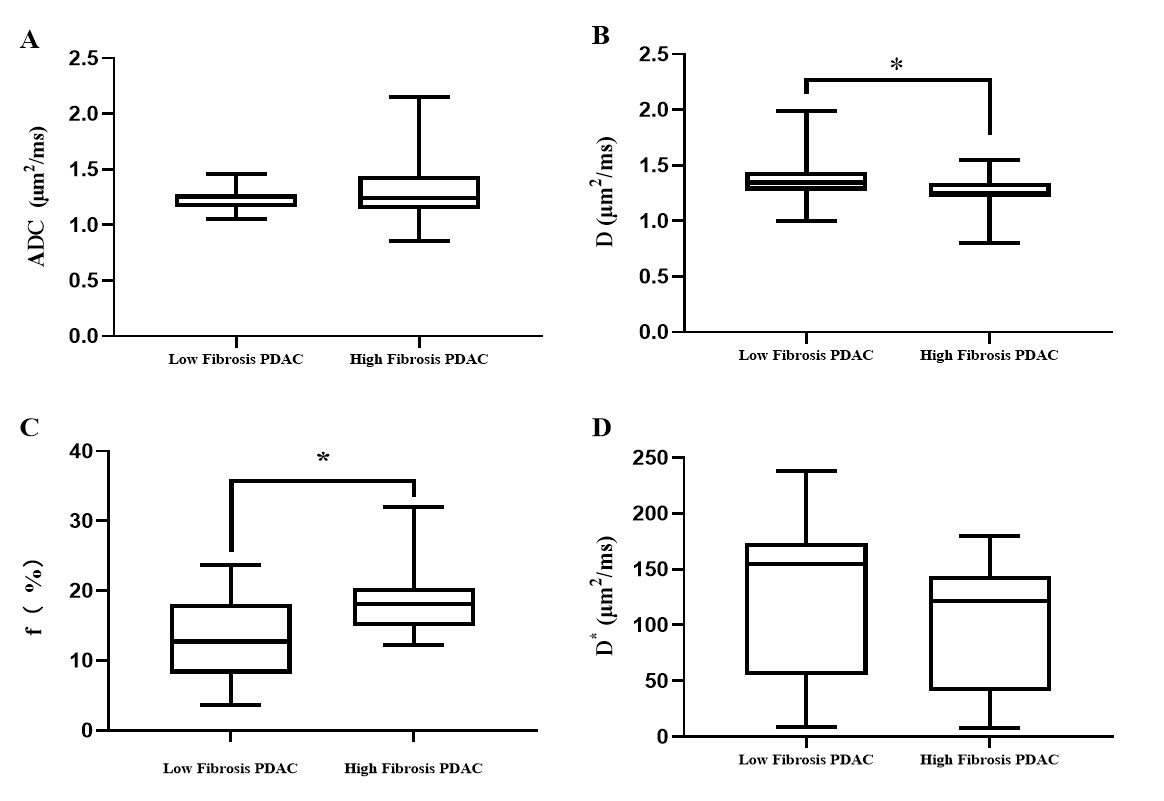
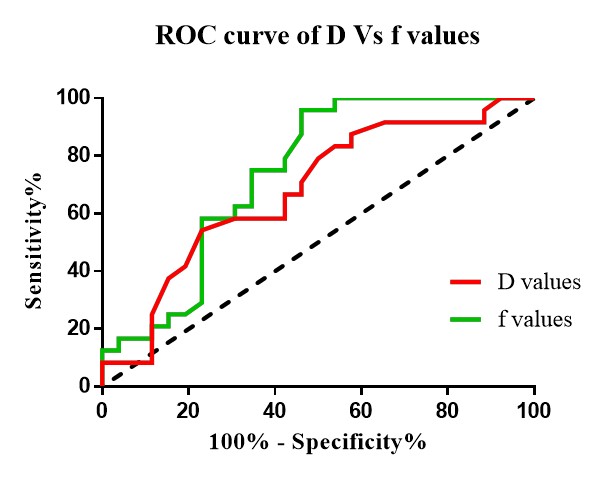
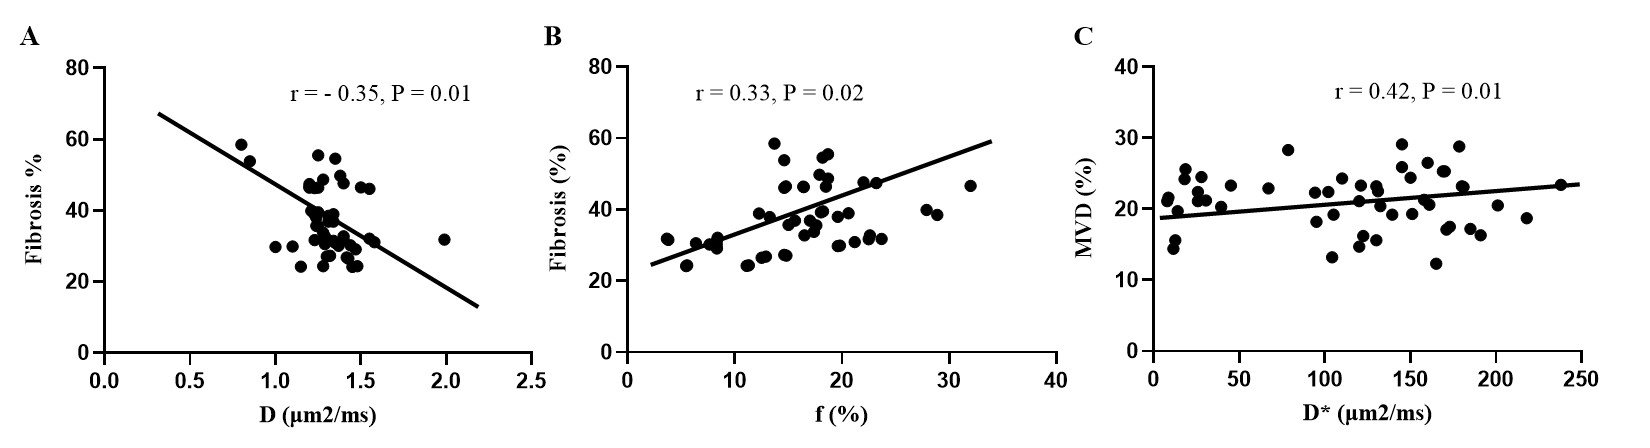
The interreader agreement for D* was very poor. The interreader and intrareader agreement in terms of other quantitative diffusion parameters was excellent for both observers. The D values were lower in the high-fibrosis group (1.26 ± 0.16 μm2/ms) than in the low-fibrosis group (1.36 ± 0.18 μm2/ms) while the f values followed the opposite trend [(18.80 ± 4.98) % vs (13.03 ± 6.22) %]. Further, no statistically significant differences were found in ADC and D* values between the high- and low-fibrosis groups (Fig. 3). The AUC of D and f values was 0.69 and 0.74, respectively, which had high evaluation efficacy in the high- and low-fibrosis groups (Fig. 4). A significant negative correlation between D values and fibrosis (r = - 0.35, P = 0.01, Fig. 5A) and a significant positive correlation between f values and fibrosis were observed (r = 0.42, P = 0.01, Fig. 5B).Conclusions
D and ƒ values derived from the IVIM model had high sensitivity and diagnostic performance for grading fibrosis in PDAC compared with the conventional DWI model. IVIM-DWI could serve as an imaging biomarker for predicting the fibrosis grade of PDAC.Acknowledgements
No acknowledgement found.References
1. Mizrahi J, Surana R, Valle J, Shroff R. Pancreatic cancer. Lancet (London, England). 2020;395(10242):2008-2020. doi:10.1016/s0140-6736(20)30974-0.
2. Rombouts S, Walma M, Vogel J, van Rijssen L, Wilmink J, Mohammad N, et al. Systematic Review of Resection Rates and Clinical Outcomes After FOLFIRINOX-Based Treatment in Patients with Locally Advanced Pancreatic Cancer. Annals of surgical oncology. 2016;23(13):4352-4360. doi:10.1245/s10434-016-5373-2.
3. Wang S, Li Y, Xing C, Ding C, Zhang H, Chen L, et al. Tumor microenvironment in chemoresistance, metastasis and immunotherapy of pancreatic cancer. American journal of cancer research. 2020;10(7):1937-1953.
4. Provenzano P, Cuevas C, Chang A, Goel V, Von Hoff D, Hingorani S. Enzymatic targeting of the stroma ablates physical barriers to treatment of pancreatic ductal adenocarcinoma. Cancer cell. 2012;21(3):418-29. doi:10.1016/j.ccr.2012.01.007.
5. S K, MC E, N C, PA T, RK G, A G, et al. Ormeloxifene suppresses desmoplasia and enhances sensitivity of gemcitabine in pancreatic cancer. Cancer research. 2015;75(11):2292-304. doi:10.1158/0008-5472.Can-14-2397.
6. MA J, DS C, A N, TE B, N C, KK F, et al. Hyaluronan impairs vascular function and drug delivery in a mouse model of pancreatic cancer. Gut. 2013;62(1):112-20. doi:10.1136/gutjnl-2012-302529.
7. V H, M R, M Y, DJ R, T M, M D. Tumour-stroma interactions in pancreatic ductal adenocarcinoma: rationale and current evidence for new therapeutic strategies. Cancer treatment reviews. 2014;40(1):118-28. doi:10.1016/j.ctrv.2013.04.004. 8. Taouli B, Koh D. Diffusion-weighted MR imaging of the liver. Radiology. 2010;254(1):47-66. doi:10.1148/radiol.09090021.
9. Ni P, Lin Y, Zhong Q, Chen Z, Sandrasegaran K, Lin C. Technical advancements and protocol optimization of diffusion-weighted imaging (DWI) in liver. Abdominal radiology (New York). 2016;41(1):189-202. doi:10.1007/s00261-015-0602-x.
10. Muraoka N, Uematsu H, Kimura H, Imamura Y, Fujiwara Y, Murakami M, et al. Apparent diffusion coefficient in pancreatic cancer: characterization and histopathological correlations. Journal of magnetic resonance imaging : JMRI. 2008;27(6):1302-8. doi:10.1002/jmri.21340.
11. EM H, MZ L, MR P, S J, HE R, SW W, et al. Can diffusion-weighted imaging serve as a biomarker of fibrosis in pancreatic adenocarcinoma? Journal of magnetic resonance imaging : JMRI. 2017;46(2):393-402. doi:10.1002/jmri.25581.
12. Bieliuniene E, Frokjaer JB, Pockevicius A, Kemesiene J, Lukosevicius S, Basevicius A, et al. Magnetic Resonance Imaging as a Valid Noninvasive Tool for the Assessment of Pancreatic Fibrosis. Pancreas. 2019 Jan;48(1):85-93. Epub 2018/11/20. doi:10.1097/MPA.0000000000001206.
13. Dixon W. Separation of diffusion and perfusion in intravoxel incoherent motion MR imaging: a modest proposal with tremendous potential. Radiology. 1988;168(2):566-7. doi:10.1148/radiology.168.2.3393682.
14. Yoon J, Lee J, Baek J, Shin C, Kiefer B, Han J, et al. Evaluation of hepatic fibrosis using intravoxel incoherent motion in diffusion-weighted liver MRI. Journal of computer assisted tomography. 2014;38(1):110-6. doi:10.1097/RCT.0b013e3182a589be. 15. Suo S, Cheng F, Cao M, Kang J, Wang M, Hua J, et al. Multiparametric diffusion-weighted imaging in breast lesions: Association with pathologic diagnosis and prognostic factors. Journal of magnetic resonance imaging : JMRI. 2017;46(3):740-750. doi:10.1002/jmri.25612.
16. Cho G, Moy L, Kim S, Baete S, Moccaldi M, Babb J, et al. Evaluation of breast cancer using intravoxel incoherent motion (IVIM) histogram analysis: comparison with malignant status, histological subtype, and molecular prognostic factors. European radiology. 2016;26(8):2547-58. doi:10.1007/s00330-015-4087-3.
17. Hu Y, Yan L, Wu L, Du P, Chen B, Wang L, et al. Intravoxel incoherent motion diffusion-weighted MR imaging of gliomas: efficacy in preoperative grading. Scientific reports. 2014;4:7208. doi:10.1038/srep07208.
18. Paschoal A, Leoni R, Dos Santos A, Paiva F. Intravoxel incoherent motion MRI in neurological and cerebrovascular diseases. NeuroImage Clinical. 2018;20:705-714. doi:10.1016/j.nicl.2018.08.030.
19. França M, Martí-Bonmatí L, Alberich-Bayarri Á, Oliveira P, Guimaraes S, Oliveira J, et al. Evaluation of fibrosis and inflammation in diffuse liver diseases using intravoxel incoherent motion diffusion-weighted MR imaging. Abdominal radiology (New York). 2017;42(2):468-477. doi:10.1007/s00261-016-0899-0.
20. Yoon J, Lee J, Lee K, Kim S, Kang M, Jang J, et al. Pancreatic Steatosis and Fibrosis: Quantitative Assessment with Preoperative Multiparametric MR Imaging. Radiology. 2016;279(1):140-50. doi:10.1148/radiol.2015142254.
21. Jones K, Michel K, Bankson J, Fuller C, Klopp A, Venkatesan A. Emerging Magnetic Resonance Imaging Technologies for Radiation Therapy Planning and Response Assessment. International journal of radiation oncology, biology, physics. 2018;101(5):1046-1056. doi:10.1016/j.ijrobp.2018.03.028.
22. Zhang J, Lee V. Renal perfusion imaging by MRI. Journal of magnetic resonance imaging : JMRI. 2020;52(2):369-379. doi:10.1002/jmri.26911.
23. Federau C. Intravoxel incoherent motion MRI as a means to measure in vivo perfusion: A review of the evidence. NMR in biomedicine. 2017;30(11). doi:10.1002/nbm.3780.
24. Ma W, Wei M, Han Z, Tang Y, Pan Q, Zhang G, et al. The added value of intravoxel incoherent motion diffusion weighted imaging parameters in differentiating high-grade pancreatic neuroendocrine neoplasms from pancreatic ductal adenocarcinoma. Oncology letters. 2019;18(5):5448-5458. doi:10.3892/ol.2019.10863.
25. Kim B, Lee S, Sung Y, Cheong H, Byun J, Kim H, et al. Intravoxel incoherent motion diffusion-weighted imaging of the pancreas: Characterization of benign and malignant pancreatic pathologies. Journal of magnetic resonance imaging : JMRI. 2017;45(1):260-269. doi:10.1002/jmri.25334.
26. Klauss M, Gaida M, Lemke A, Grünberg K, Simon D, Wente M, et al. Fibrosis and pancreatic lesions: counterintuitive behavior of the diffusion imaging-derived structural diffusion coefficient d. Investigative radiology. 2013;48(3):129-33. doi:10.1097/RLI.0b013e31827ac0f1.
27. Klaassen R, Steins A, Gurney-Champion O, Bijlsma M, van Tienhoven G, Engelbrecht M, et al. Pathological validation and prognostic potential of quantitative MRI in the characterization of pancreas cancer: preliminary experience. Molecular oncology. 2020. doi:10.1002/1878-0261.12688.
Figures