2317
Unloaded RF transmit coil B1+ maps do not correlate with SAR hotspots
Xin Chen1 and Michael Steckner1
1Canon Medical Research USA Inc., Mayfield Village, OH, United States
1Canon Medical Research USA Inc., Mayfield Village, OH, United States
Synopsis
MRI vendors have been asked to provide B1+ contour plots of unloaded whole body transmit coils in order to show technologists/radiographers where not position a patient for SAR hotspot/RF burn avoidance purposes. Two flaws with this strategy are demonstrated by modeling Duke at the abdominal landmark in the centered and off-set position: 1) B1+ maps correlate poorly to SAR hotspots, 2) loaded B1+ maps are significantly different relative to unloaded B1+ maps. Knowledge of the birdcage coil end-ring position in conjunction with spacing pads will improve RF burn safety outcomes.
Introduction
Reducing the frequency of RF burns is important. Skin/bore contact is one proposed RF burn mechanism1. It has been incorrectly postulated that B1+ contour plots from the unloaded whole body (WB) RF coil will show regions within the patient accessible space to be avoided in order to reduce skin/bore RF burns. SAR hotspots are a function of the Electric (E) field, which is induced by the time varying B1 total field. The correlation between B1/E-fields is poor because tissue electromagnetic properties are an important factor. Considering only the B1+ component further weakens the B1/E-field relationship because the B1- component becomes increasingly important with higher B0 and when the RF coil is loaded. This abstract demonstrates the weak relationship between B1+ and SAR hotspots at 3T by modeling the Duke digital model (abdominal landmark) in the center of the bore, vs an offset position near the coil.Methods
FDTD EM modeling was performed with Sim4Life (v5.2, ZMT, Zurich, Switzerland). Human model Duke2 (ZMT, Zurich, Switzerland) was positioned in an ISO/TS109743 WB Tx coil (16-rung high-pass birdcage, diameter 750mm, length 650mm. RF shield diameter 790mm, length 850mm4,5) for abdomen imaging (Figure 1). The coil was tuned to 128MHz and driven in quadrature mode with two voltage sources (10V) in one end ring. B1+ field was computed for the following cases: 1) unloaded coil (Figure 1c at the hotspot level shown in Figure 4) 2) Duke centered (Figure 1a) 3) Duke off-center with approximately 2.5 cm spacing between the coil elements and right arm skin surface (Figure 1b). All figures only show B1+rms.Results
Figure 1c shows the uniformity of the B1+ field produced by the unloaded WB birdcage coil, with the strongest fields immediately beside the transmit coil. The B1+ fields are relatively constant for the length of the transmit coil, except in the immediate vicinity of the endrings. The B1+ rolloff from isocenter in the central imaging regions of the coil cannot be clearly visualized in this representation. Figure 2a is a coronal map of log10(loaded B1+ / unloaded B1+) and associated SAR map, both at the level of the SAR wrist hotspot when Duke is centrally positioned. The unloaded coil B1+ map used in Figure 2a is not shown here, but is nearly identical to Figure 1c. Figure 3a shows the correlation between B1+ in the unloaded coil vs SAR for regions only within the body outline that are above 3% of the maximum SAR shown in Figure 2b. Figure 3b is equivalent to Figure 3a, but correlates the SAR with the loaded coil enhancement factor (not truncated) shown in Figure 2a. Figures 4a,b and Figures 5a,b are the equivalent to Figures 2a,b and Figures 3a,b respectively when Duke is laterally offset except at the coronal level of the elbow SAR hotspot.Discussion
With the exception of the space around the endrings, Figure 1c shows the B1+ field immediately beside the coil is uniform along the length of the coil and that outside of the coil the B1+ field is essentially zero. Figure 2a shows a large change in B1+ field in the loaded vs unloaded coil for Duke at center. In conjunction with Figure 2b the poor correlation between B1+ field variations and SAR hotspots is visualized, particularly near the armpits and wrists. Duke’s right arm has a higher B1+ enhancement in the loaded coil vs left arm, yet has lower SAR. Figure 3a demonstrates poor correlation between B1+ and SAR. A large range of SAR is possible for a given B1+. Figure 3b demonstrates that change in B1+ due to coil loading is also a poor predictor of SAR. While increasing B1+ enhancement may lead to increased SAR in some regions that trend reverses for the largest B1+ enhancements. Figures 4a, b are equivalent to Figures 2a, b for Duke in offset position. The poor correlation between B1+ and SAR remains. While the B1+ field is uniform along the length of the coil, the SAR within the arm is not uniform and reaches its maxima at locations in the arm that are not closest to the coil. While B1+ field intensity near the end rings is high, the SAR nearby is low. Figures 5a, b are equivalent to Figures 3a, b, but for Duke in the offset position, and also demonstrates the poor correlation between B1+ and SAR both with respect to the unloaded coil and the B1+ enhancement factor for the loaded coil.Conclusion
There is no useful correlation between B1+ maps, loaded or unloaded, and SAR hotspots. Any attempt to extract quantitative insights from a single unloaded B1+ map and apply to any patient and any landmark will be misleading. The only supportable conclusion is that B1+ fields are highest in the immediate vicinity of the coil and rapidly fall off outside the coil. Knowledge of the end-ring position and use of spacing pads is the best available information for reducing skin/bore RF burns.Acknowledgements
No acknowledgement found.References
- Delfino, J.G., Krainak, D.M., Flesher, S.A. and Miller, D.L. (2019), MRI‐related FDA adverse event reports: A 10‐yr review. Med. Phys., 46: 5562-5571. https://doi.org/10.1002/mp.13768
- Gosselin MC, Neufeld E, Moser H, et al. Development of a new generation of high-resolution anatomical models for medical device evaluation: the Virtual Population 3.0. Physics in Medicine and Biology. 2014; 59(18): 5287-5303.
- ISO/TS 10974:2012 Assessment of the safety of magnetic resonance imaging for patients with an active implantable medical device. Geneva, Switzerland: International Organization for Standardization, 2012.
- Murbach M, Neufeld E, Kainz W, et al. Whole-body and local RF absorption in human models as a function of anatomy and position within 1.5T MR body coil. Magn. Reson. Med. 2014; 71(2):839-845.
- Murbach M, Cabot E, Neufeld E, et al. Local SAR enhancements in anatomically correct children and adult models as a function of position within 1.5T MR body coil. Prog Biophys Mol Biol. 2011; 107(3):428-433.
Figures
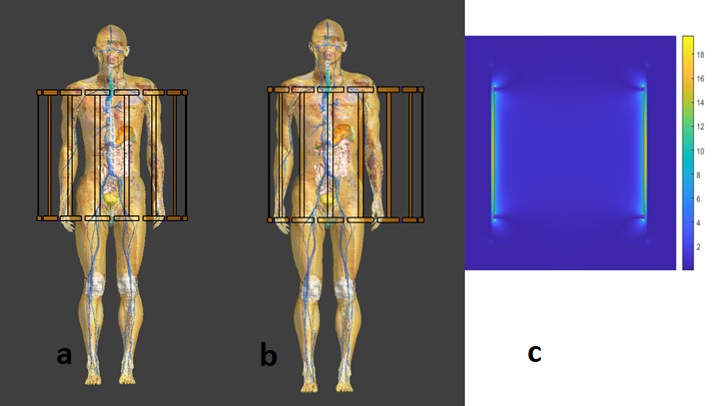
Figure 1. Duke
at abdomen landmark: a) centered b) shifted to his right side and c) associated unloaded coil B1+ map [uT] at hotspot level shown in Figure 4.
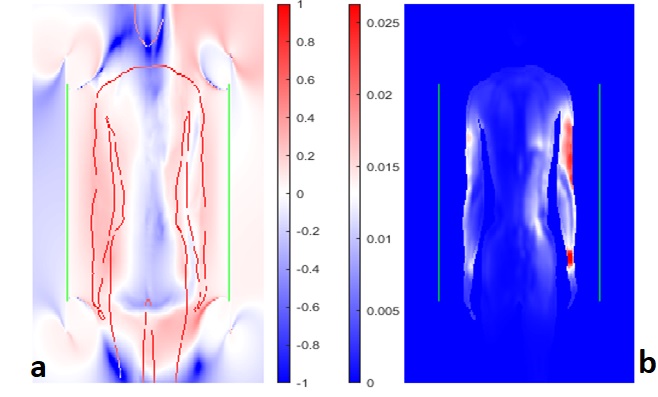
Figure 2. a) the variations in B1+ caused by
loading [log10(loaded B1+ / unloaded B1+)] and b) the associated SAR
map. Both figures are at the coronal level of the SAR hotspot in wrist for Duke
in the central position. The colourbar range in a) only has been truncated
by approximately 50% to magnify colour variations.
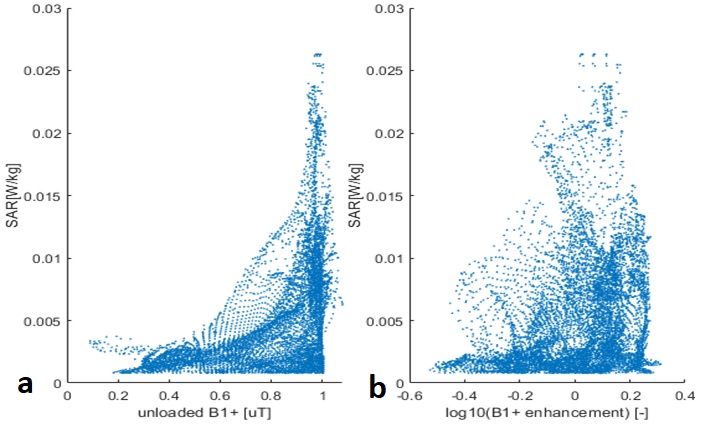
Figure 3. a) the absence of
correlation between unloaded B1+ and SAR within the body as shown in Figure 2 for only
those pixels above 3% of maximum SAR. b) the absence of
correlation between change in B1+ in the loaded coil vs SAR (same SAR
threshold) for Duke in the central position.
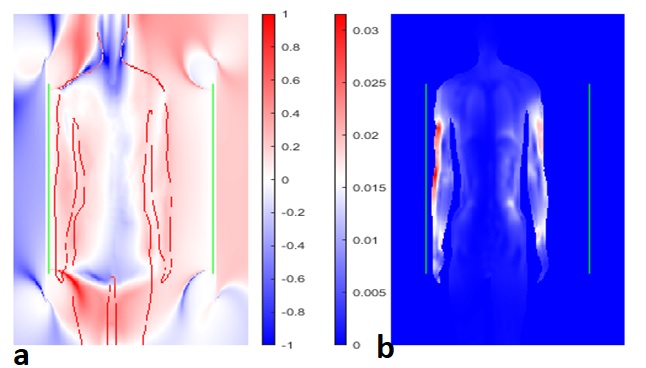
Figure 4. a) the variations in B1+ caused by
loading [log10(loaded B1+ / unloaded B1+)] and b) the associated SAR
map. Both figures are at the coronal level of the hotspot in the elbow for Duke
in the offset position. The colourbar range in a) only has been truncated
by approximately 50% to magnify colour variations.
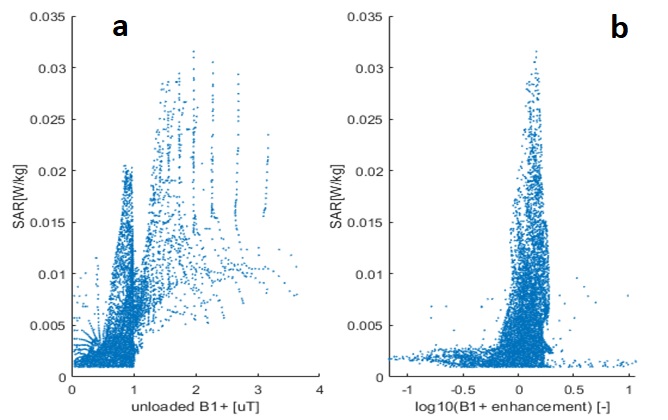
Figure 5. a) demonstrates the absence of
correlation between unloaded B1+ and SAR within the body as shown in Figure 4 for only
those pixels above 3% of maximum SAR. b) shows the absence of
correlation between change in B1+ in the loaded coil vs SAR (same SAR
threshold) for Duke in the offset position.