2316
Safety evaluation with respect to RF-induced heating of a new setup for Transcranial Electric Stimulation during MRI1Section for Magnetic Resonance, DTU Health Tech, Technical University of Denmark, Kgs Lyngby, Denmark, 2Danish Research Centre for Magnetic Resonance, Centre for Functional and Diagnostic Imaging and Research, Copenhagen University Hospital, Amager and Hvidovre, Denmark, 3Sino-Danish Center for Education and Research, Aarhus, Denmark, 4University of Chinese Academic of Sciences, Beijing, China, 5High-Field Magnetic Resonance Center, Max-Planck-Institute for Biological Cybernetic, Tübingen, Germany, 6MRI-STaR-Magnetic Resonance Institute for Safety, Technology and Research GmbH, Gelsenkirchen, Germany, 7MR:comp GmbH, MR Safety Testing Laboratory, Gelsenkirchen, Germany, 8State Key Laboratory of Brain and Cognitive Science, Beijing MRI Center for Brain Research, Institute of Biophysics, Chinese Academy of Sciences, Beijing, China, 9Beijing Institute for Brain Disorders, Beijing, China
Synopsis
Combining transcranial electrical stimulation (TES) with MRI offers various interesting research opportunities, but also introduces safety concerns. Coupling between the RF field and highly conductive TES leads can lead to skin burns. These safety issues are usually mitigated with the use of safety resistors and controlled lead paths that reduce the power absorbed by the leads. However, these methods introduce practical limitations for combined TES/MRI experiments, such as limited stimulation currents and cable stray fields corrupting MR current density imaging. We overcome these limitations by using low-conductivity silicone-rubber as TES leads. Simulations and temperature measurements are used for safety assessment.
Introduction
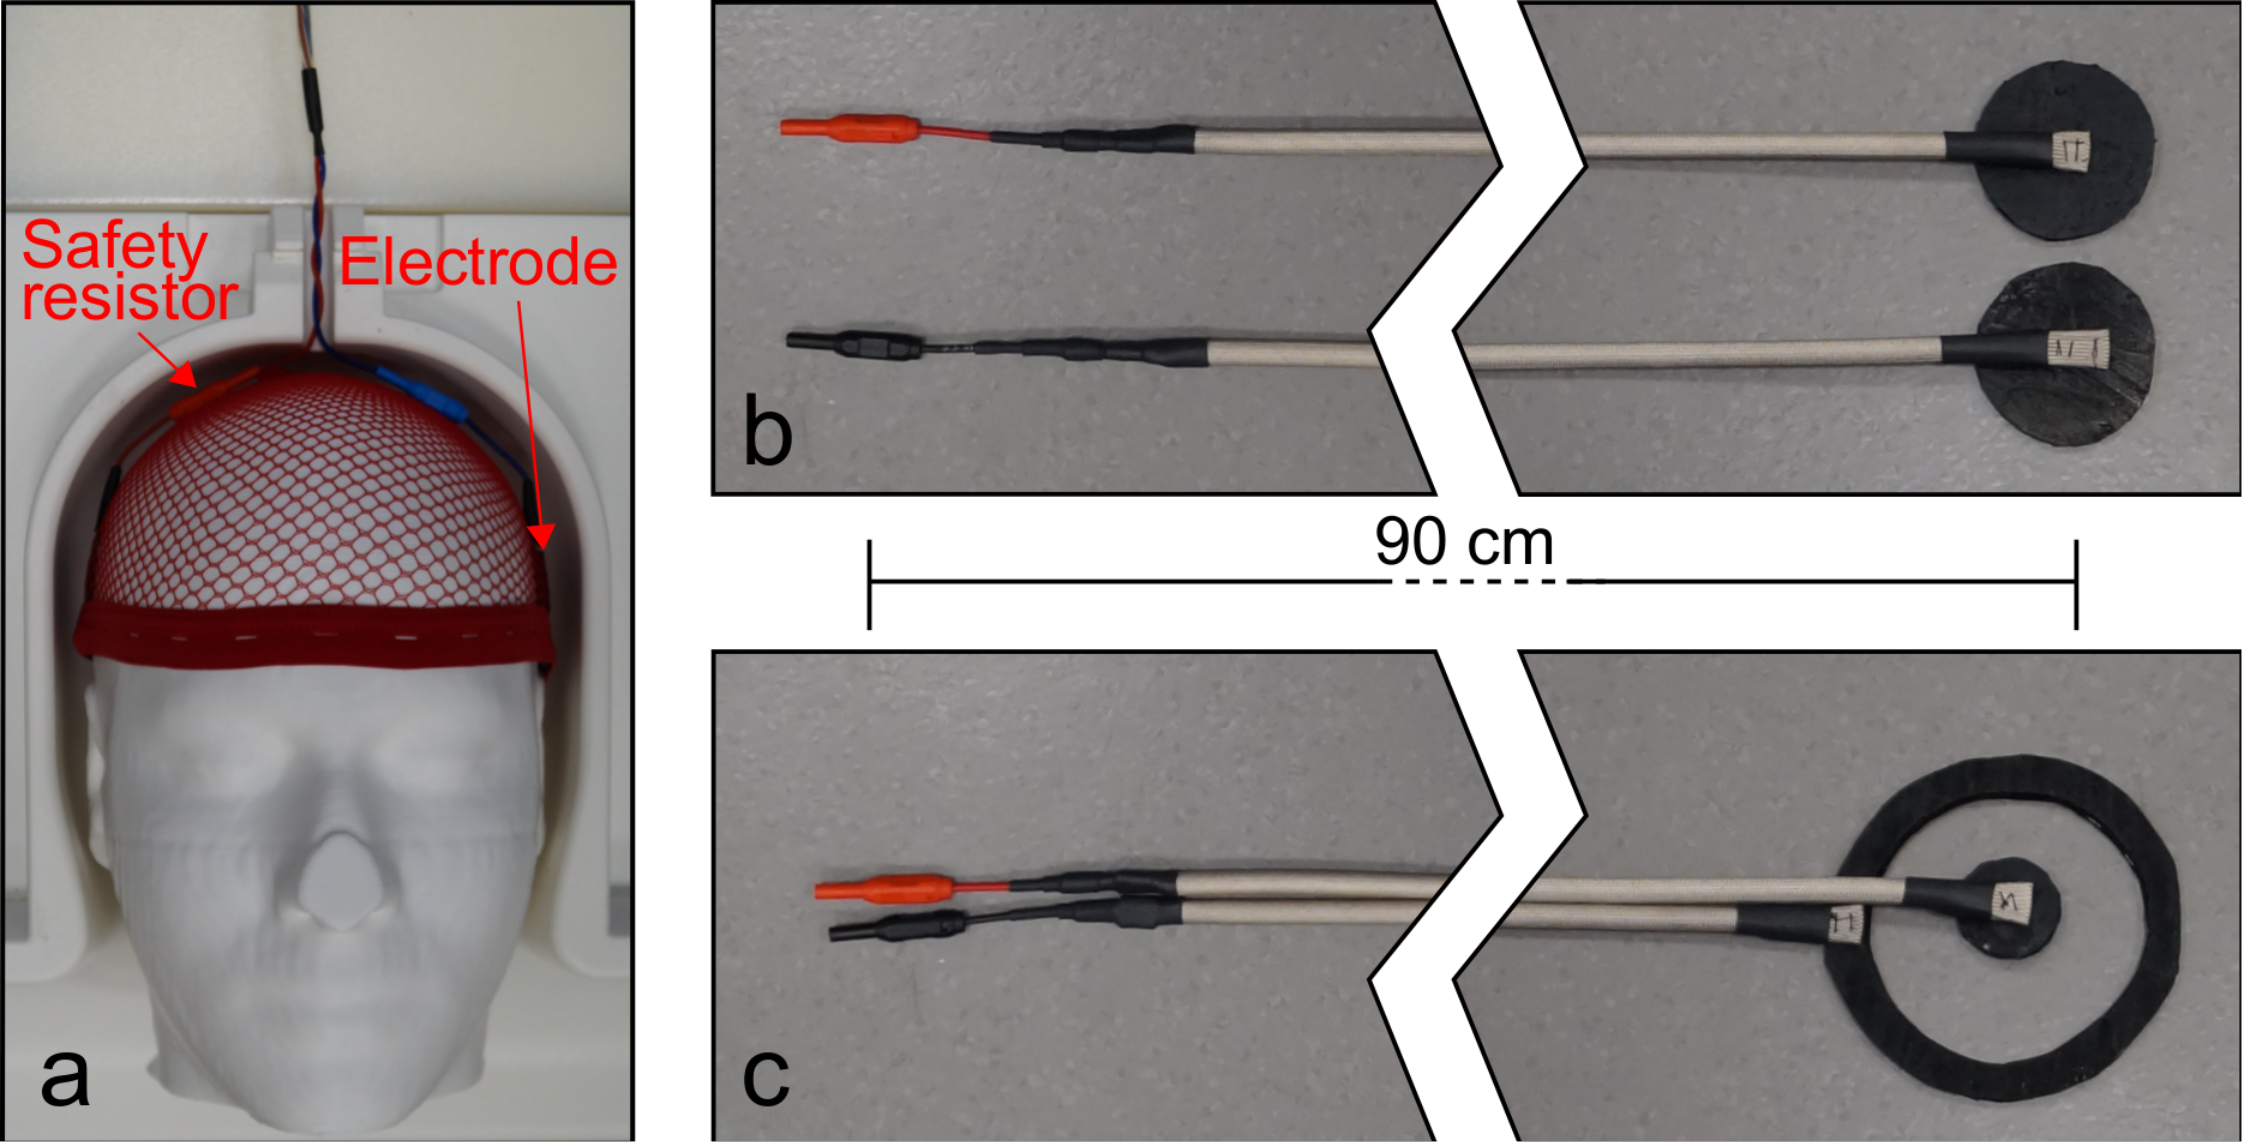
In recent years, there has been a growing interest in combined MRI and transcranial electric stimulation (TES) experiments such as TES/fMRI studies for neuroscientific research and MR current density imaging (MRCDI) to map the injected currents with MRI. Extra safety measures have to be taken when introducing high-conductivity lead wires into the MR environment1. For specific resonance conditions, coupling between the RF field of the scanner and the current injection setup can result in burns of the subject’s scalp. For the TES device most commonly used in combination with MRI (DC-STIMULATOR MR, neuroCare Group GmbH, München, Germany) the safety issues are addressed by using 5 kΩ safety resistors to shorten the highly conductive path of the leads near the head. With 30 V supply, the stimulation current is limited to under 3 mA. Additionally, the twisted leads have to exit the head coil as seen in fig. 1a. This restricts lead configuration, which is a problem for MRCDI experiments as stray magnetic fields from the leads are detrimental when measuring fields from currents inside the brain2. The aim of this work was to design new lead wires with flexible lead configurations and higher maximum currents while focusing on MR safety. Additionally, we wanted the leads to be safe at both 3T and 7T, whereas the currently available systems are not approved for 7T.Methods
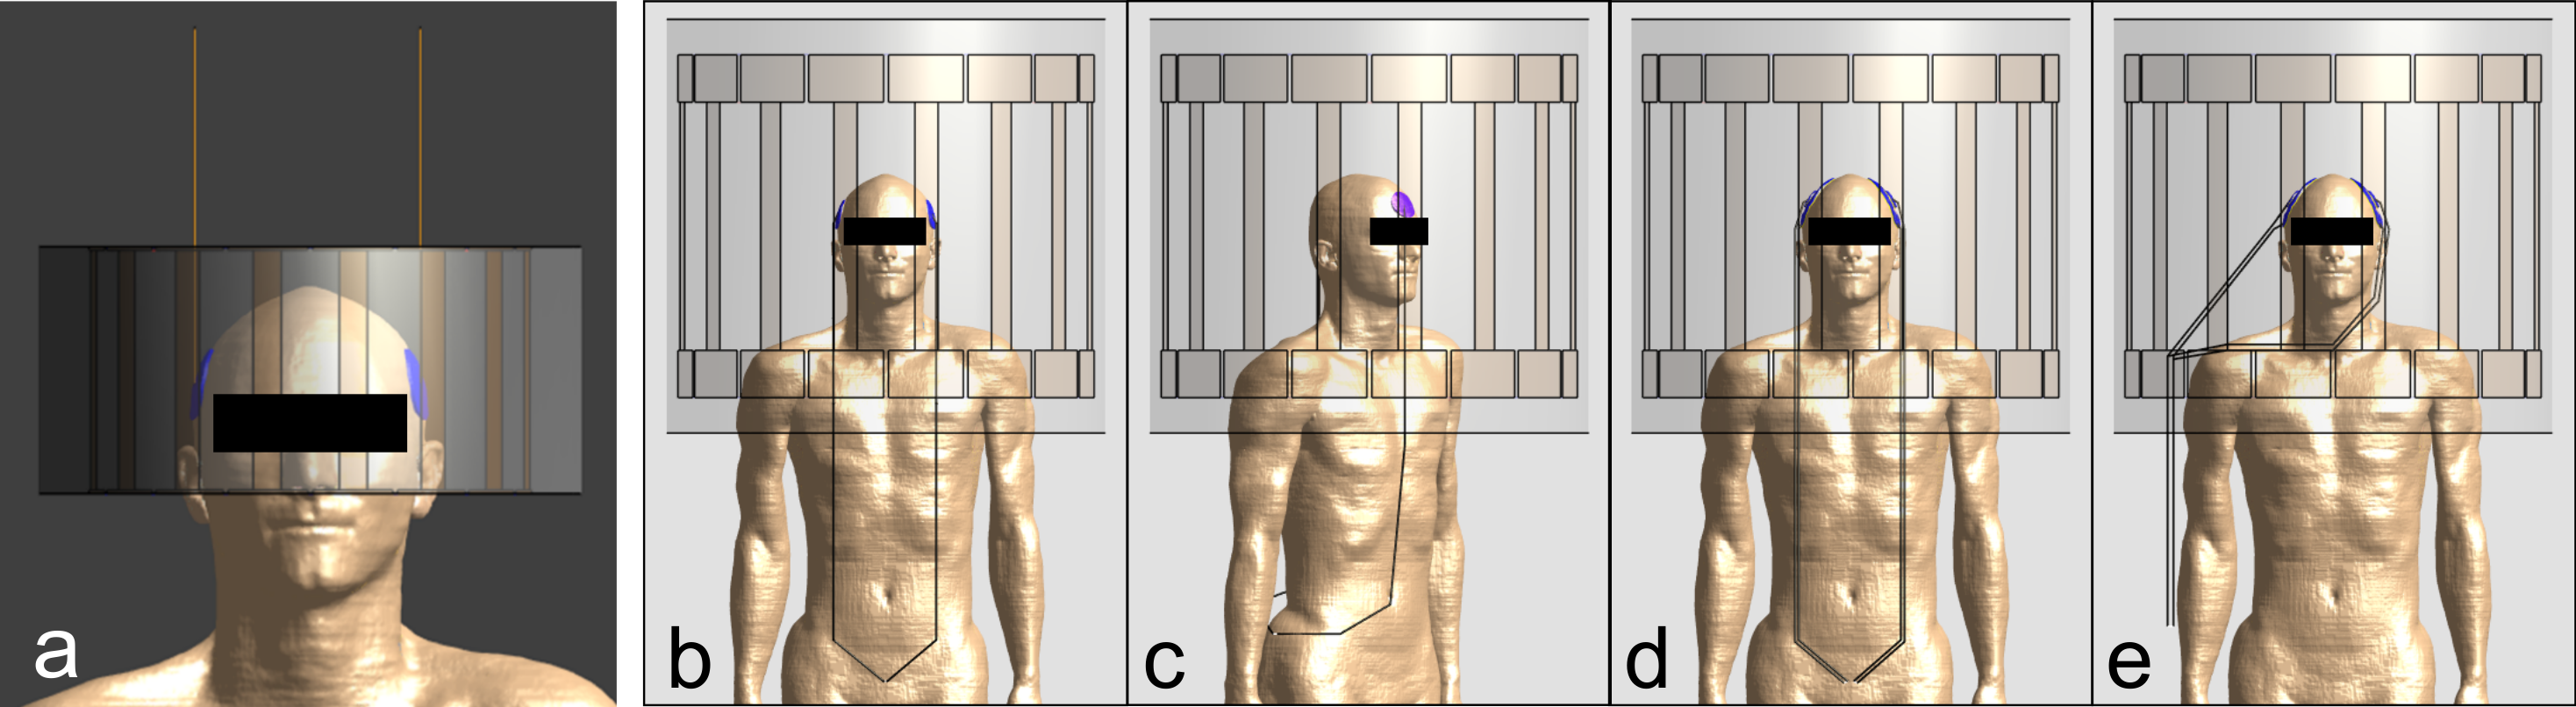
To avoid the possibility of high-amplitude standing waves we constructed new leads from carbon-doped silicone-rubber with a conductivity of 29.4 S/m (ELASTOSIL® R 570/60 RUSS, Wacker, Munich, Germany). The silicone-rubber is routinely used in the MR environment as surface electrodes for TES. We constructed two electrode types, namely circular and center-surround as seen in fig. 1b-c. The leads are 90 cm long and their cross-sectional area is 10 mm2. The resistance of each lead wire is 2 kΩ ± 200 Ω. Finite-difference time-domain (FDTD) simulations were performed in Sim4Life (ZMT, Zurich, Switzerland) for safety evaluations of the electrode and leads. The body model Duke from the IT’IS foundation was used in the simulations3. We first investigated the relationship between the conductivity of the leads and the severity of the resonant ‘antenna effect’, where standing waves caused by the RF field are formed on leads with specific lengths. These simulations were performed at 298 MHz (proton Larmor frequency at 7T). The setup is shown in fig. 2a with the high-pass birdcage head coil used for 298 MHz simulations (7T volume T/R, Nova Medical, Wilmington, MA). To find the resonance length, the lead length was varied from 0 cm to 100 cm with 10 cm increments including 25 cm and 75 cm. Simulations were also performed with the worst-case length (25 cm) with varying lead conductivity. The severity of the ‘antenna effect’ was assessed by evaluating the power loss on the electrodes. We also simulated the realistic lead configurations as shown in fig. 2b-e. This was both done at 298 MHz and 128 MHz (proton Larmor frequency at 3T). A generic body coil was used for simulations at 128 MHz (shown in fig. 2d-e). The specific absorption rate (SAR) was obtained from the FDTD simulations. Following the international guidelines IEC 60601-2-334 we evaluated the influence the electrodes and leads have on SAR by comparing head SAR and 1 g local head SAR for a reference simulation with simulations including electrodes and leads. We also performed temperature measurements with high SAR sequences to ensure compliance with international guidelines4.Results and discussions
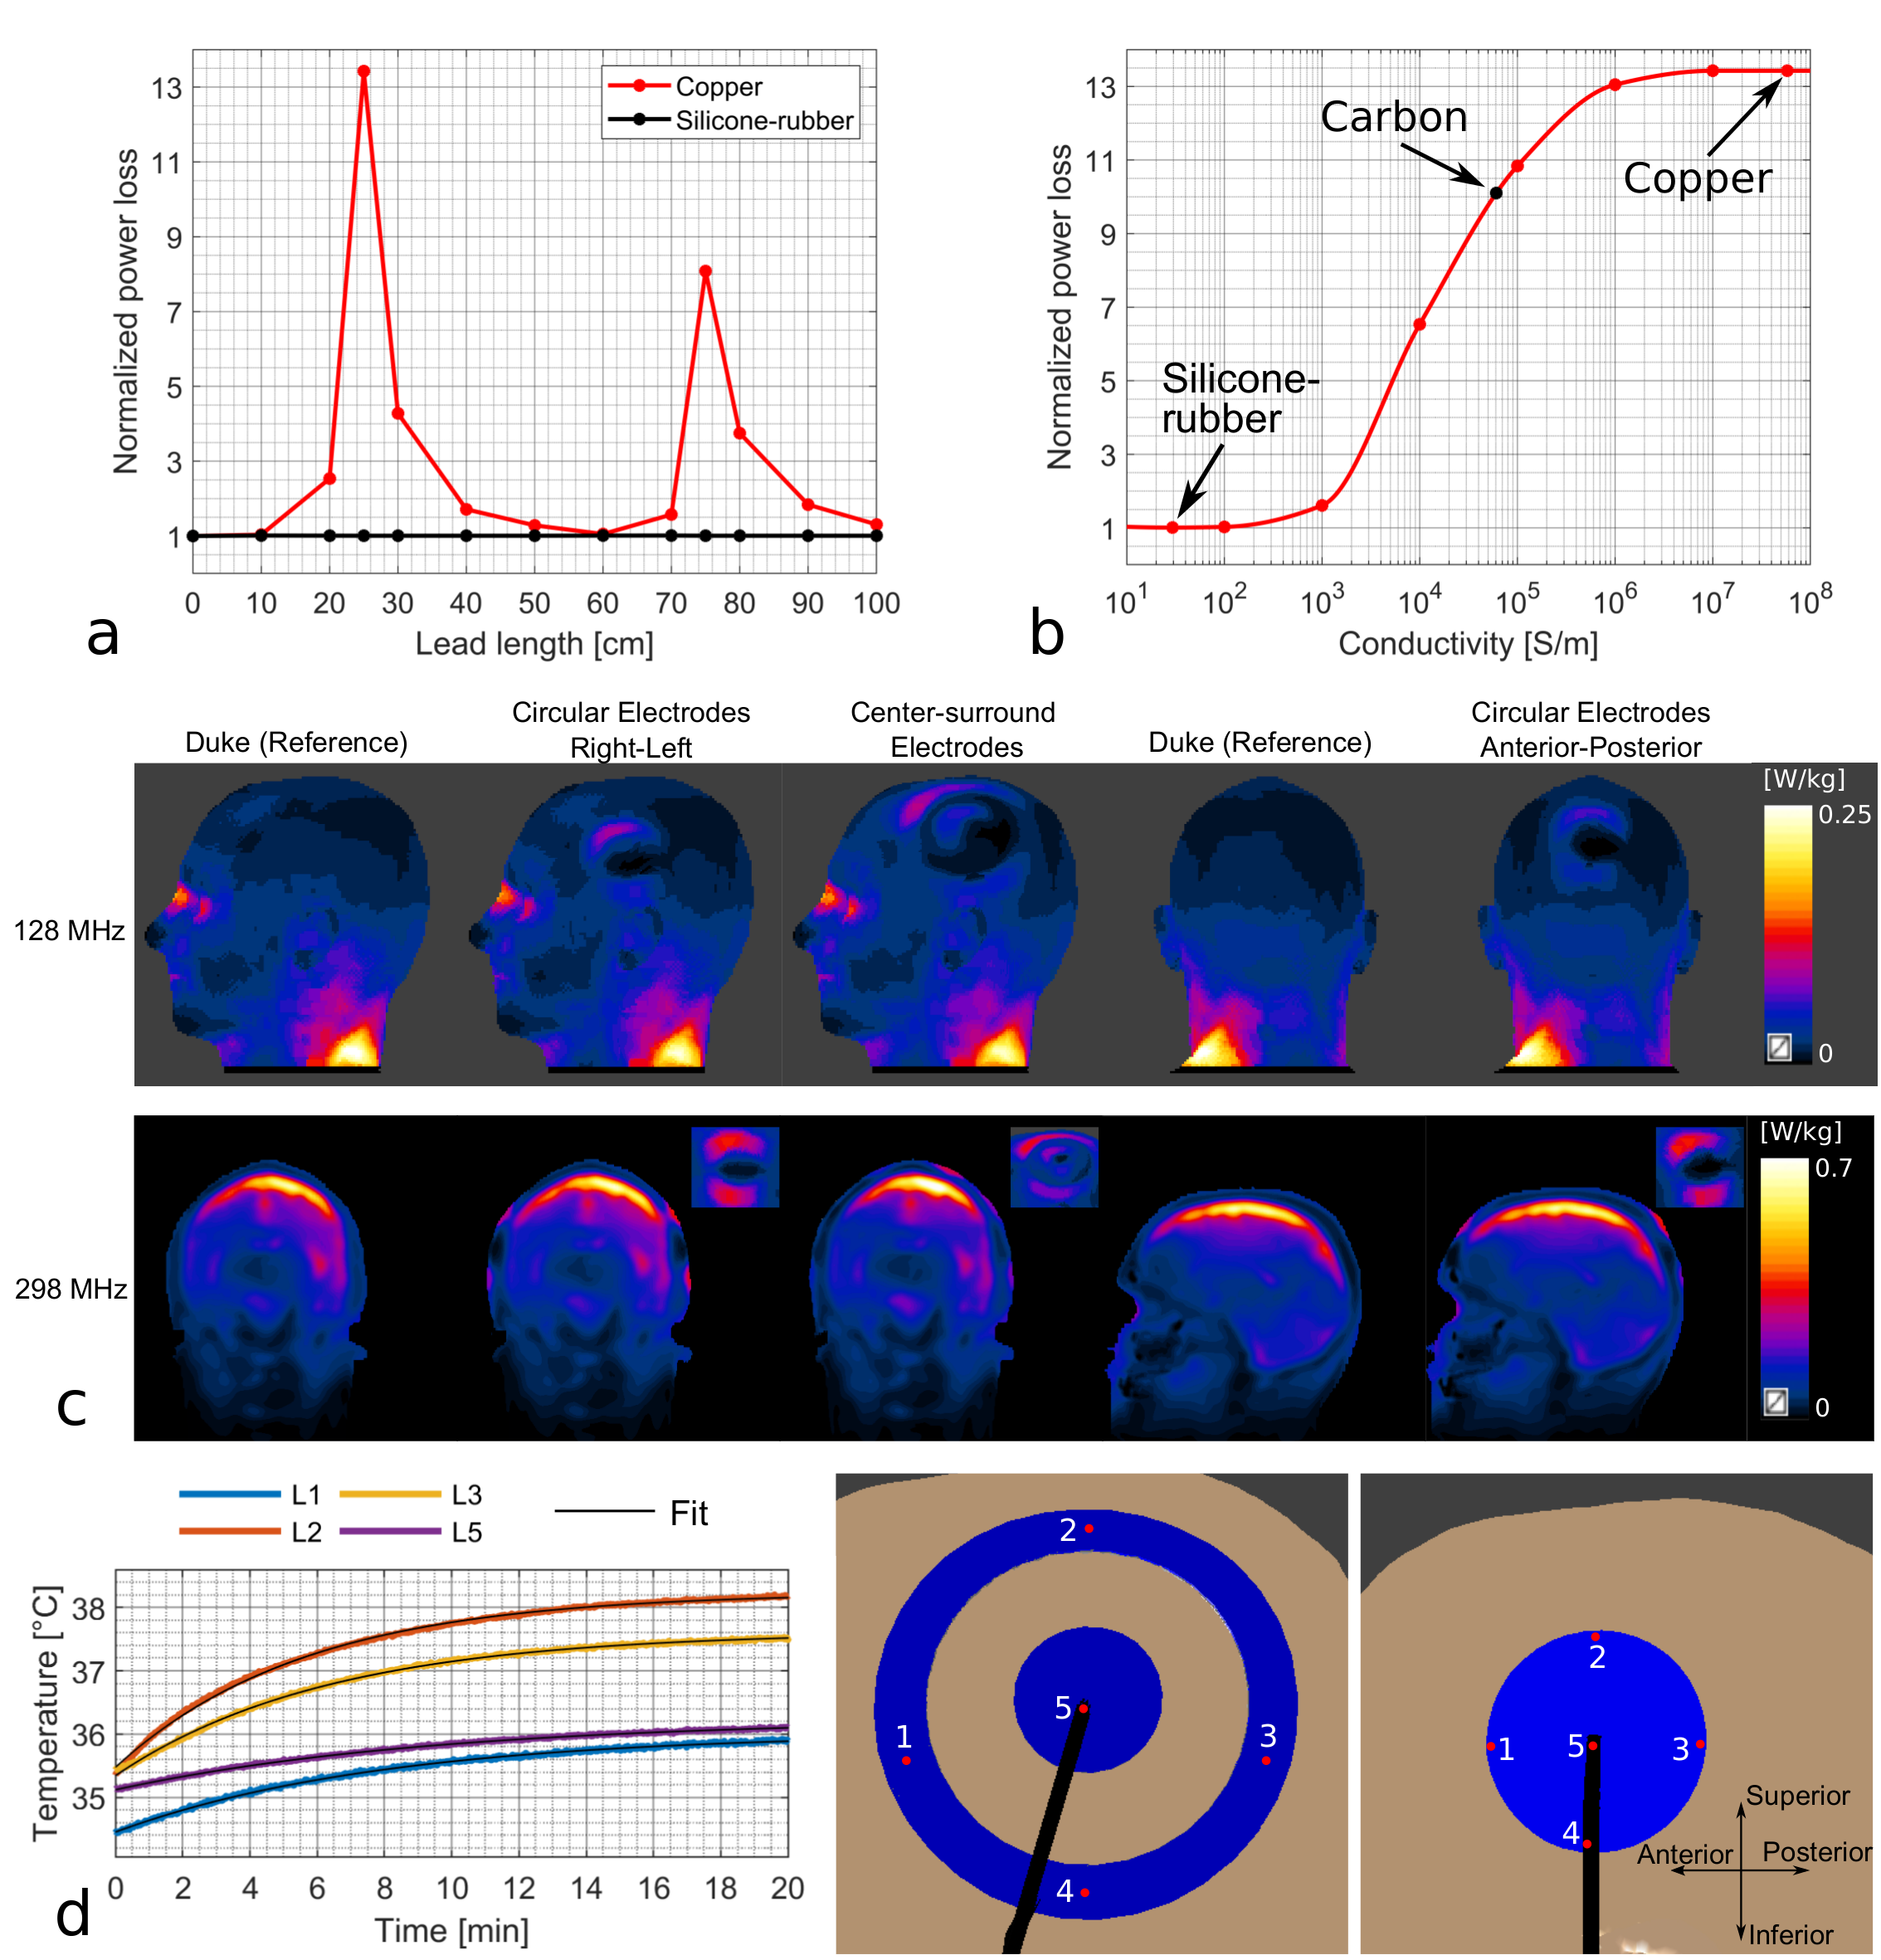
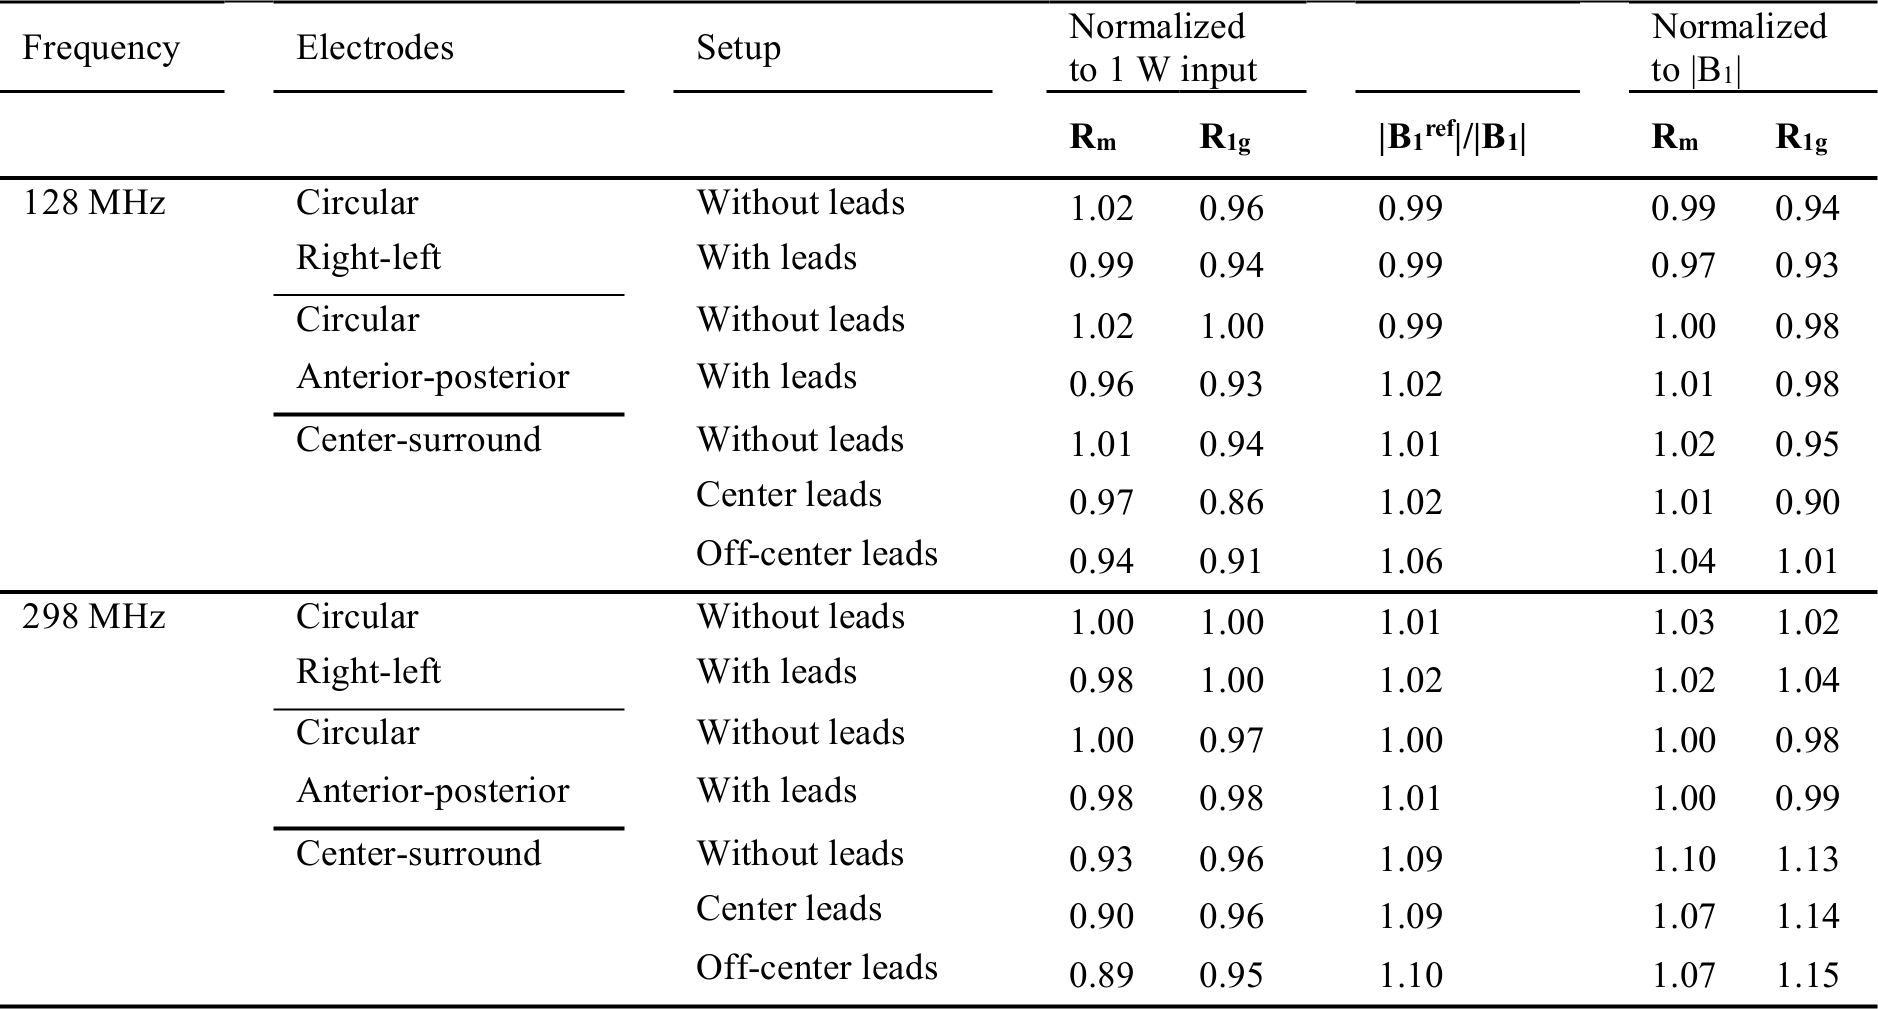
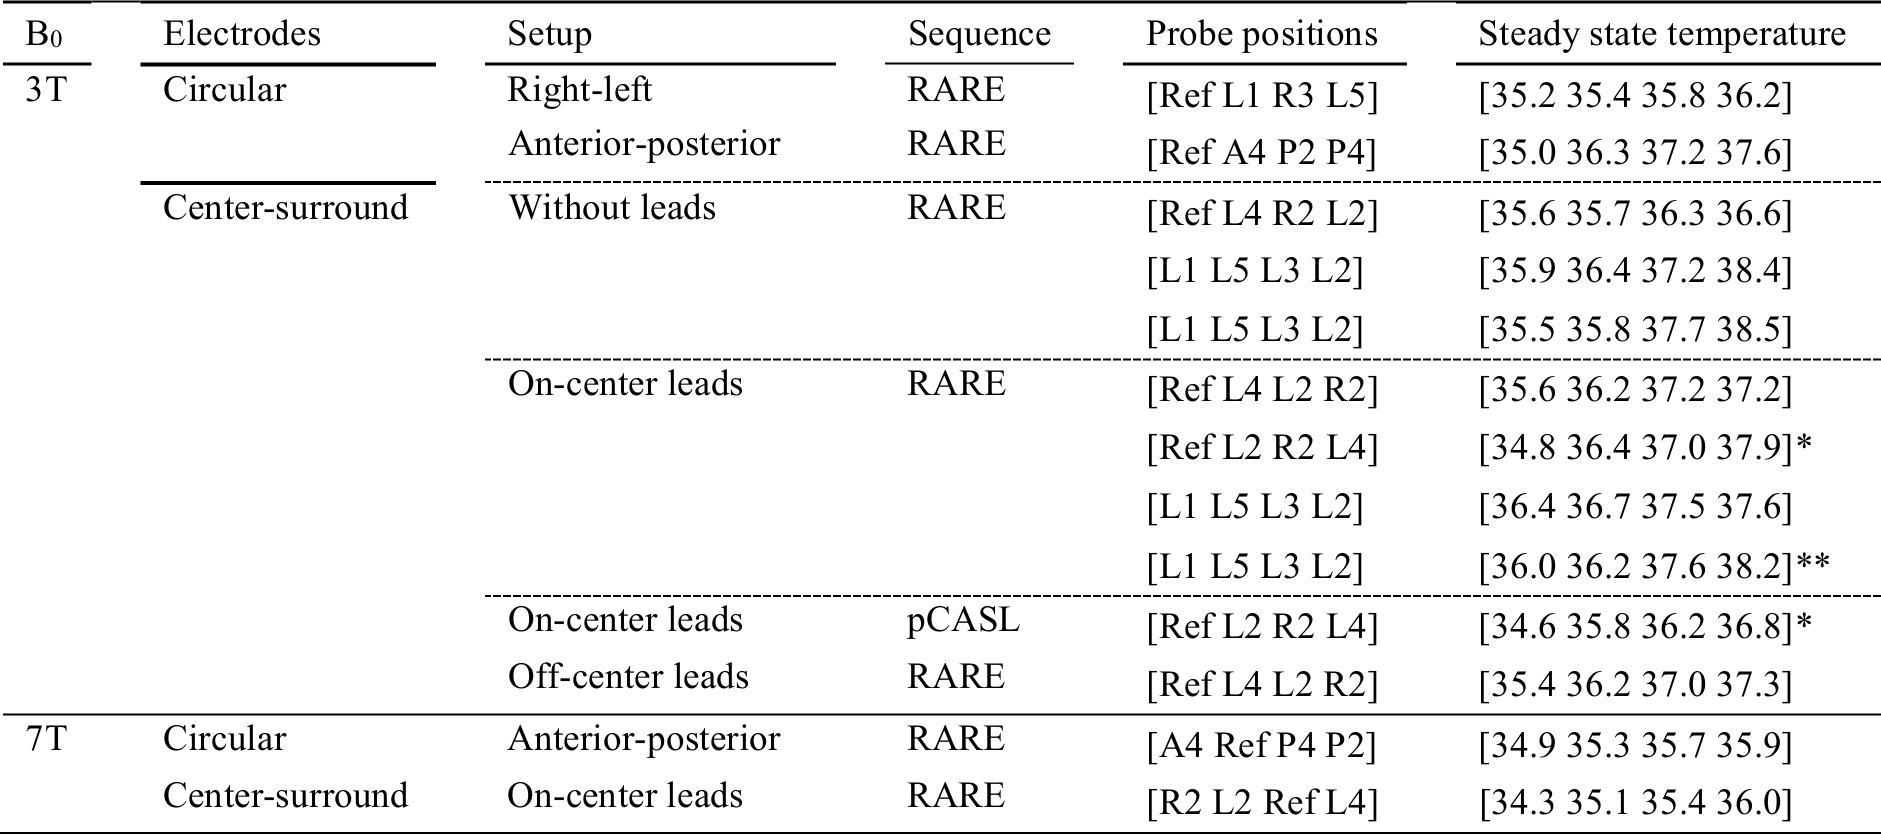
The worst-case ‘antenna effect’ was found for ¼ RF wavelength corresponding to 25 cm in air for 298 MHz simulations (fig. 3a). This is in agreement with previous experimental data5. The antenna effect is often believed to occur at integer multiples of ½ RF wavelength, but this depends on the boundary condition of the leads5. In fig 3b for varying conductivities at the worst-case length, it is clear that the antenna effect is eliminated for low-conductive materials, such as silicone-rubber. The electrodes/leads have some influence on the distribution of local SAR levels (fig. 3c), but the peak 1 g local head SAR is always in the same location as for the reference simulations. The results for each electrode type and lead configuration as shown in fig. 2b-e is presented in table 1. Rm and R1g are the ratios of head SAR and peak 1 g local head SAR for a given simulation to reference simulation. Only minimal SAR changes are observed both before and after normalization of the B1 fields. Results from temperature measurements are shown in table 2 with one example shown in fig. 3d. The numbers on the electrodes in fig. 3d indicate the positions given in table 2. More heating was observed for the center-surround electrodes, although there was no difference when the leads were attached. No heating above the guidelines of 39 °C was observed4.Conclusion
We have overcome the limitations of the commercial TES/MRI equipment by using low-conductive silicone-rubber. The elimination of the antenna effect allows for more flexible lead configurations and the lower overall impedance increases the maximum allowed stimulation current. Additionally, we have shown that the setup can safely be used at both 3T and 7T.Acknowledgements
This study was supported by the Lundbeck Foundation (grants R313-2019-622 and R244-2017-196 to AT), the Chinese National Major Scientific Equipment R&D Project (grant ZDYZ2010-2), and a PhD stipend of the Sino-Danish Center for Education and Research to FG. The authors thank Zuo Zhentao, Hasan Hüseyin Eroğlu, Vincent Boer, and Esben Thade Pedersen for kind technical help.References
1. Panych LP, Madore B. The physics of MRI safety. J Magn Reson Imaging. 2018;47(1):28-43. doi:10.1002/jmri.25761
2. Göksu C, Scheffler K, Siebner HR, Thielscher A, Hanson LG. The stray magnetic fields in Magnetic Resonance Current Density Imaging (MRCDI). Phys Medica. 2019;59(February):142-150. doi:10.1016/j.ejmp.2019.02.022
3. Gosselin MC, Neufeld E, Moser H, et al. Development of a new generation of high-resolution anatomical models for medical device evaluation: The Virtual Population 3.0. Phys Med Biol. 2014;59(18):5287-5303. doi:10.1088/0031-9155/59/18/5287
4. IEC. Particular requirements for the basic safety and essential performance of magnetic resonance equipment for medical diagnosis. IEC 60601-2-33. 2010.
5. Balasubramanian M, Wells WM, Ives JR, Britz P, Mulkern R V., Orbach DB. RF Heating of Gold Cup and Conductive Plastic Electrodes during Simultaneous EEG and MRI. Neurodiagn J. 2017;57(1):69-83. doi:10.1080/21646821.2017.1256722
Figures