2315
Parallel-transmit coil dimensions affect SAR sensitivity to motion at 7T.1Cardiff University Brain Research Imaging Centre, Cardiff, United Kingdom
Synopsis
Subject motion in parallel-transmit (pTx) causes channels’ electric field interference patterns to change, influencing SAR distributions. This can cause safety limits to be exceeded when SAR-constrained pulses are designed for one position. Here, we consider effects of pTx coil dimensions on SAR sensitivity to motion by simulating 6 differently-sized coil models, and evaluating SAR at 19 displaced positions. Our results agree with those previously reported for the similar-sized coil, but SAR sensitivity was generally lower for larger coils, and higher for smaller coils, with maximum motion-induced local-SAR increase of 3.8-fold and 1.6-fold for the smallest and largest coil models, respectively.
Introduction
Parallel transmission (pTx) can overcome B1+ inhomogeneity in 7T head imaging1-3, however specific absorption rate (SAR) hotspots and associated tissue heating can exceed safety limits when head motion occurs due to constructive interference between channels4-6. Motion-induced increases in peak local-SAR of over 200% have been reported for multi-spoke pTx pulses, along with unpredictable changes in hotspot location4.Interference patterns depend on the coil as well as the load, therefore SAR depends on coil geometry7-8. Here, we investigate whether pTx coil element dimensions affect SAR motion-sensitivity. For this, we compare motion-induced SAR changes using simulations with 6 different coils.
Methods
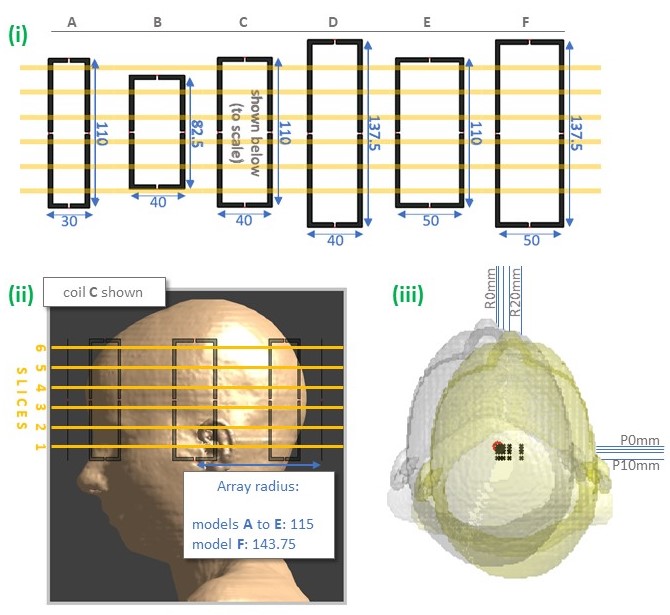
6 coil models (A: smallest, to F: largest) consisted of 8-channel loop arrays; the height, width (of loops), and radius (of array) of which varied ±25%, ±25%, and +25% respectively, compared to the base model C (figure 1). For each coil model, 1 central, and 19 off-centre positions were simulated using the Ella model9 in Sim4Life (ZMT, Zurich, Switzerland), totalling 120 datasets. SAR was reported as most sensitive to axial displacements4, so we focus on these. Simulation parameters followed those in [4]. Positions were defined with respect to the array origin across coil models.Pulses were designed to uniformly excite an axial slice in quadrature and pTx (1/2/3/5-spokes) modes (1-spoke is RF-shimming). Pulses were designed with an adaptation of [10-11] using B1-distributions at the central position for each coil. Pulses were not SAR-constrained, but RF power was penalized (along with magnitude excitation error) in the cost function (with Tikhonov regularization = 0.1). Separate pTx pulses were designed for 6 slices (figure 1), yielding 25 pulses per coil.
Motion-sensitivity was quantified as SAR at each off-centre position normalised by that at the corresponding central position (SARcentre) for each coil respectively. Whole-head (gSAR) and peak 10-gram averaged local-SAR (psSAR) were evaluated at all positions using voxelwise and 10-g average Q-matrices12 respectively. Tissue volumes exposed to higher SAR than psSARcentre are also investigated (named ‘high-SAR tissue’ here). To exclude pulse design effects, eigenvalue-based SAR (eigSAR; assumes worst-case channel interferences) was also calculated using the 10-g Q-matrices.
Results and Discussion
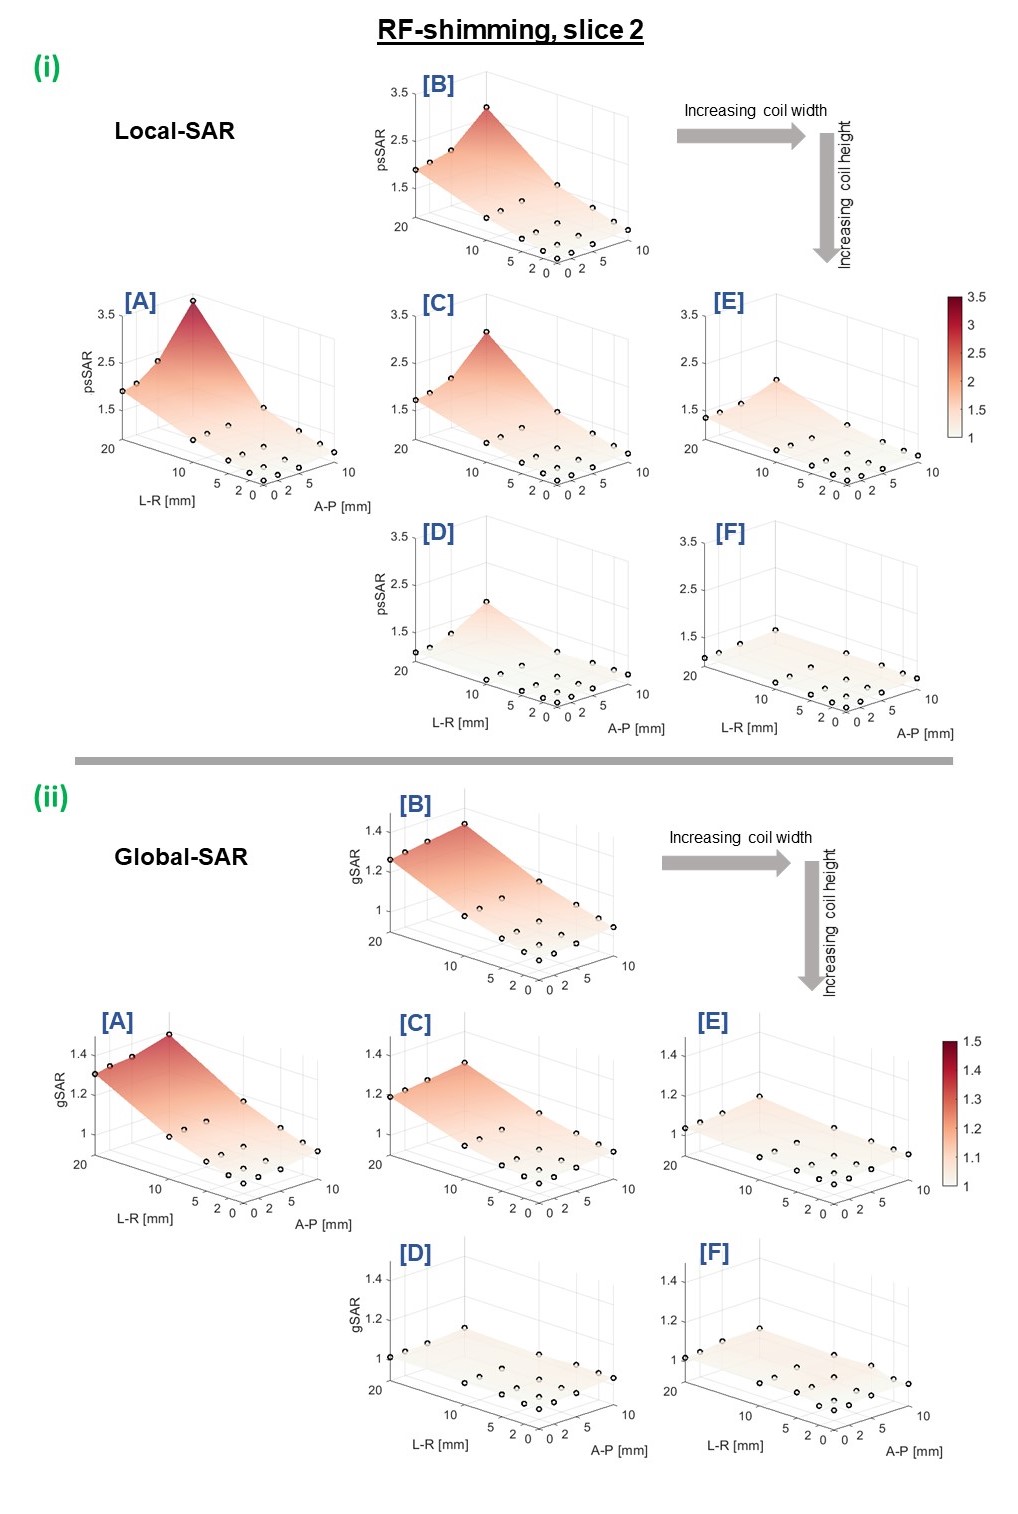
Coil C has similar dimensions to that in [4] and exhibited similar SAR-sensitivity to motion as expected (RF-shimming: 2.7 vs 2.4-fold psSAR increase). For the larger coils, psSAR sensitivity was lower; maximum increase for coil F was 1.3-fold, whereas for the smallest coil (A) we observed a much higher local-SAR increase of 3.8-fold. Similarly, coil C’s eigSAR increased up to 43%, matching previous findings4, however eigSAR was more motion-sensitive among smaller coil models (especially to posterior shifts) where it increased by 72%.For pTx pulses, gSAR increased by up to 38% and 49% for RF-shim and multi-spoke pulses, respectively (both coil A). psSAR for RF-shimming was the most motion-sensitive metric, and was especially sensitive among smaller coils. psSAR increased by 3.8-fold, 1.7-fold, and 1.3-fold in the worst RF-shim case for coils A, D, and F, respectively. Figure 2 shows RF-shim SAR-sensitivity for a representative slice (slices 2-5 showed similar patterns, while 1 and 6 did not - discussed later).
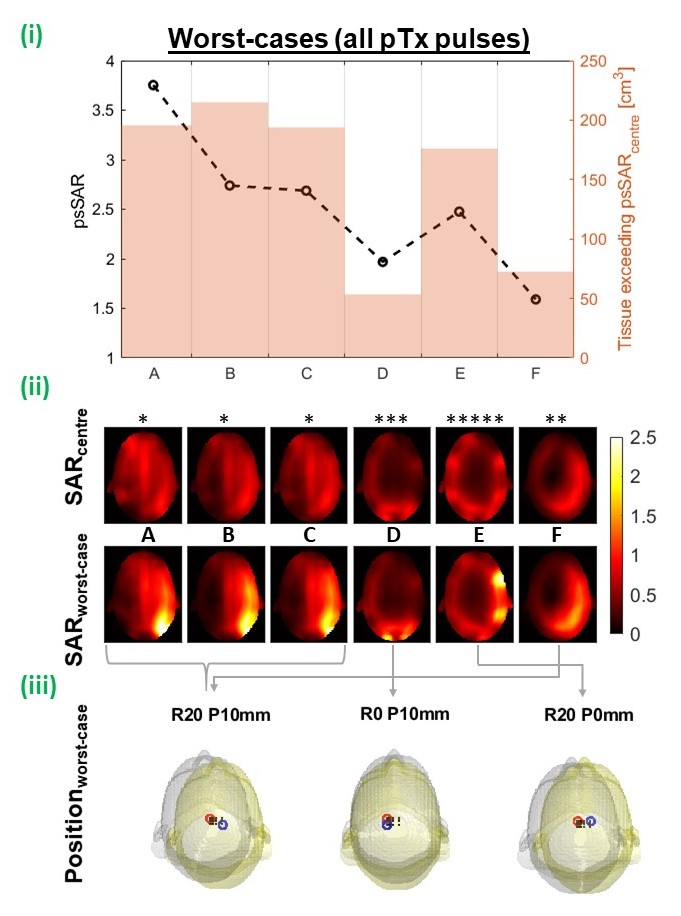
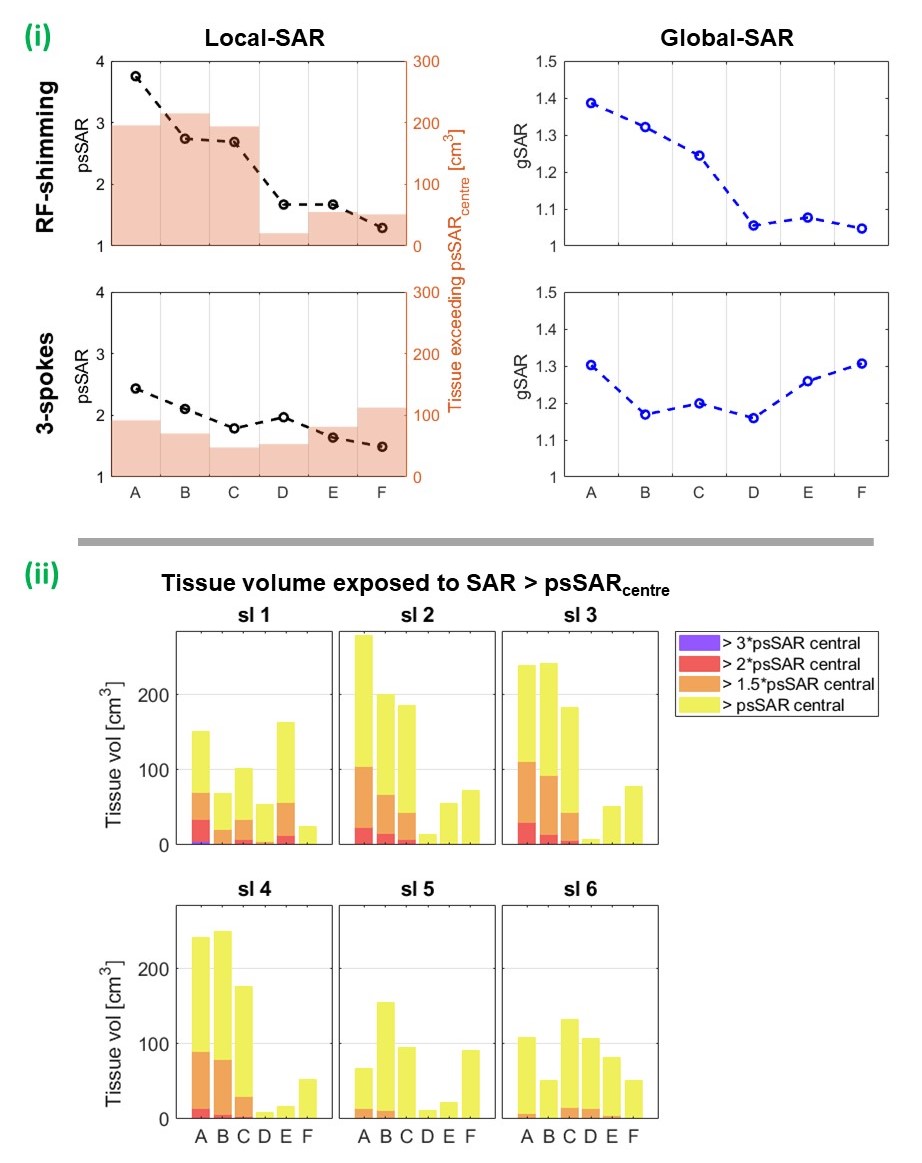
Figure 3 shows coils’ worst-cases across all pTx (including RF-shim) pulses. psSAR sensitivity and high-SAR tissue was lowest for the taller coil models, where psSAR increased by a maximum of 96% and 59% for coils D and F. As the number of spokes in pulses increases, SAR-sensitivity generally reduced and became more similar across coil models (figure 4.i), however the three largest coil models’ worst-cases were multi-spoke pulses. Worst-cases per slice show that coils D-F yielded less high-SAR tissue than smaller coils throughout the central slices (figure 4.ii).
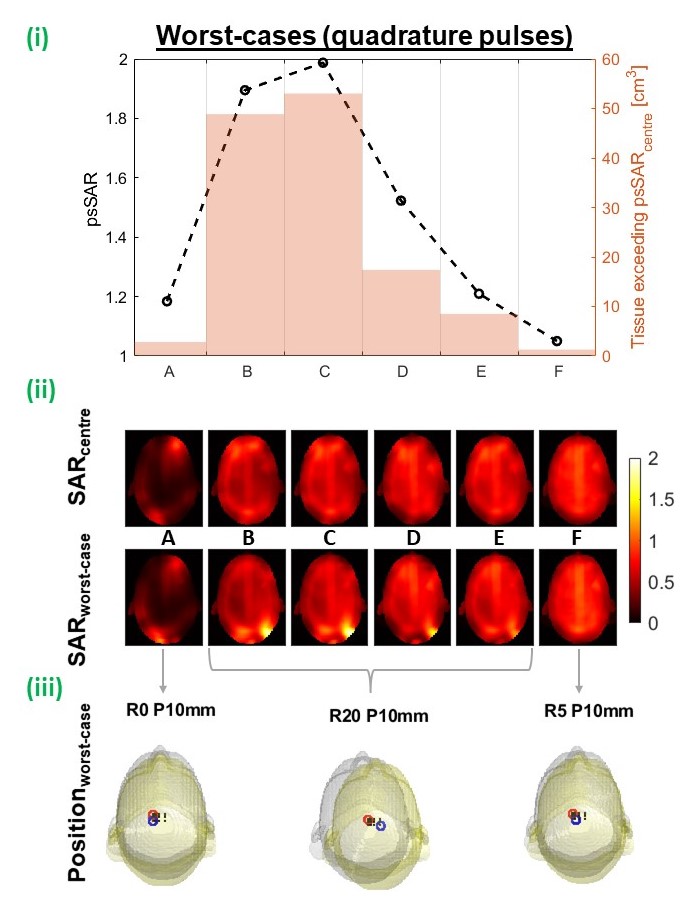
For quadrature pulses, gSAR was relatively stable, increasing by less than 5% (coil A). psSAR was most sensitive for coil C where it almost doubled, while psSAR for coils A and E increased by 18% and 5%, respectively (figure 5). Unlike pTx, in all quadrature worst-cases, the local-hotspot shifted from the front to back of the head. Even without motion, coil A experienced intense local-hotspots, meaning psSAR change was low when the hotspot shifted but retained similar intensity. For large coils, fields were smoother throughout the head, leading to less intense hotspots even after motion. Coil C did not exhibit either behaviour, hence the largest relative increase.
SARcentre (not shown) was higher when pulses were designed using slices 1 and 6. This is less concerning than motion-sensitivity of SAR, as SARcentre can be constrained during pulse design. For coil B, these slices fell beyond the loops’ vertical extent, and motion-sensitivity was notably lower than other slices (though psSARcentre was around threefold). For 14% of pulses, worst-case psSAR occurred at intermediate positions (ie. not the extremes). These pulses were for larger coils and/or slices 5 and 6, where psSAR sensitivity was lower.
Conclusions
SAR for smaller pTx coils was generally more motion-sensitive than that for larger coils (wider or taller loops, and/or larger array radius). Maximum observed local-SAR increases due to motion were 3.8-fold and 1.6-fold for the smallest and largest coil models respectively. This is independent of pulse design, since eigenvalue-based SAR (which depends only on transmit fields) followed this pattern; however pTx pulses with small coils elicit the most concerning local-SAR increases.Acknowledgements
No acknowledgement found.References
[1] J. Vaughan, et al., 7T vs. 4T: RF power, homogeneity, and signal-to-noise comparison in head images. Mag Res Med,64 (1), pp. 24–30, 2001.
[2] U. Katscher and P. Bornert, Parallel RF transmission in MRI. NMR Biomed,19 (3), pp. 393–400, 2006.
[3] C. M. Deniz, Parallel transmission for ultrahigh field MRI. Topics in Mag Res Imag,28 (3), pp. 159–171, 2019.
[4] E. Kopanoglu, et al., Specific absorption rate implications of within-scan patient head motion for ultra-high field MRI. Mag Res Med, 2020.
[5] S. Wolf, et al., SAR simulations for high-field MRI: How much detail, effort, and accuracy is needed? Mag Res Med, 69 (4), pp. 1157–1168, 2013.
[6] N. Schon, et al., Impact of respiration on B1+ field and SAR distribution at 7T using a novel EM simulation setup. Proc. Intl. Soc. Mag. Reson. Med., 28, 2020.
[7] U. Katscher, et al., Basic considerations on the impact of the coil array on the performance of transmit sense. Mag Res Mat Phys Biol Med, 18 (2), pp. 81–88, 2005.
[8] C. M. Deniz, et al., Radiofrequency energy deposition and radiofrequency power requirements in parallel transmission with increasing distance from the coil to the sample. Mag Res Med, 75 (1), pp. 423–432, 2016.
[9] M-C. Gosselin, et al., Development of a new generation of high-resolution anatomical models for medical device evaluation: The virtual population 3.0. Phys Med Bio, 59 (18), pp. 5287–5303, 2014.
[10] W. Grissom, et al. Spatial domain method for the design of RF pulses in multicoil parallel excitation. Magnetic Resonance in Medicine, 56, 620–629, 2006.
[11] ISMRM RF Pulse-design Challenge. http://challenge.ismrm.org/. 2016.
[12] I. Graesslin, et al., A specific absorption rate prediction concept for parallel transmission MR. Mag Res Med, 68 (5), pp. 1664–1674, 2012.
Figures