2304
Validation of a Temperature Prediction Workflow for Imaging Complete Deep Brain Stimulation Systems
Alireza Sadeghi-Tarakameh1, Nur Izzati Huda Zulkarnain1, Noam Harel1, and Yigitcan Eryaman1
1Center for Magnetic Resonance Research (CMRR), University of Minnesota, Minneapolis, MN, United States
1Center for Magnetic Resonance Research (CMRR), University of Minnesota, Minneapolis, MN, United States
Synopsis
We validate a previously proposed temperature prediction workflow for a complete DBS Systems undergoing MRI. Accuracy of the workflow is investigated for different termination conditions using an extension cable and an implantable pulse generator (IPG) device. The workflow accurately predicted the temperature time-course during the MRI scan for different trajectories and terminations.
Introduction
RF heating of DBS electrodes is a patient safety problem in MRI.1 The heating depends on various factors such as electrode geometry, trajectory, transmit coil, and patient anatomy.Recently, complex realistic models were studied using full-wave EM simulations.2-4 Despite the valuable insight they provided regarding the impact of different factors on DBS heating, results are difficult to validate experimentally. Furthermore, significant computational time and resources need to be allocated for these simulations. Transfer function-based models and modified transmission line method have also been proposed,5-8 requiring less computational power and time. However, their accuracy has not been investigated for non-homogeneous tissues. Additionally, the electric field’s component tangential to the electrode is needed, which is usually not known in advance. Animal studies also have been conducted,9 which provide useful information regarding the impact of tissue inhomogeneity and blood perfusion on the heating problem. However, since the lead trajectories vary from subject to subject, they are not necessarily useful for predicting the outcome of RF heating in an individual patient. Therefore, patient-specific safety assessment is still an unmet medical need for patients with DBS electrodes.
In our recent work,10 we proposed a workflow for predicting RF heating at the contact points of commercial DBS electrodes. This workflow is based on the hypothesis that the current flowing on the shaft (near the tip) is linearly proportional to the charge density on the contact (consequently, the voltage). The ratio between the contact voltage and shaft current is defined as an equivalent transimpedance and assumed to be independent of the electrode trajectory as well as its length and termination. We previously validated this assumption for a single electrode by employing various electrode trajectories.
In this work, we expand our validation studies further to clinically relevant scenarios, where;
1) An extension cable is attached and terminated by a plastic protective boot at the distal end.
2) Electrode is connected to an implantable pulse generator (IPG) with the extension cable, forming a complete DBS system.
Methods
To validate the previously proposed workflow10 (Fig. 1a), we examined five cases with different electrode trajectories, lengths, terminations, and RF power exposures (Fig. 2). We completed the workflow in two phases as proposed: 1. Offline calibration, 2. Temperature prediction. In phase 1, we used case#1 (Fig.2a) for the calibration purpose. We used a commercial electrode (directional lead, Infinity DBS system, Abbott Laboratories) terminated by the protective boot and immersed into a uniform phantom. We exposed it to RF energy in a 3T MR scanner (Prisma, Siemens), using a turbo spin-echo (TSE) pulse sequence (FA=150°, TR=6000ms, Echo train length=15). Then, we measured the temperature at a single contact at the tip of the electrode using a fiber optic temperature probe (Lumasense Technologies). Also, we measured the induced current on the shaft of the electrode (Is) at a pre-determined distance from the tip11 by measuring the distance between the DBS-lead and Tx-null in a 3D-GRE image (TR/TE=20/2.64ms, in-plane resolution=0.5mm, slice thickness=3mm) and utilizing the incident B1 value averaged over a 30×30mm2-square surrounds the electrode on a plane beneath the electrode’s tip. Then we attempted to approximate the measured heating curve with our EM/thermal model. We used a simple quasi-static EM model (Sim4Life) to compute the SAR distribution around the electrode contacts. This distribution is then used as an input to the thermal simulation to generate temperature progression curves. In the quasi-static EM model, the contact(s) are assigned a constant voltage (Vc) boundary condition. The voltage is adjusted iteratively until the simulated and measured temperature curves are matched. Once the match is achieved, the ratio between voltage Vc and the induced current on the shaft is calculated and defined as an equivalent transimpedance (Req), which is assumed to be independent of the electrode trajectory, length, termination, and RF power level.In phase 2, we experimented with the set-ups shown in Fig 2b-e using the same phantom. We measured the temperature at the contact and measured Is for each case. We also computed the SAR around the contact by imposing a voltage boundary condition Vc (i.e., determined using the Req and measured Is) in the quasi-static EM simulation model. Finally, we calculated the contact temperature and compared the simulated and measured temperature curves for four different cases.
Results
Fig. 3 shows the GRE images used for MR-based current measurement.11 The measured Is in case#1 and the calibrated Vc are used to calculate the Req, which is determined as 155Ω.Table 1 shows some essential parameters for each case, including the calculated Vc’s.
As shown in Fig. 4, we observed a quantitative match between simulated and measured temperature curves for all cases (RMSE≤0.15°C).
Discussion
The current flowing at the electrode's shaft (close to the tip) is linearly proportional to the charge density on the contact (consequently, the voltage). This proportionality is experimentally shown to be independent of the electrode trajectory, length, termination, and RF power level.Conclusion
We validated a workflow consisting of a simple quasi-static EM model and a thermal simulation model for predicting temperature around a commercial DBS electrode. The workflow predicted the heating at the electrode’s contact accurately in the presence of an extension cable and an IPG.Acknowledgements
This work was supported by the following grant: NIBIB P41 EB027061, NINDS R01NS115180, and devices were donated by Abbott Neuromodulation.References
- Henderson JM, Tkach J, Phillips M, Baker K, Shellock FG, Rezai AR. Permanent neurological deficit related to magnetic resonance imaging in a patient with implanted deep brain stimulation electrodes for Parkinson’s disease: case report. Neurosurgery 2005;57(5):E1063; discussion E63 doi: 10.1227/01.neu.0000180810.16964.3e[published Online First: Epub Date]|.
- Guerin B, Iacono MI, Davids M, Dougherty D, Angelone LM, Wald LL. The ‘virtual DBS population’: five realistic computational models of deep brain stimulation patients for electromagnetic MR safety studies. Phys Med Biol 2019;64(3):035021 doi: 10.1088/1361-6560/aafce8[published Online First: Epub Date]|.
- Guerin B, Serano P, Iacono MI, et al. Realistic modeling of deep brain stimulation implants for electromagnetic MRI safety studies. Phys Med Biol 2018;63(9):095015 doi: 10.1088/1361-6560/aabd50[published Online First: Epub Date]|.
- Golestanirad L, Angelone LM, Iacono MI, Katnani H, Wald LL, Bonmassar G. Local SAR near deep brain stimulation (DBS) electrodes at 64 and 127 MHz: A simulation study of the effect of extracranial loops. Magn Reson Med 2017;78(4):1558-65 doi: 10.1002/mrm.26535[published Online First: Epub Date]|.
- Tokaya JP, Raaijmakers AJE, Luijten PR, Bakker JF, van den Berg CAT. MRI-based transfer function determination for the assessment of implant safety. Magn Reson Med 2017;78(6):2449-59 doi: 10.1002/mrm.26613[published Online First: Epub Date]|.
- Tokaya JP, Raaijmakers AJE, Luijten PR, van den Berg CAT. MRI-based, wireless determination of the transfer function of a linear implant: Introduction of the transfer matrix. Magn Reson Med 2018;80(6):2771-84 doi: 10.1002/mrm.27218[published Online First: Epub Date]|.
- Acikel V, Atalar E. Modeling of radio-frequency induced currents on lead wires during MR imaging using a modified transmission line method. Med Phys 2011;38(12):6623-32 doi: 10.1118/1.3662865[published Online First: Epub Date]|.
- Acikel V, Uslubas A, Atalar E. Modeling of electrodes and implantable pulse generator cases for the analysis of implant tip heating under MR imaging. Med Phys 2015;42(7):3922-31 doi: 10.1118/1.4921019[published Online First: Epub Date]|.
- Shrivastava D, Abosch A, Hughes J, et al. heating induced near deep brain stimulation lead electrodes during magnetic resonance imaging with a 3 T transceive volume head coil. Phys Med Biol 2012;57(17):5651-65 doi: 10.1088/0031-9155/57/17/5651[published Online First: Epub Date]|.
- Sadeghi-Tarakameh A, Harel N, Atalar E, Eryaman Y. A temperature prediction workflow for DBS electrodes undergoing MRI. In proceeding of the 28th Virtual Annual Meeting of ISMRM 2020. Abstract 4181.
- Eryaman Y, Kobayashi N, Moen S, et al. A simple geometric analysis method for measuring and mitigating RF induced currents on Deep Brain Stimulation leads by multichannel transmission/reception. Neuroimage 2019;184:658-68 doi: 10.1016/j.neuroimage.2018.09.072[published Online First: Epub Date]|.
Figures
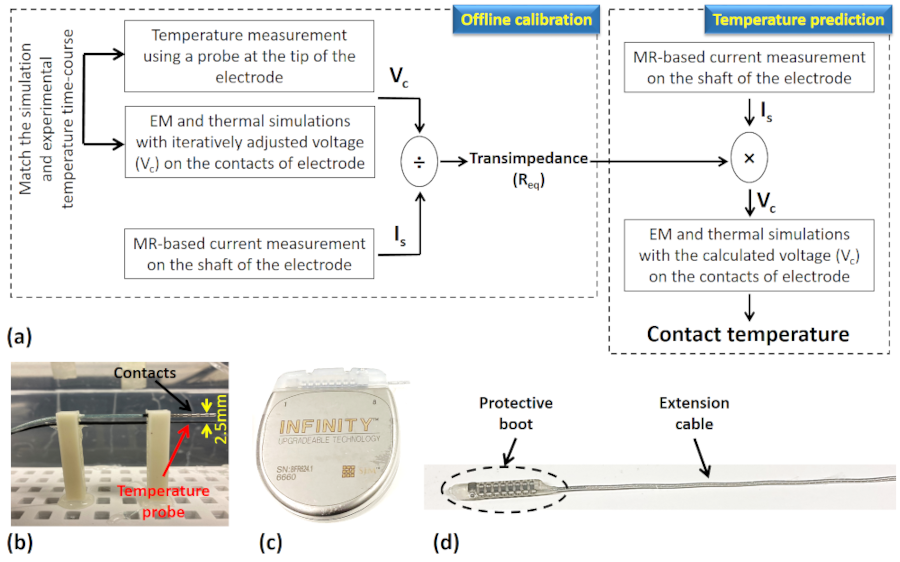
Figure 1. Workflow and the experimental
set-up for predicting RF heating at the contact points of commercial DBS
electrodes due to RF exposure in MRI. (a) Phase 1: Offline calibration to
determine the Req. Phase 2: Temperature prediction. (b) Position of
the temperature probe around the contacts of the DBS electrode. (c) The
commercial IPG device used in the experiments. (d) The extension cable with a
protective boot.
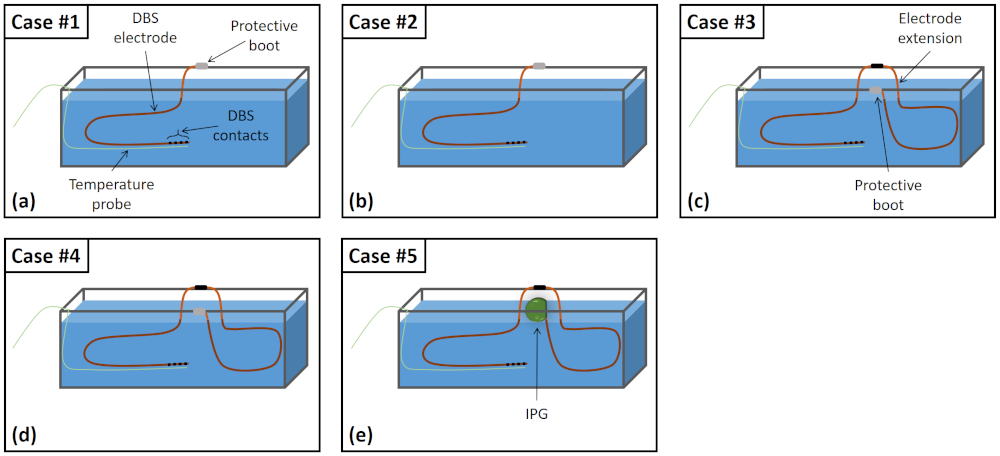
Figure 2. Five experimental
set-ups used for calibration and validation. (a) Case #1 (calibration):
electrode + protective boot @ 2.8µT,
(b) Case #2: electrode + protective boot @ 3.2µT, (c) Case #3: electrode + extension cable + protective
boot @ 2.8µT, (d)
Case #4: electrode + extension cable + protective boot @ 3.8µT, (e) Case #5: electrode + extension cable +
IPG @ 3.8µT.
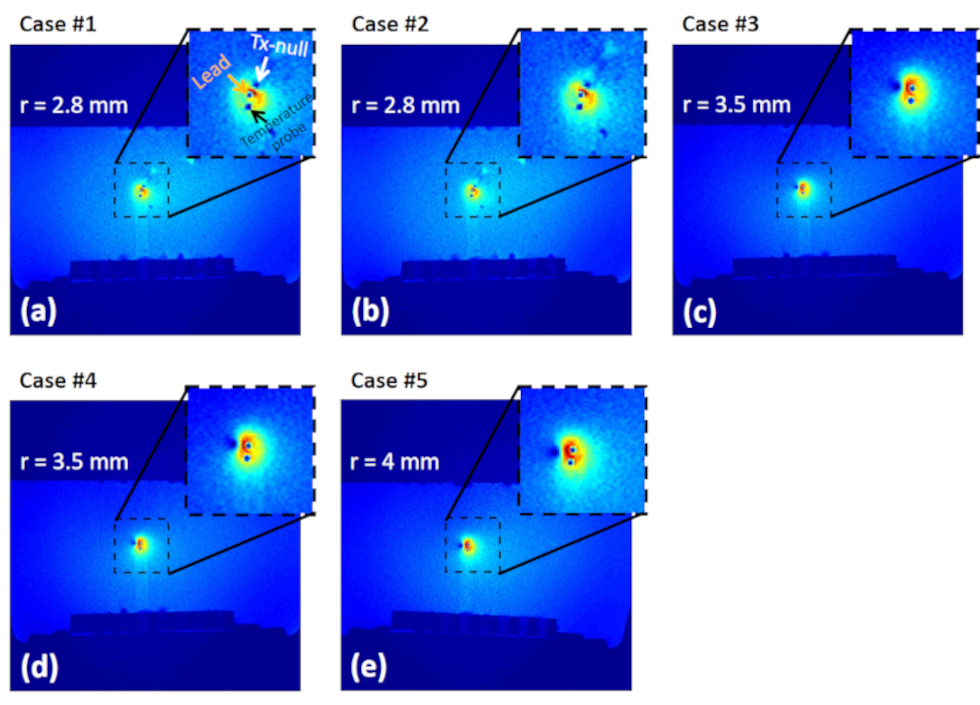
Figure 3. GRE images
(TR/TE=20/2.64ms, in-plane resolution=0.5mm, slice thickness=3mm), which are
used to determine the current flows on the DBS lead contacts. Note that the
Tx-null’s location strictly depends on the RF induced current and the body
coil’s transmit field. Distances between the lead and Tx-nulls corresponding to
each trajectory are marked on the images.
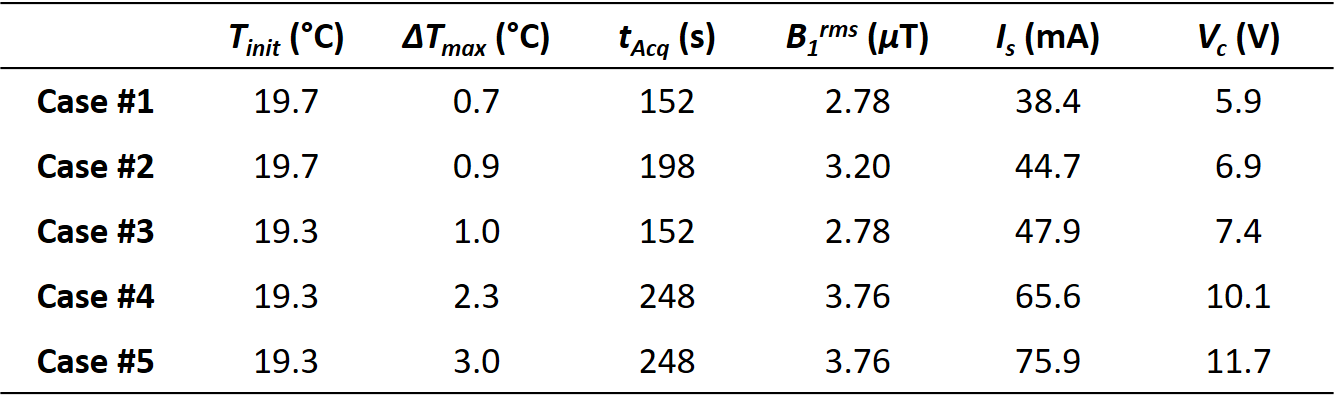
Table 1. Essential parameters corresponding to each of the
five cases. Tinit: the temperature at the beginning of the TSE
sequence. ΔTmax: maximum of the temperature-rise during the TSE
sequence. tAcq: duration of the TSE sequence. B1rms:
RMS values of the incident B1 averaged in a 30x30mm2 ROI at
a slice right below the tip of the electrode. Is: current on the
shaft of the electrode measured using the GRE sequence. Vc: Voltage
boundary condition on the electrode’s contact used for the EM/thermal
simulation.
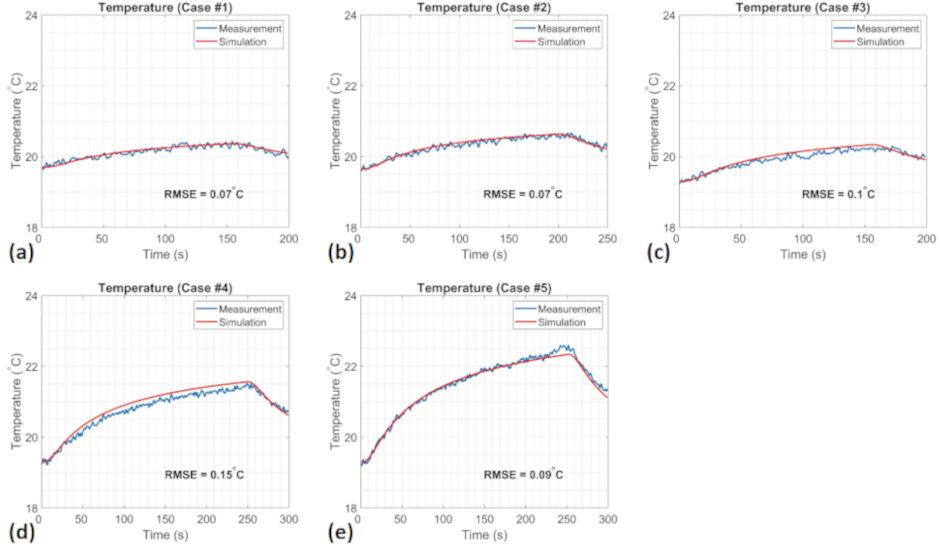
Figure 4. Comparison between the simulated and measured
temperatures corresponding to five different cases. RMSE of less than 0.15°C promises
an accurate temperature prediction.