2301
Validation of SAR Management Procedure for Dynamic pTx RF Waveforms Using a Self-Built Coil at 7 Tesla1Imaging Centre of Excellence, University of Glasgow, Glasgow, United Kingdom, 2MRI Physics, NHS Greater Glasgow & Clyde, Glasgow, United Kingdom, 3Siemens Healthcare Ltd., Glasgow, United Kingdom, 4MR CoilTech Limited, Glasgow, United Kingdom
Synopsis
Parallel transmit (pTx) can reduce B1+ field inhomogeneity present at 7T, but needs additional consideration for specific absorption rate (SAR) monitoring due to the superimposed electromagnetic fields. For self-built pTx coils, validation includes comparing electromagnetic field simulations with experimental B1+ maps and thermometry, previously presented for static pTx in a self-built 8Tx/32Rx coil. We present full-waveform pTx validation with two further tests: comparison of measured and prescribed RF waveforms, and calculation of local SAR with virtual observation points (VOPs) for all pTx pulses with comparison to scanner predictions and measurements. After validation, dynamic pTx is performed in vivo.
Introduction
Parallel transmit (pTx) is a promising solution for mitigating B1+ field inhomogeneity at ultra-high field strengths [1,2], yet needs additional consideration for specific absorption rate (SAR) monitoring due to the superimposed electromagnetic fields [3]. For self-built pTx coils, safety testing includes agreement between electromagnetic field simulations and experimental B1+ maps and thermometry [4,5]. Previously, these validation steps were reported for static pTx or B1+ shimming using a dual-mode 8Tx/32Rx coil for 7 tesla [6]. In this abstract, we outline additional checks for validating full-waveform or dynamic pTx for the same coil for use in vivo.Methods
A self-built, dual-mode 8Tx/32Rx coil was interfaced to a commercial 7T MRI scanner (MAGNETOM Terra Siemens Healthineers AG, Erlangen, Germany) that supports local SAR monitoring using virtual observations points (VOPs) [7]. The self-built coil VOPs were generated from three body model simulations at three longitudinal positions with 10% overestimation of worst case SAR. Given an error tolerance of up to 12% in amplitude and 5° in phase, the following adjustment was further made to the coil VOPs, $$\mathrm{VOP}^{modified}=1.16 \mathrm{VOP}^{original} + 0.09 \lambda_{max}\mathbf{1}\qquad(1),$$ where $$$\lambda_{max}$$$ is the maximum Eigenvalue from the original VOPs. This workflow proposes an additional two tests to interrogate and validate the application of local SAR in dynamic pTx, which provides time varying amplitude and phase configurations:- Compare measured RF pulse data to prescribed pulse waveforms
- Calculate local SAR with VOPs for all pTx waveforms and compare to scanner predictions and measurements
Test 1
Three test slice-selective pTx waveforms were generated: A) a Shinnar-Le Roux (SLR) pulse with circularly polarized (CP) amplitude and phase, B) a 2-spoke pTx pulse designed with the Siemens’ pTx pulse design (PPD) Terra scanner framework, and C) the same SLR pulse with transmit (Tx) channels 4-6 turned off. Furthermore, a fourth pulse D) was a non-selective Universal Pulse (UP) [9] designed from the method in [10] using a set of 10 previously acquired volunteer B1+ maps.
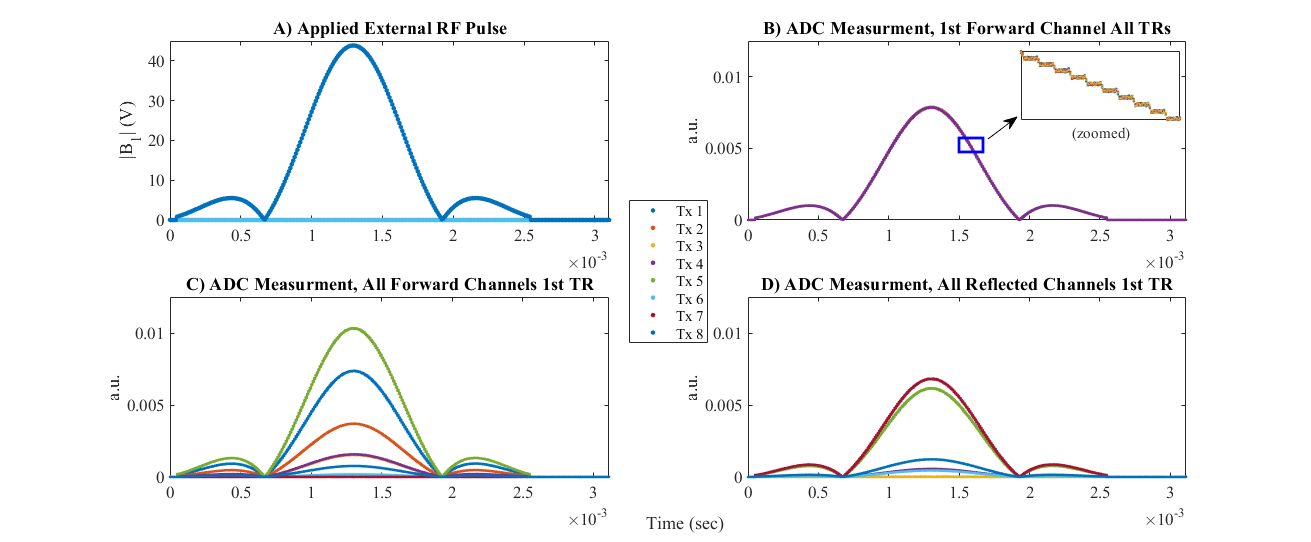
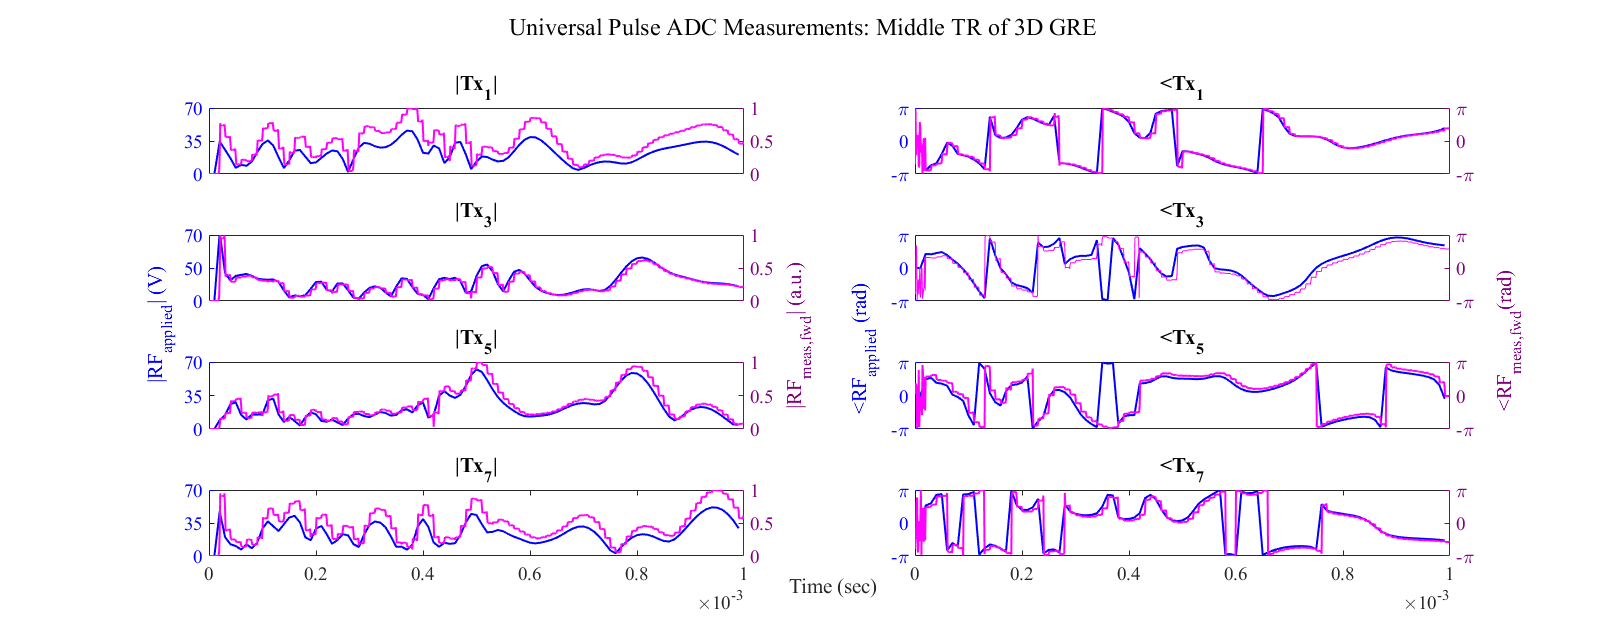
In this test, a 2D gradient-echo (FLASH) acquisition (TE/TR/FOV/Matrix/Slice Thickness = 7.5 ms/250 ms/256 mm2/256x256/5 mm) with the SLR pulse with Tx 4-6 off was measured in a phantom. The actual pulse waveforms transmitted to the coil were recorded by the scanner during measurement and compared with prescribed pulse waveforms for all 256 TR’s, 8 forward measurements, and 8 reflected measurements. Secondly, a 3D gradient-echo acquisition (FA/TE/TR/Matrix/Resolution=5°/2.28 ms/1200 ms/250x224x160/1mm3) with the UP was measured, and the prescribed/measured waveforms were also compared.
Test 2
Next the local SAR was calculated offline for the three slice-selective waveforms from Test 1 and compared to their experimental SAR (both predicted and measured by the scanner) in the FLASH sequence with TRs of 50, 100, and 250 ms. For a given RF pulse $$$b\in\mathbb{C}^{N_{Tx}\times N_{t}}$$$ in V and electromagnetic field VOPs in S/kg, the local SAR for each time point t at each VOP i is $$\mathrm{SAR}^{i}_{local}(t)=b(:,t)^{\mathrm{H}}*\mathrm{VOP}^{i}*b(:,t)\qquad(2).$$
The total local SAR for each VOP is averaged across all time points $$$N_{t}$$$ and multiplied by the RF pulse duty cycle D, $$\bar{\mathrm{SAR}}^{i}_{local}=\frac{D}{N_{t}}\sum_{t=1}^{N_{t}}\mathrm{SAR}^{i}_{local}(t)\qquad(3).$$
Two additional factors were added to the final local SAR calculation: the cable loss factor from the RF power amplifier (RFPA) to the coil plug measured to be 1.7dB, and the RFPA gain variation, which is measured during calibration at the beginning of each scan. Losses intrinsic to the pTx coil are included in the electromagnetic simulation model and hence the VOPs.
After successful completion of the outlined two tests, the pTx coil was approved by local safety and ethics committees for full use with dynamic pTx. The first experiment with a consented, healthy volunteer involved the 3D GRE scan from Test 1 using the UP pulse and a CP-mode hard pulse for comparison.
Results
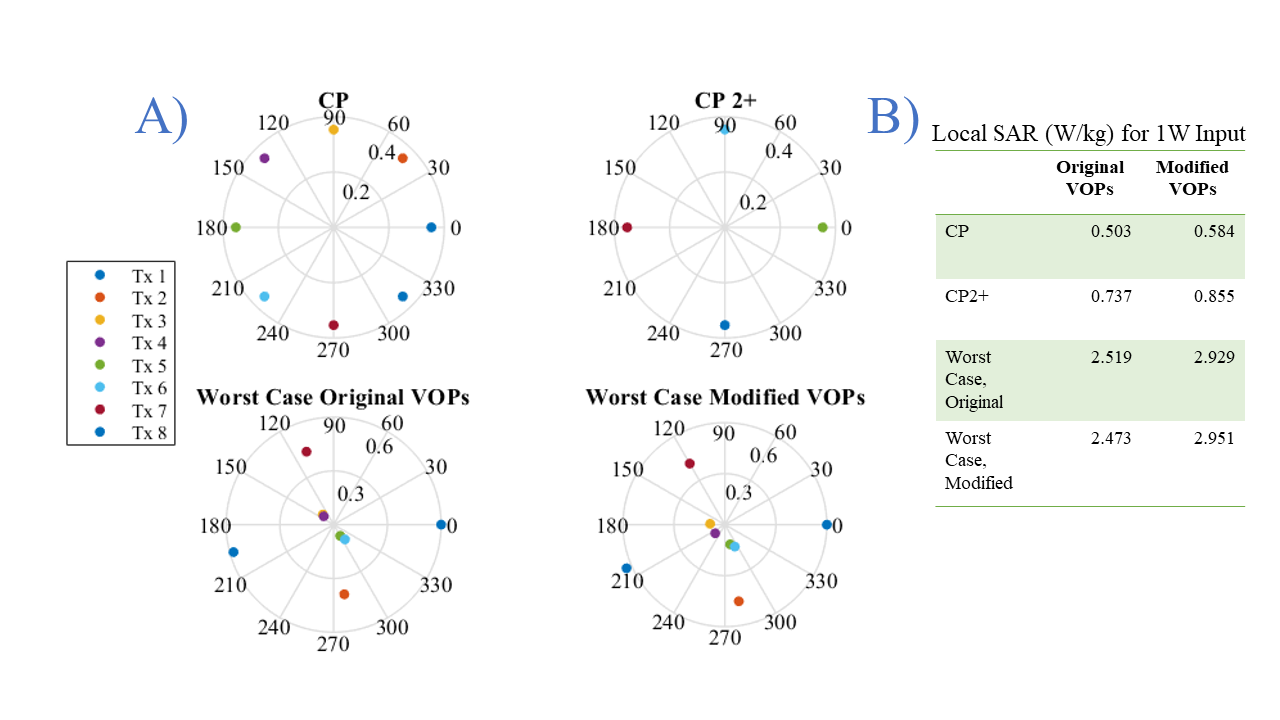
Figure 1 plots the common CP and CP2+ shim configurations for the 8Tx coil as well as the VOP-derived “worst case” SAR configurations for the original and modified VOPs to accommodate error tolerances. The relative SAR for these 4 configurations with 1 W input power is shown in the accompanying table.Figures 2 and 3 plot the applied pulses C) and D) described in Test 1 along with their measured waveforms.
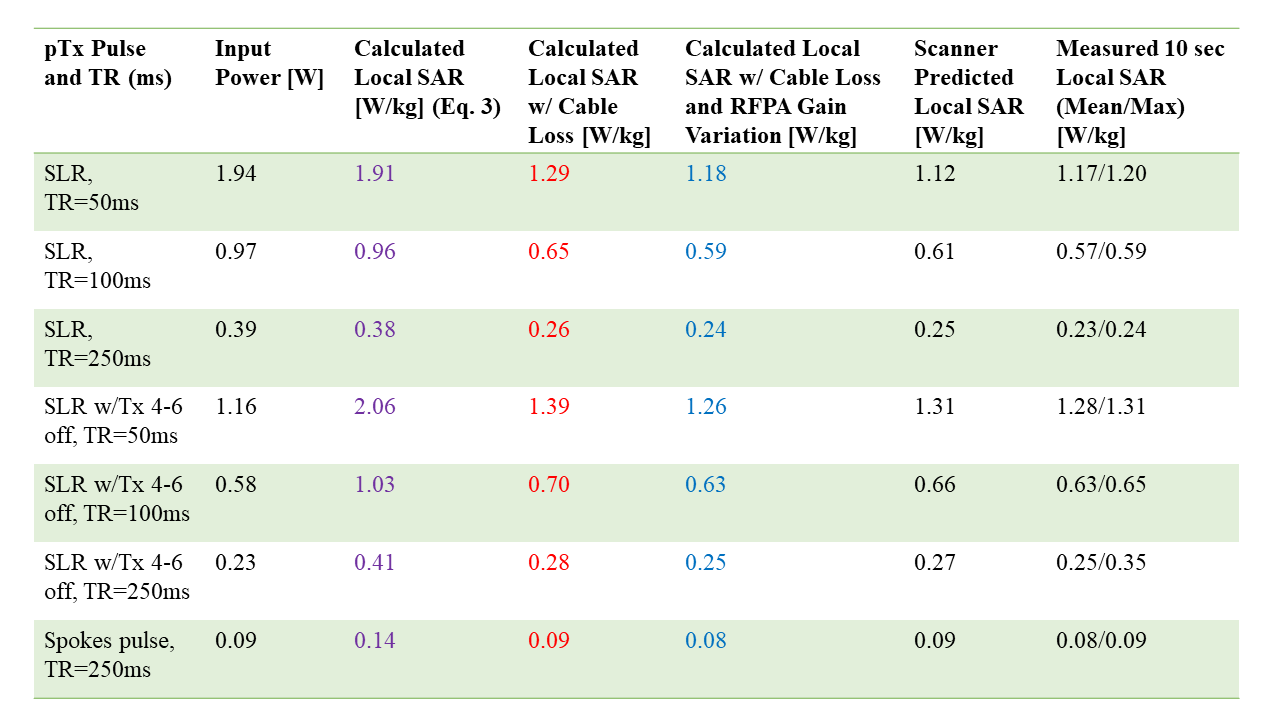
Figure 4 lists the input power and local SAR values for the three pTx waveforms scanned in FLASH with three sequence TRs. The calculated SAR values are obtained from Equation 3 and also include cable loss and RFPA gain variation terms.
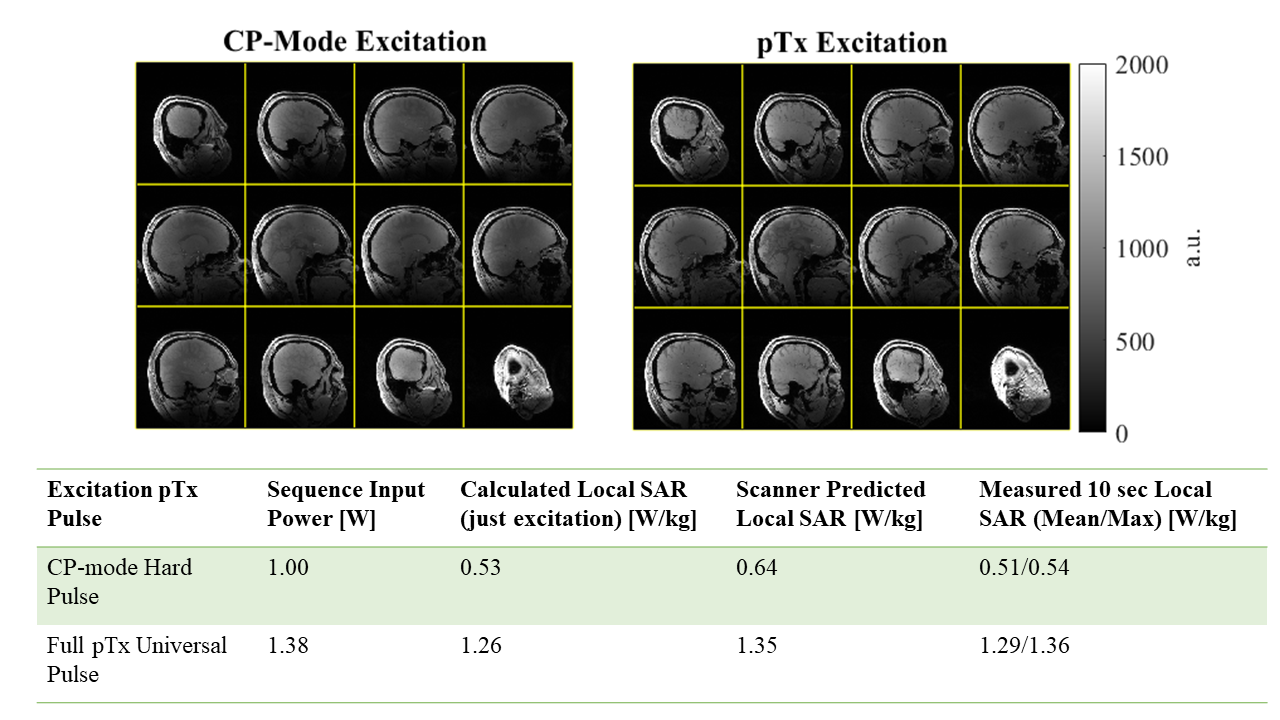
Figure 5 shows preliminary images in vivo using dynamic pTx and the self-built coil. Here, a UP is compared to a CP-mode hard pulse in a 3D gradient-echo sequence. The local SAR of both pulses is listed.
Discussion & Conclusion
We present tests to validate dynamic pTx for safe use in healthy volunteers, building confidence of local SAR management in self-built coils with consistency checks. This can lead to increased use of pTx, which will play a critical role in the widespread clinical application of 7T. In the future, we will investigate the fidelity and timing of pTx and excitation gradient waveforms, which can impact pTx performance but importantly not the local SAR.Acknowledgements
We’d like to give special thanks to Patrick Liebig and Rene Gumbrecht (Siemens Healthineers, Erlangen, Germany) for details of the SAR prediction and measurement info in the 7T Terra, and Jürgen Herrler (Institue of Neuroradiology, University Hospital Erlangen, Germany) for help in calculating Universal Pulses.References
[1]T.S. Ibrahim et al., MRI, 2000.
[2] Katscher et al., MRM, 2003.
[3] F. Seifert et al., JMRI, 2007.
[4] J. Hoffman et al., NMR Biomed., 2015.
[5] N. Boulant et al., ISMRM, 2018.
[6] S. N. Williams et al., ISMRM, 2020.
[7] G. Eichfelder et al., MRM, 2011.
[8] G. Shajan et al., ISMRM 2019.
[9] V. Gras et al., MRM 2017.
[10] J. Herrler et al., MRM 2020.
Figures