2296
Analysis on 1.5T MR clinical scan time of patients from multiple imaging centers1Axonics Modulation Technologies, Irvine, CA, United States, 2Purdue University, West Lafayette, IN, United States
Synopsis
This study reported magnetic resonance imaging (MRI) examination duration of 974 patients collected from two imaging sites. Statistical scan time analysis was performed, and distributions were obtained for different scan regions. Scan time disparities were found between the two imaging sites due to the sequence selections and configuration, which may impact imaging cost and image quality. The clinical examination duration data provides useful information for implant device manufacturers to define practical MRI conditions that improve the patients’ overall MR experience.
Purpose
This study collected 1.5T MR patient scan times from 2 clinical imaging sites and performs statistical analysis on the scan time for various body regions. Scan time distributions for different scan regions are compared between the imaging sites, providing practical insight about the expected scan time range for patients. This also provided useful scan time information for implant device manufacturers to develop MRI labeling suited for clinically relevant MR sessions.Methods
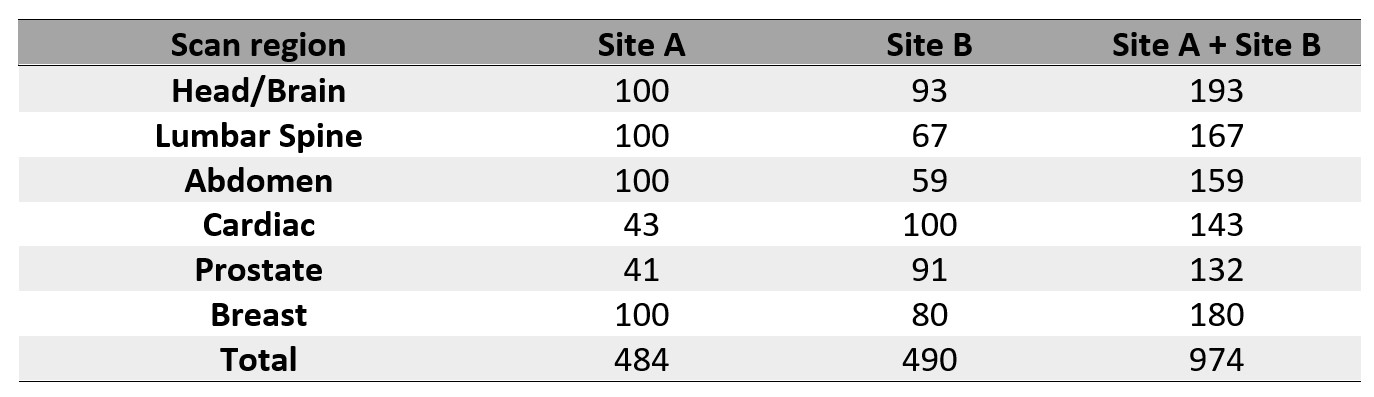
Examination duration data from a total of 974 patients were collected from 2 clinical imaging sites over the course of 2 years. For site A, data were obtained from 484 patients on a GE 1.5T scanner (Optima 450W), and for Site B, data were obtained from 490 patients on a Siemens 1.5T scanner (Avanto Fit/Aera). The scan regions analyzed in this study include Head/Brain, Lumbar Spine, Abdomen, Cardiac, Prostate and Breast. All the scans were performed in Normal Operating Mode with maximum whole body SAR of 2W/kg and maximum head SAR of 3.2W/kg. The examination duration was determined from image timestamps logged on the scanners for each patient. Statistical analysis is performed on the examination duration for each scan region, and histogram plots are generated to show the distributions.Results
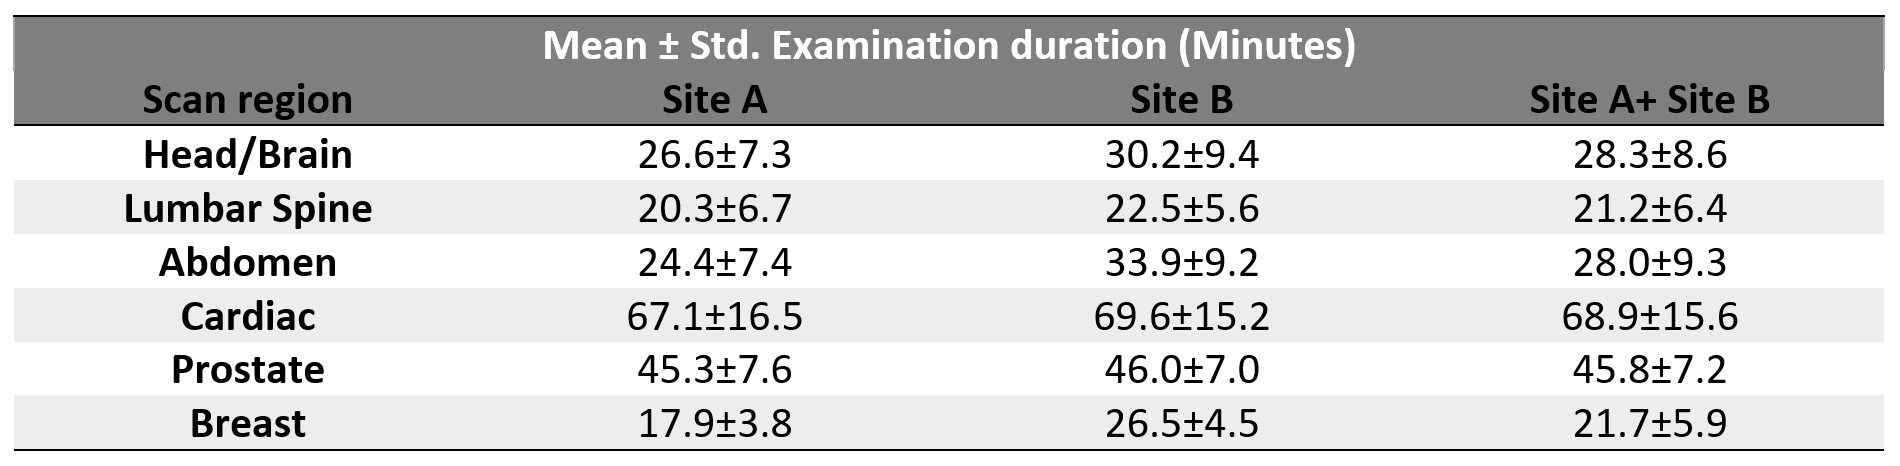
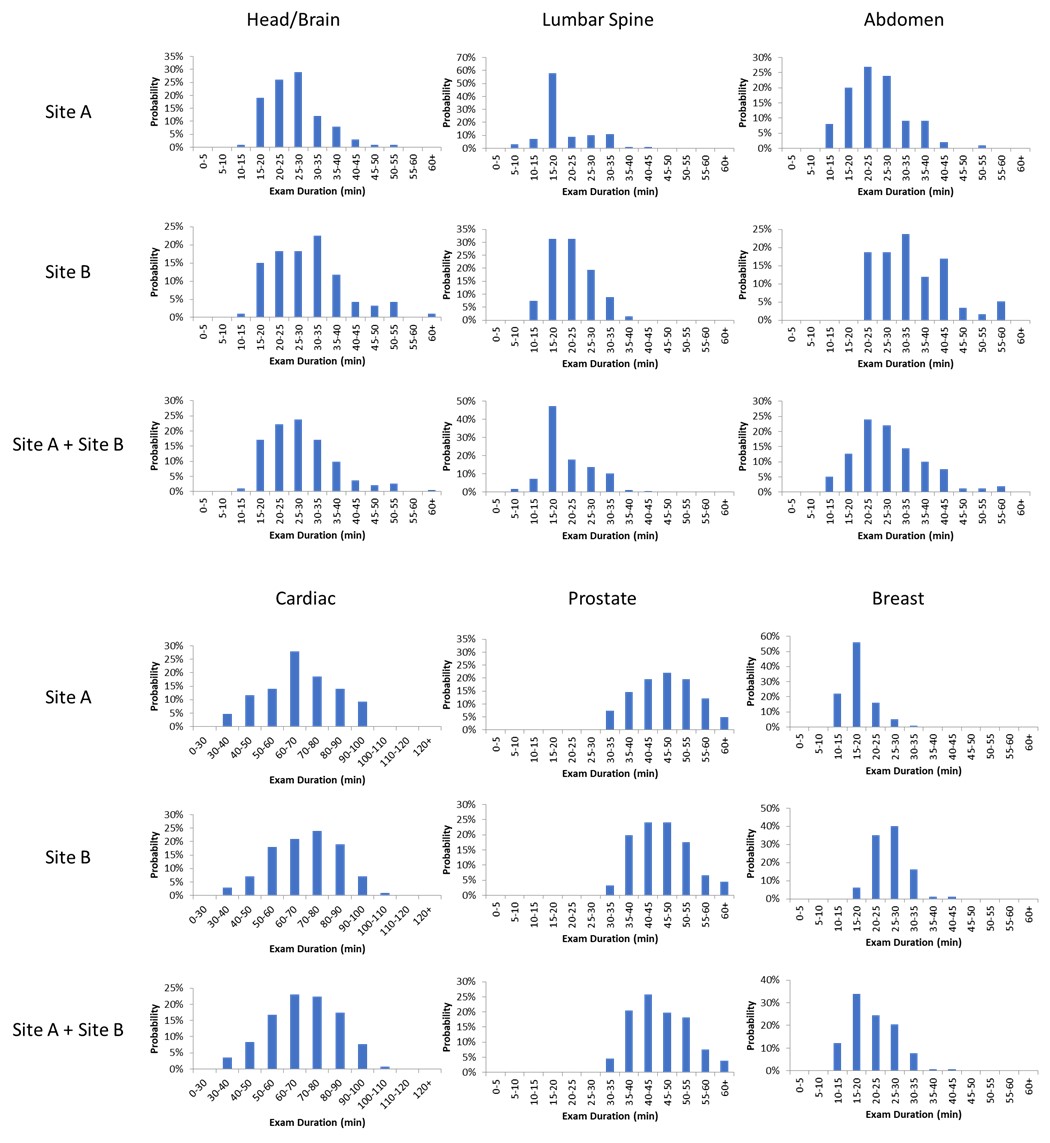
Table 2 shows the mean and standard deviation for the examination duration for each scan region and imaging site, as well as sites combined.The histogram of the examination duration for each scan region is shown in Figure 1 for Site A, Site B and Site A and B combined.
Discussion
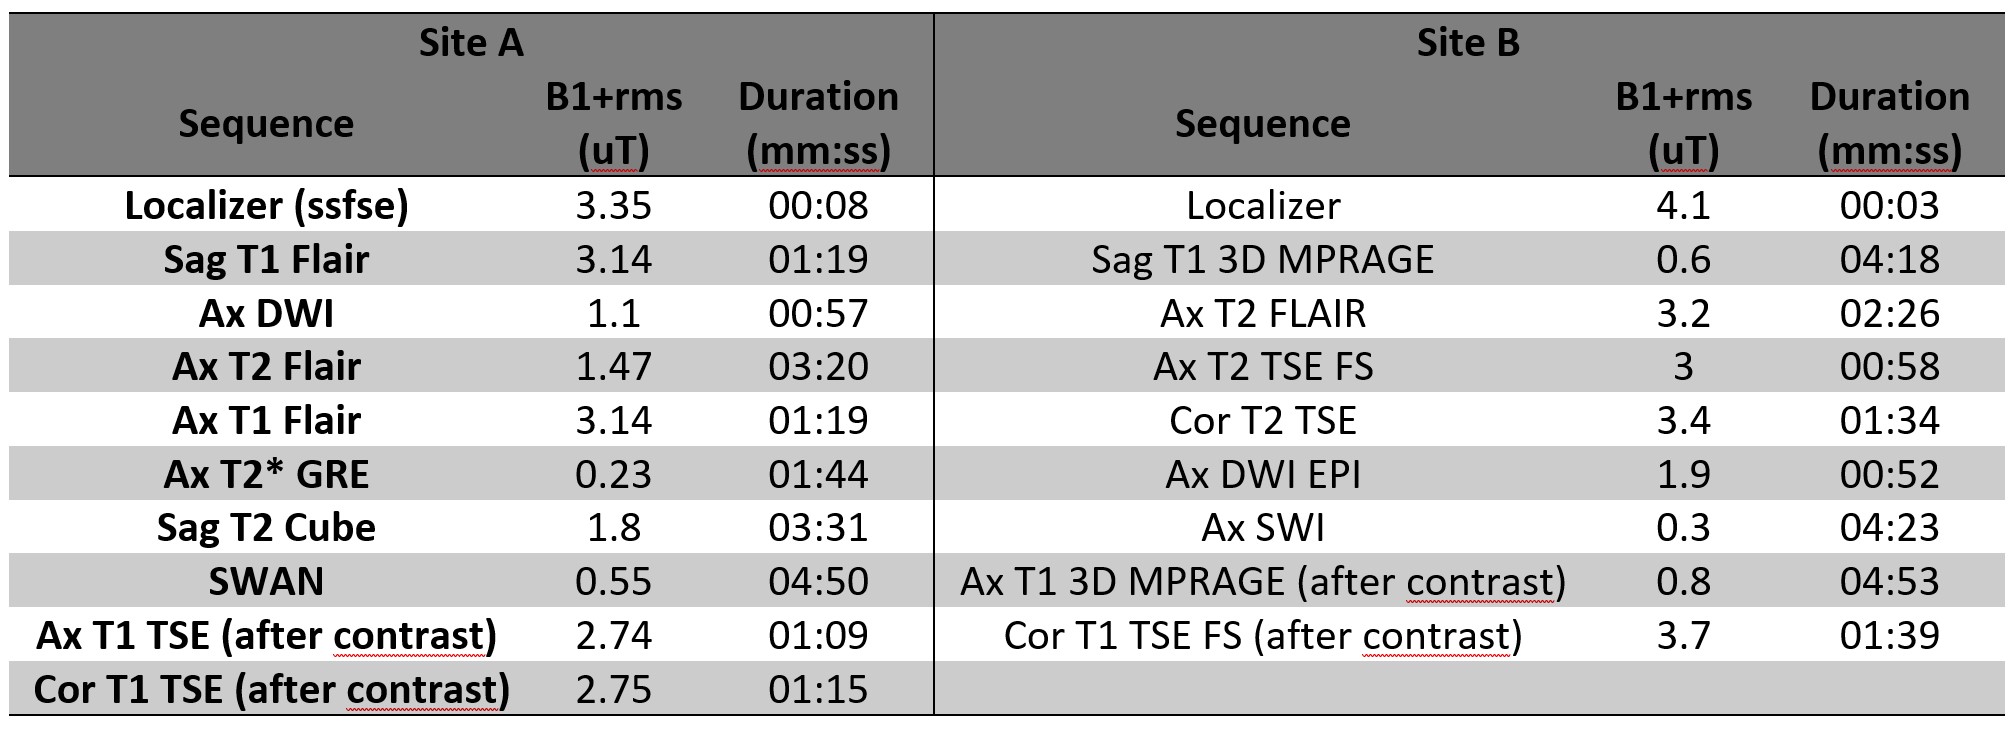
In this study we presented examination duration statistics under Normal Operating Mode for patients undergoing 1.5T clinical MR scans. For the frequent scan regions covered in this study, the average examination duration ranges from 17.9 to 69.6 minutes. There is a disparity in patient examination duration for the same scan region (up to 48 % difference in Breast scan) from the two imaging sites. Imaging centers differ in sequence selection for their protocols. These variations are typically determined by the Radiologist or Radiology Group overseeing the imaging site. Most exams have similar sequences for the body part being imaged, but certain sequences chosen by the Radiologist can significantly alter the total exam duration, SAR, and B1+rms. There can also be differences in the parameters of these sequences between imaging sites. For example, Site A uses a 2D Sagittal T1 FLAIR and 2D Axial T1 FLAIR as the standard T1 sequence in the brain, whereas Site B uses a Sagittal T1 3D MPRAGE with reformats (Table 3). FLAIR imaging uses significantly higher B1+rms and SAR as compared to the MPRAGE sequence. The distinct protocols from imaging sites may also lead to differences in image quality.The examination duration analyzed in this study includes continuous scanning time and interscan time. Head/Brain, Lumbar Spine, Prostate, and Breast imaging utilize minimal/negligible interscan time with interscan time consisting of less than 5% of the overall examination duration. Therefore, these scans can be considered as continuous scanning examinations. Abdominal and Cardiac Imaging utilize repeated and lengthier interscan times. Breath holding instructions constitute marked times in between sequences.
The examination duration for various body parts provides relevant information for implant device manufacturers while assessing time-dependent heating hazard from the exposure to RF and switching gradient fields. As a result, many device manufacturers specify a maximum allowed active scan time before a wait time is needed1 or within a scanning window2. This additional wait time requirement could drastically change the overall MR session time for prostate scans (100% exceeding 30 minutes) and cardiac imaging (100% exceeding 30 minutes with 71% over 60 minutes). Furthermore, implant device manufacturers may also specify a more restricted RF exposure limit (SAR or B1+rms) which further extends the scan time. The detailed analysis on the relationship of wbSAR limit and scan time can be found in 3.
Conclusion
This study reported patient MR examination duration from two imaging sites. The data demonstrated scan duration disparities between two imaging sites even for the same scan regions. This may impact imaging cost as well as diagnostic image quality. Implant device manufacturers may utilize this information for developing MRI labeling that offers the patient the best possible MR experience.Acknowledgements
No acknowledgement found.References
1. MRI Guidelines, Axonics Sacral Neuromodulation System, 110-0092-001rM. https://www.axonics.com/hcp/resources/resource-library
2. MRI Guidelines for InterStim systems 97810 3058 3023, 2020-07-15. http://manuals.medtronic.com/content/dam/emanuals/neuro/M980291A_a_015_view_color.pdf
3. Y Wan et al, Impact of 1.5T SAR Limits on the MRI Scan Time for Implantable Devices, ISMRM 2021
Figures