2295
A Single Setup Approach for the MRI-based Measurement and Validation of the Transfer Function of Elongated Medical Implants1Computational Imaging, UMC Utrecht, Utrecht, Netherlands, 2Biomedical Engineering, Eindhoven University of Technology, Eindhoven, Netherlands, 3Medtronic, Minneapolis, MN, United States
Synopsis
A new method to validate the transfer function (TF) of linear implants was developed, using an independent RF transmitter. A simulation study was performed exploring different methods to change the incident electric field, local transmit coils positioned at various locations is most effective for the validation. A benefit is the constant position of the leap tip and the temperature probe. We performed a TF measurement and validation study for three leads. The simulated incident electric fields of the local transmit coils and the measured TF were used to predict tip heating, verified by temperature probe measurements showing excellent agreement ($$$R^2\geq0.977$$$).
Introduction
Radio frequency (RF) fields transmitted by MRI scanners interact with active implantable medical devices (AIMDs) in patients. The RF fields are enhanced resulting in increased power deposition around the AIMD, potentially causing tissue heating1-6 . An important implant characteristic is the transfer function (TF)7. When the TF for an AIMD is known the enhancement of the electric field can be calculated from the incident electric field.The TF can be simulated and measured using a bench setup or with an MRI system using the transfer matrix8,9. Once the TF has been obtained, a validation step is required performed through local temperature rise measurements. The lead is submerged in a HEC-gel with tissue-like dielectric and a temperature probe at the tip of the lead structure. This setup is positioned inside a realistic MRI RF-transmit coil and the implant is exposed to an incident electric field. In between temperature measurements, the trajectory of the lead is altered to obtain a wide range of exposure conditions. The measured temperature increase should correspond to the predicted temperature increase using the TF and the simulated incident electric field. This approach to validate the TF has some drawbacks.
Firstly, changing the lead trajectory can alter the TF. Secondly, by changing the lead position the temperature probe is susceptible to small positional changes which can lead to significant errors since the spatial gradient of the temperature hotspot is very steep10.
Therefore, in this work we aim to find a validation method that does not have these drawbacks and can be incorporated within the MRI measurement setup for the TF, to create one overall setup.
Methods
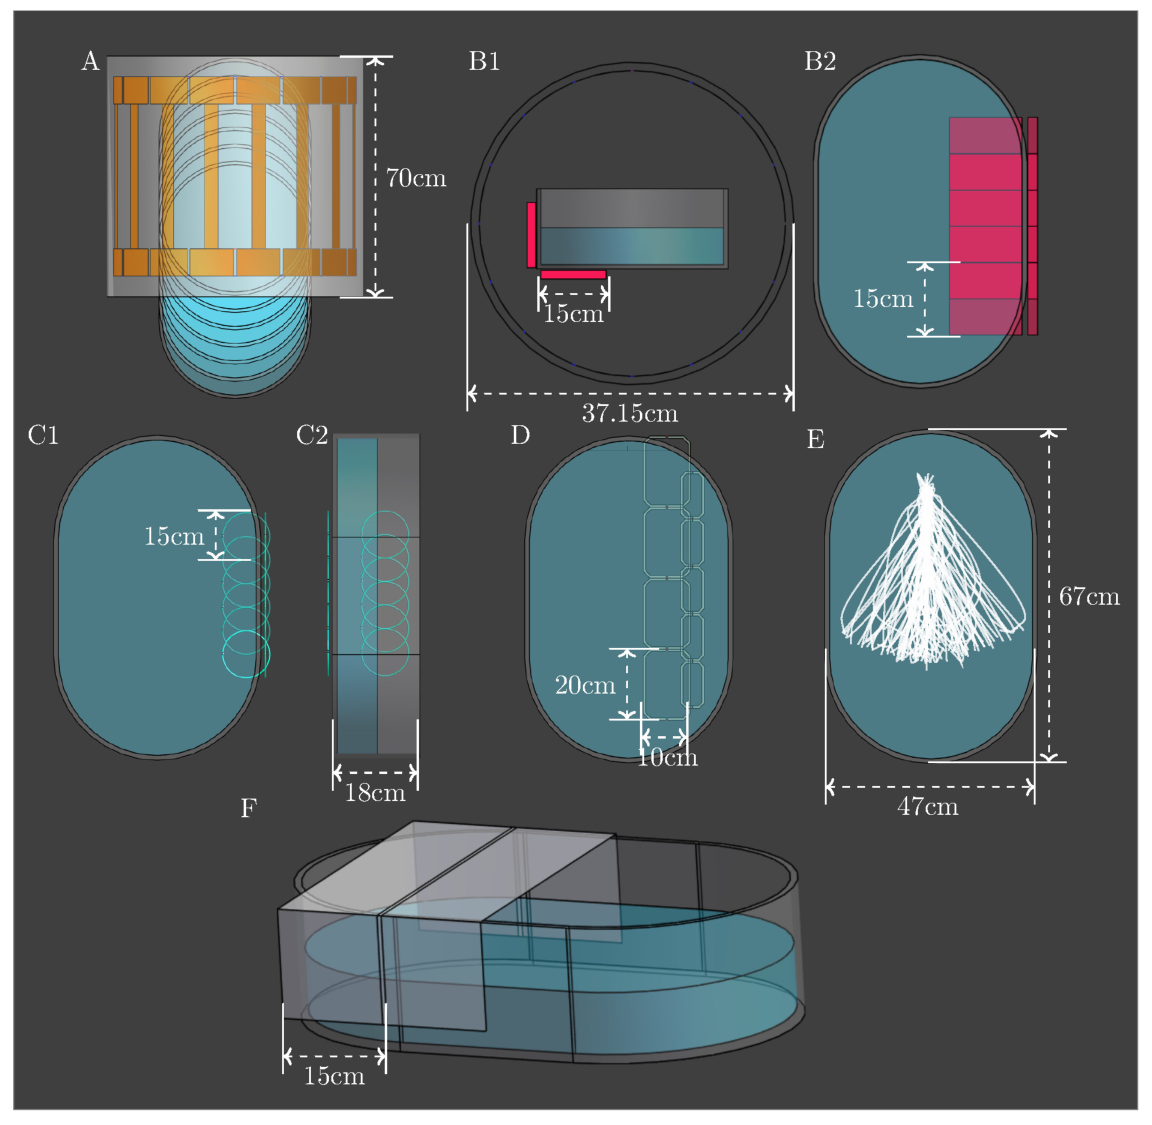
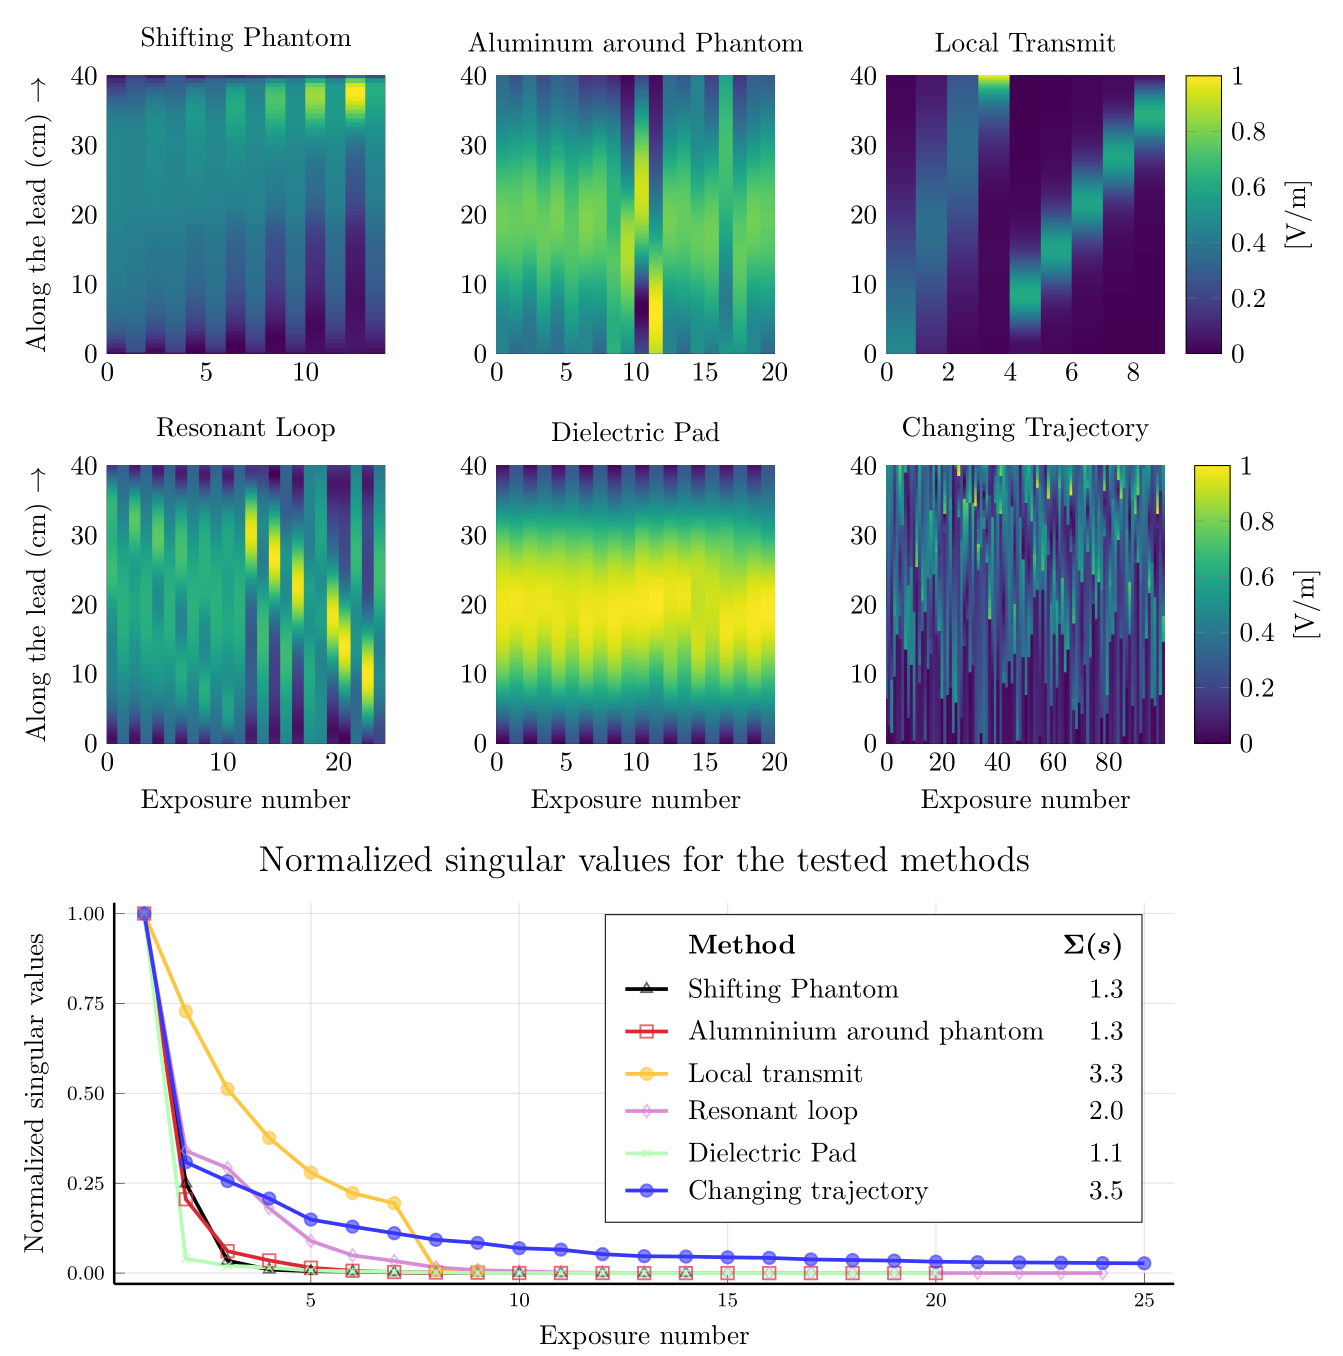
We simulate six different methodologies to change the incident electric field that can be used for the validation of the TF. These are shifting the phantom w.r.t. the transmit RF-coil, using passive scatterers (high permittivity, high conductivity, and resonant structures), positioning local transmit loops at different positions along the lead trajectory, and changing the lead trajectory itself (i.e. the conventional method). The simulations were done using Sim4Life (ZMT, Zurich, Switzerland). The setup is shown in Figure 1.Validation methods where the incident electric field distributions are orthogonal w.r.t each other are better suited to apply for the validation procedure. To assess which validation method performs best in terms of validation effectiveness we use the singular value decomposition (SVD). Along the implant trajectories, the tangential electric field distribution is extracted for each simulated scenario of the different validation methodologies. These exposures are first normalized to equal vector length and then placed as columns into a matrix. This matrix is then decomposed using the SVD where the resulting singular values are normalized and summed to obtain a single metric for the validation effectiveness. Where a higher number indicates the method is better suited for the validation procedure.
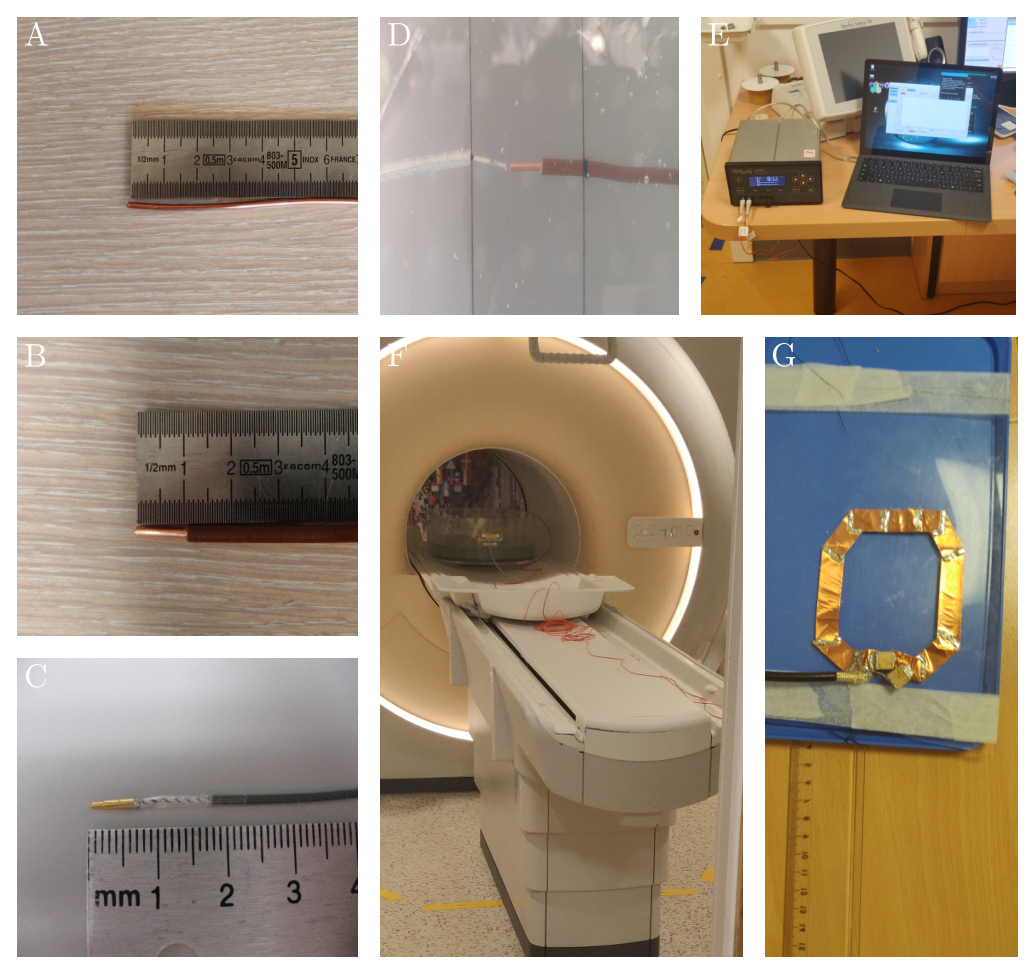
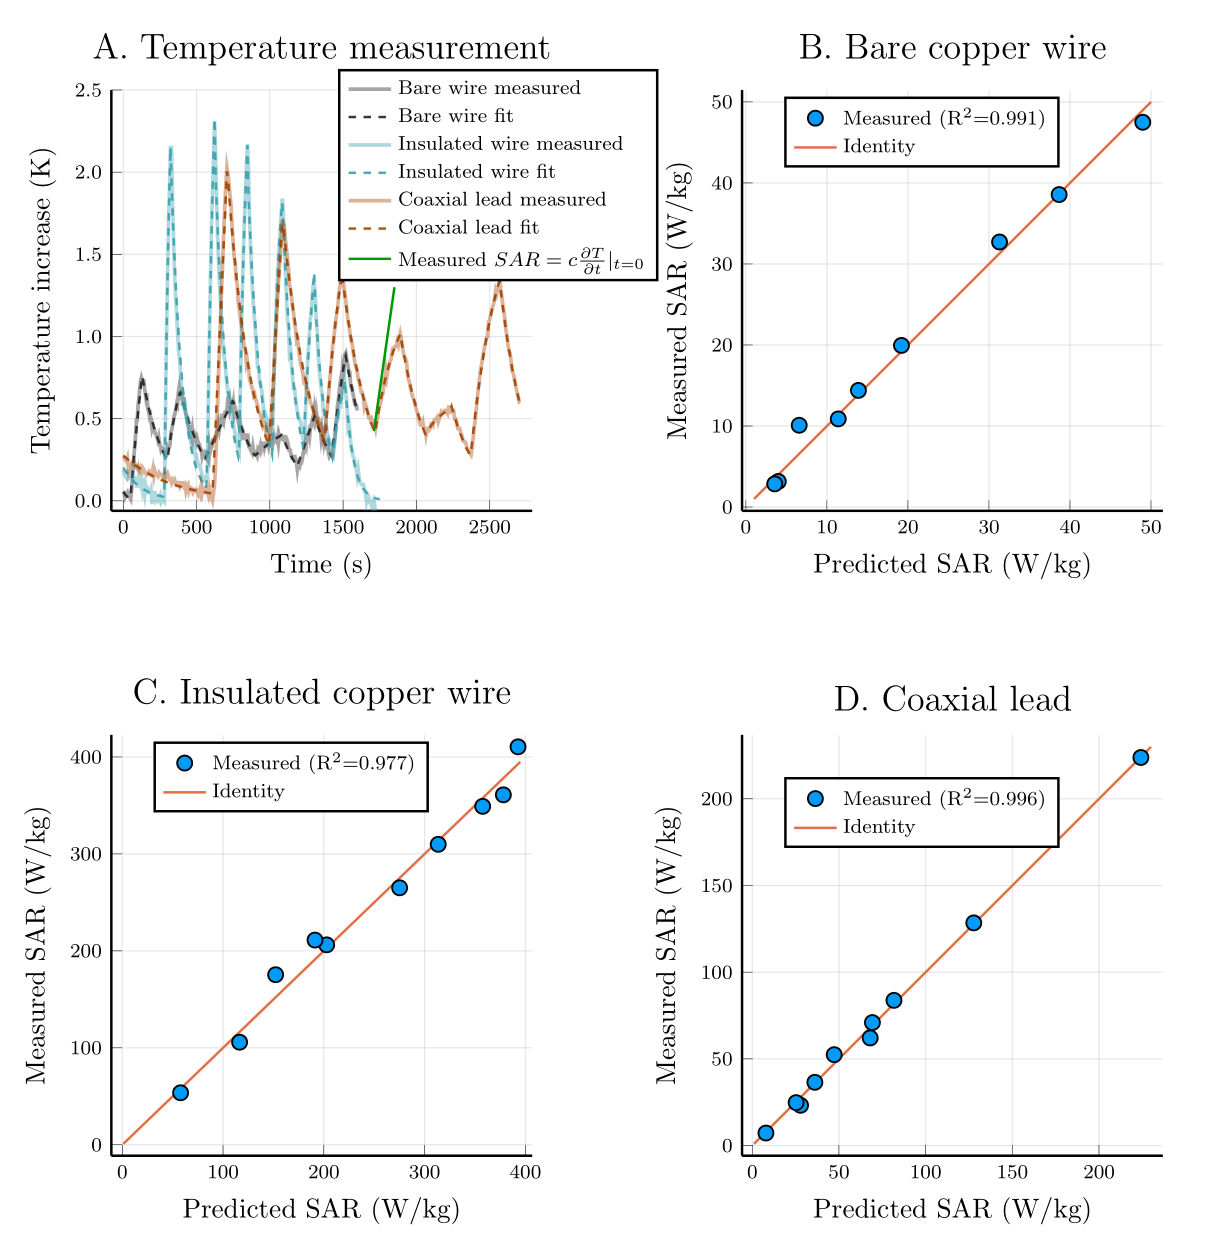
Finally, we performed a 1.5T measurement and validation study for three different linear implants: a bare copper wire, an insulated copper wire, and a coaxial lead structure. Where the measured SAR values at the tip of the leads for the various local transmit coil positions are compared to predicted SAR values based on the measured TF and simulated incident electric field distributions. The TF is measured using the birdcage coil8,9 and compared to their FDTD simulated counterparts. For the validation fiberoptic temperature probes were placed at the tip of each implant and local transmit coils were placed at different positions along the lead trajectory. The obtained temperature measurements are fitted to find the initial slope of the heating curves (which is proportional to the SAR). The implants and the setup for the measurement and validation can be seen in Figure 2.
Results
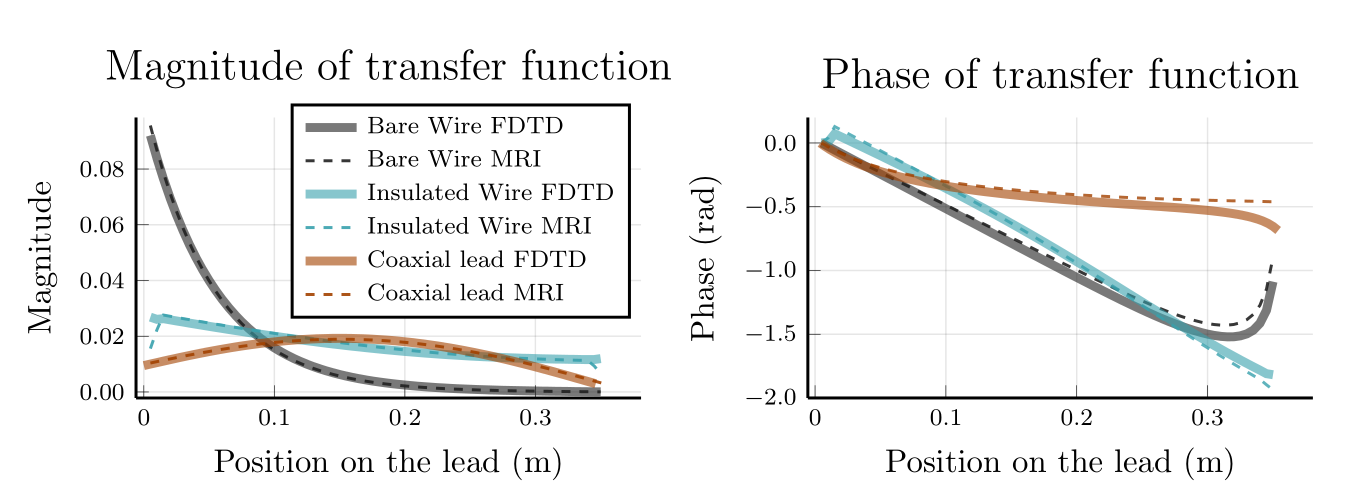
In Figure 3 the extracted incident electric fields are shown for the different validation methods. Below that the results of the SVD are plotted. Showing that shifting the phantom and using passive scatterers show rapidly decreasing singular values because they do not create many dissimilar electric field distributions. Local transmit coils and changing the lead trajectory show a slower decay of the singular values and a higher sum. In Figure 4 the simulated and measured TFs show a good agreement.Fiberoptic temperature measurement results are indicated in Figure 5a. Each temperature peak corresponds to one local transmit coil position. Figure 5 shows the correlation plots between predicted SAR (based on simulated incident electric fields and the measured TF) and measured SAR as determined from Figure 5a where one example is given. Agreement is excellent with $$$R^2 \geq 0.977$$$.
Discussion & Conlusion
The TF is measured and validated using the MRI system for three different leads. The benefits are that only one setup is required, the measured TF is not altered during the validation through self-coupling of the lead because the lead trajectory is kept constant. Furthermore, since the lead trajectory is not changed the relative distance between the temperature probe and the lead tip is constant which eliminates a large error source for the validation procedure.A disadvantage of this method is that it does require significant time inside the MRI system for the measurement of the TF. The validation could be done outside the MRI system in the same phantom.
Acknowledgements
No acknowledgement found.References
1. Panych LP and Madore B. The physics of mri safety. J Magn Reson Im, 47(1):28–43, 2018.
2. Rezai AR, Finelli D, Nyenhuis JA, Hrdlicka G, Tkach J, and Sharan A et al. Neurostimulationsystems for deep brain stimulation: In vitro evaluation of magnetic resonance imaging-related heating at 1.5 tesla. J Magn Reson Im, 15(3):241–250, 2002.
3. Henderson JM, Phillips M, Tkach J, Rezai AR, Baker K, and Shellock FG. Permanent neurological deficit related to magnetic resonance imaging in a patient with implanted deep brain stimulation electrodes for Parkinson's disease: Case report. Neurosurgery, 57(5):E1063–E1063,11 2005.
4. ISO TS 10974. Assessment of the safety of magnetic resonance imaging for patients with an active implantable medical device. International Organization for Standardization, 2018.
5. Erhardt JB, Fuhrer E, Gruschke OG, Leupold J, Wapler MC, and Hennig J et al. Should patients with brain implants undergo MRI? J Neural Eng, 15(4):041002, may 2018.
6. Bhusal B, Bhattacharyya P, Baig T, Jones S, and Martens M. Measurements and simulation of rf heating of implanted stereo-electroencephalography electrodes during mr scans. Magn Reson Med, 80(4):1676–1685, 2018.
7. Park SM, Kamondetdacha R, and Nyenhuis JA. Calculation of mri-induced heating of an implanted medical lead wire with an electric field transfer function. J Magn Reson Im, 26(5):1278–1285, 2007.
8. Tokaya JP, Raaijmakers AJE, Luijten PR, Bakker JF, and van den Berg CAT. Mri-based transfer function determination for the assessment of implant safety. Magn Reson Med, 78(6):2449–2459, 2017.
9. Tokaya JP, Raaijmakers AJE, Luijten PR, and van den Berg CAT. Mri-based, wireless determination of the transfer function of a linear implant: Introduction of the transfer matrix. Magn Reson Med, 2018.
10. Kozlov M and Kainz W. Effect of temperature sensor location and measurement time on evaluation of the calibration factor of the lead electromagnetic model. In 2019 IEEE InternationalSymposium on Antennas and Propagation and USNC-URSI Radio Science Meeting, pages765–766, 2019.
Figures