2294
Quantification of safety and image quality in low field MRI in the presence of medical implants.1G.J. Gorter Center for High Field MRI, Leiden University Medical Center, Leiden, Netherlands, 2Neurosurgery, Carle Foundation Hospital, Urbana, IL, United States
Synopsis
Very little quantitative data exist on safety aspects of medical implants in low field MRI systems. Protocols for clinical scanners must be adjusted due to differences in bore size and B0 direction. We present measured and simulated data on magnetically induced displacement forces, image artifacts and SAR on a 50 mT portable MRI system. Results show that some implants must be considered MR unsafe even at 50 mT, that image artifacts are less compared to 3 T even with much lower gradient strengths, and SAR limits can be breached if using very short pulses and inter-echo times in TSE sequences.
Introduction
Recent advances in low-field portable MRI systems enable new applications for MRI as well as operation in venues other than mainline hospitals1,2. Potential advantages of low-field MRI include reduced patient contraindications due to implanted medical devices, more benign image artifacts and lower specific absorption ratio (SAR). However, there are currently no quantitative assessments of these aspects, nor comparisons to standard clinical systems. Due to the smaller size and axial B0 configuration in Halbach arrays, application of ASTM test protocols is not straightforward. We provide the first quantitative results for magnetically induced forces, image artifacts and SAR from medical devices with different geometries and susceptibilities on a 50 mT Halbach-based system3, incorporating suitable adaptations of ASTM protocols.Methods
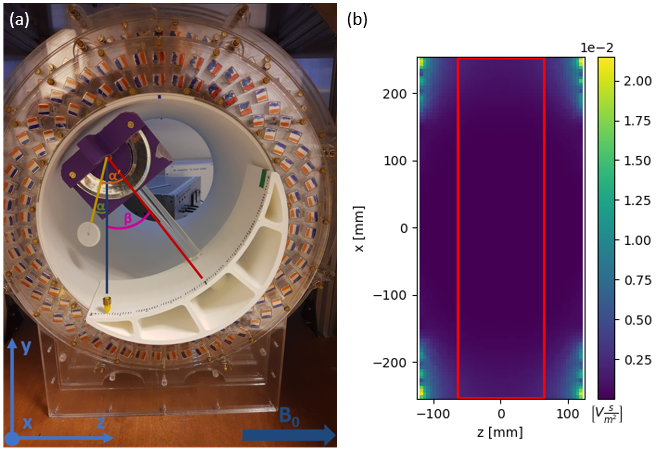
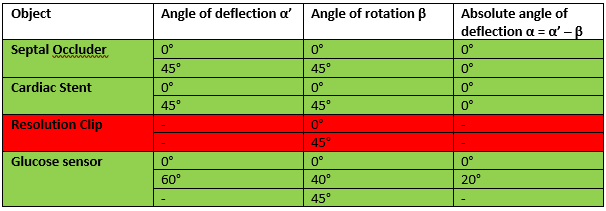
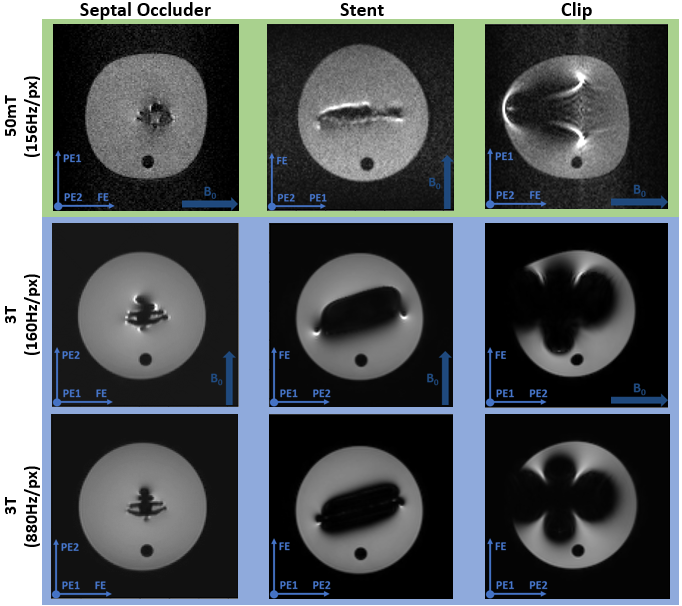
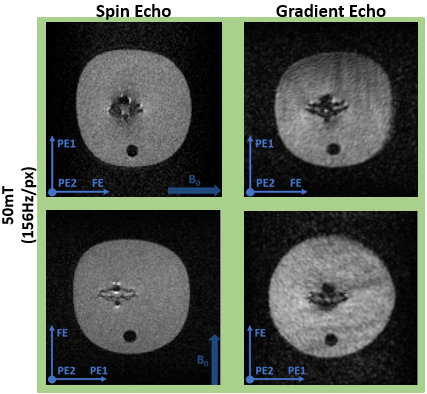
Magnetically induced displacement forces (Fm): For implanted medical devices, assessment is described by ASTM F2052-154, which measures the angle of deflection α to relate the values of Fm and Fg, the gravitational force. Rather than measurement solely axially for a Halbach array we assess the spatial gradient in two directions (x and z). The measurement was made in the region of highest spatial gradient for a septal occluder (Amplatzer), an Iliac stent (CardiacDevices), an endoscopic clip (Resolution, Boston Scientific) and a glucose sensor (Freestyle Libre, Abbott). The custom-built apparatus is able to rotate (Figure 1a).Image artifacts arising from implanted medical devices: ASTM F2119-075 quantifies image artifacts produced by implants. Individual implants, with a reference nylon rod, are placed in a 9cm diameter container filled with CuSO4 solution to shorten T1. Data were acquired in every combination of frequency- and phase-encoding with respect to B0 using a TSE sequence. Images were acquired on the 50 mT system with a bandwidth of 160Hz/pixel (the maximal bandwidth) and a Philips 3 T system for comparison. Two TSE scans were acquired on the 3 T with a bandwidth of 160 and 880Hz/pixel respectively. Also, gradient echo (GE) scans were acquired at 160Hz/pixel with a TE of 4.5ms at 3 T and 16ms at 50 mT (minimal TE of the 50 mT scanner) with and without the implant.
Specific absorption rate (SAR): Although several studies simply state that SAR is not problematic at very low field, there has been little quantitative assessment, therefore simulations were performed to determine under what conditions SAR limits might be reached, even at 2.15MHz. Since all medical implants are much smaller than λ/2, the same SAR is expected with and without the implant, and is given by6:
$$\mathrm{SAR}=6.81\times 10^{-19}\frac{\nu^2 R^2}{\rho s \mathrm{TR}}\sum_i \frac{N_i}{\tau_i}\left(\frac{2\theta_i}{\pi}\right)^2$$
where Niθi pulses (duration of τi) are applied, R is the radius of the imaged body part, here 0.092m for the brain, ρ its resistivity (2.17Ωm), and s its specific gravity (1.07)6,7. Since TSE sequences are most commonly used at low field, and produce highest SAR, we simulated the SAR for different pulse durations, echo train lengths and TR/TE values.
Results
Displacement: Table 1 shows the results of the deflection angle measurements. The stent and occluder showed no displacement, while the clip was directly drawn to the edge of the bore. The glucose sensor displacement was measurable between z = -60mm and z = 60mm: at larger z the sensor was drawn against the magnet. At z = ±60mm Fm = 11.1mN. As demonstrated by the simulation data (Figure 1b), the spatial gradient of B0 does not change much outside the measurement area, and so the sensor can be considered MR safe with respect to the displacement force at 50 mT.Artifacts: Figure 2 shows the worst case orientations of three implants. The image artifacts for all implants are smaller at 50 mT than at 3 T, even with the larger 3 T bandwidth. Figure 3 shows a comparison of GE and TSE scans at 50 mT for the septal occluder.
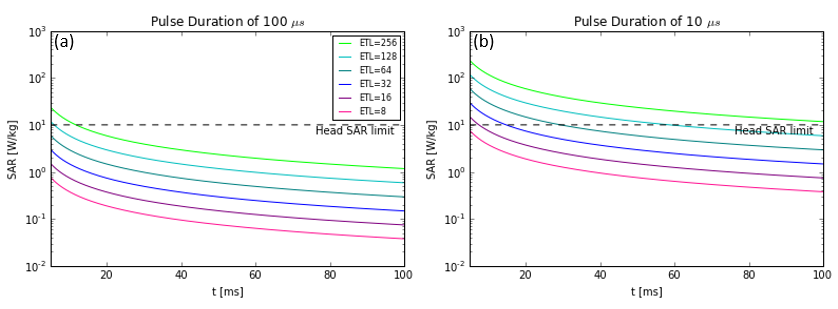
SAR: Using a 1kW amplifier at 50 mT pulse durations of ~100μs are applied, covering the typical linewidth over the brain of ~2-4kHz. Figure 4a shows that even for ETLs of 64 with inter-echo spacings of a few ms the SAR is below the head limit8. For the situation for magnets with ten times lower homogeneity, simulations were performed using a pulse duration of 10μs. In this case Figure 4b shows that SAR limits are reached for inter-echo times of a few ms for an ETL of only 8.
Discussion
This study describes the first quantitative assessments of medical device compatibility, image quality and SAR for a low field portable MRI system. The results show that displacement forces are less than for a clinical system, but ferromagnetic implants may still be classified as MR unsafe. Despite the much lower gradient strengths available on the 50 mT system, image artifacts for medical devices are smaller than those at 3 T using maximum gradient strength. Quite severe artifacts are still present for ferromagnetic implants. Finally, results show that SAR is well below limits for even very long echo train length TSE sequences for normal operating conditions. However, if pulse durations have to be very short in strongly inhomogeneous magnetic fields, and inter-echo times very short to minimize diffusive signal attenuation in such fields, then SAR limits can be breached.Acknowledgements
This work is supported by the following grants: Horizon 2020 ERC Advanced NOMA-MRI 670629, Simon Stevin Meester Award.References
1. Wald L L, McDaniel P C, Witzel T, et al. Low-Cost and Portable MRI. J Magn Reson Imaging. 2019;52(3):686-696. 10.1002/jmri.26942.
2. Cooley C Z, McDaniel P C, Stockmann J P, et al. A Portable Brain MRI Scanner for Underserved Settings and Point-Of-Care Imaging. Pre-print. 2020.
3. O'Reilly T, Teeuwisse W M, de Gans D, et al. In vivo three-dimensional brain and extremity MRI at 50 mT using a permanent magnet Halbach array. Magn Reson Med. 2021;85(1):495–505. 10.1002/mrm.28396.
4. ASTM International. Standard Test Method for Measurement of Magnetically Induced Displacement Force on Medical Devices in the Magnetic Resonance Environment, F2052 – 15. West Conshohocken, PA, United States: ASTM International; 2015.
5. ASTM International. Standard Test Method for Evaluation of MR Image Artifacts from Passive Implants, F2119 – 07. West Conshohocken, PA, United States: ASTM International; 2013.
6. Bottomley P A, Edelstein W A. Power deposition in whole-body NMR imaging. Med Phys. 1981;8(4):510-512.
7. Grandolfo M, Vecchia P, Gandhi O P. Magnetic Resonance Imaging: Calculation of Rates of Energy Absorption by a Human-Torso Model. Bioelectromagnetics. 1990;11(2):117-128.
8. International Electrotechnical Commission. Medical Electrical Equipment - Part 2-33: Particular Requirements for the Basic Safety and Essential Performance of Magnetic Resonance Equipment for Medical Diagnosis, IEC 60601-2-33:2010+AMD1:2013+AMD2:2015 CSV. International Electrotechnical Commission; 2015.
Figures