2291
Numerical Modelling of a Close-fitting 8-channel Transceiver Head Coil and EEG Electrodes for Safety Validation at 7T1University of Glasgow, Glasgow, United Kingdom, 2NHS Greater Glasgow and Clyde, Glasgow, United Kingdom
Synopsis
Simultaneous use of EEG and fMRI at high fields (UHF, ≥7T) offers the dual benefits of a high spatial resolution as well as the ability to study dynamic brain processes. A close fitting coil design has been built for this purpose, having open access to the subject and the EEG hardware while maintaining excellent performance characteristics. We present here the results from computer simulations of the head coil, including the EEG cap using human body models for safety validation and optimization of the design.
Introduction
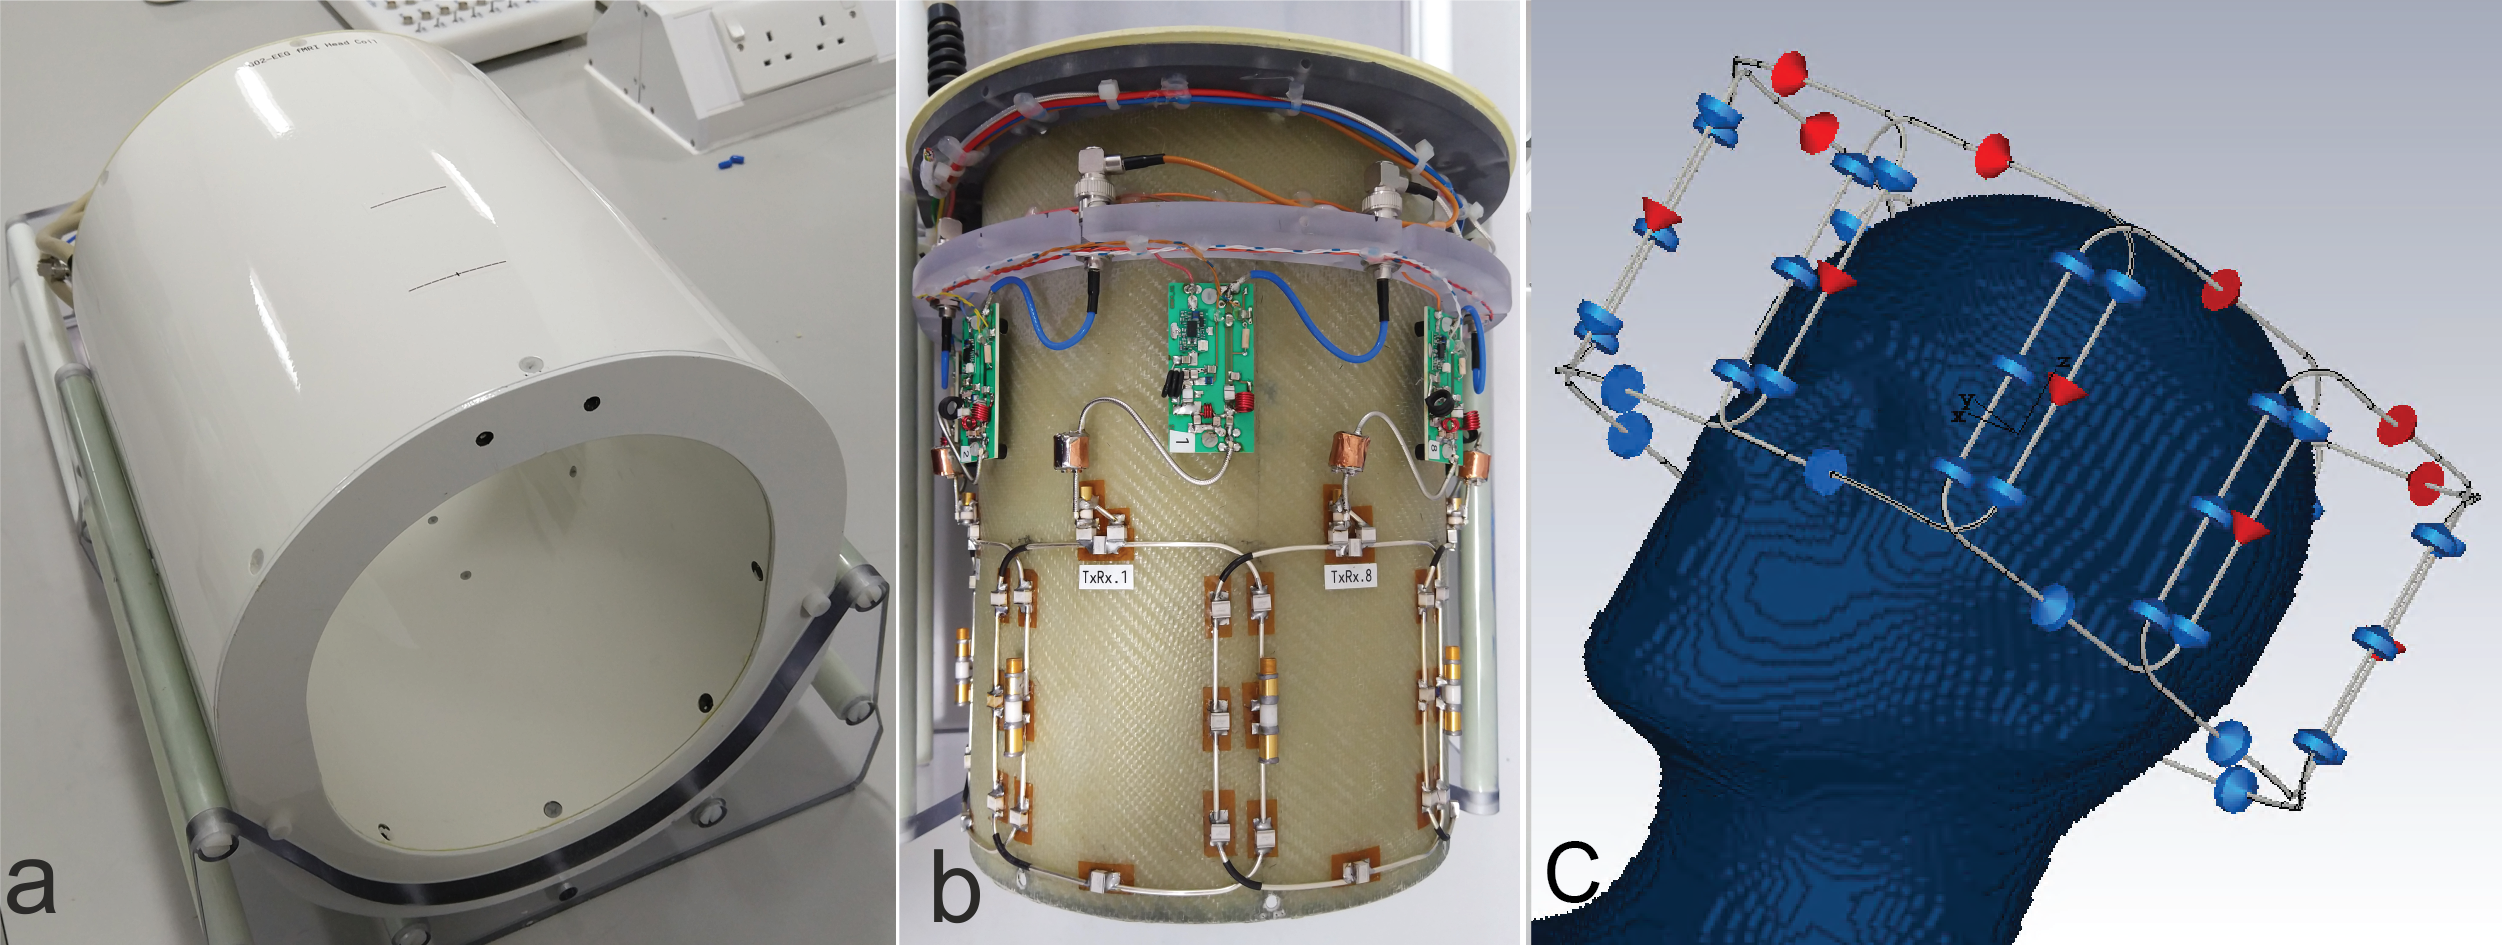
The simultaneous use of EEG and fMRI in the study of dynamic brain function may offer greater insight than either method achieves in isolation. With the greater spatial resolution at ultra-high field MRI (UHF, ≥7T) the development of a simultaneous EEG-fMRI at 7T proves a fertile field for investigation1-4. Previously, a close fitting eight-channel transceiver array head coil5 for use at 7 tesla in conjunction with a Brain Products 64 channel EEG cap was presented6. This coil allowed easy access to the amplifiers and the battery pack placed behind the coil (figure 1). Here we present an electromagnetic simulation study of the influence of the EEG cap on SAR for safety validation of the head coil.Methods
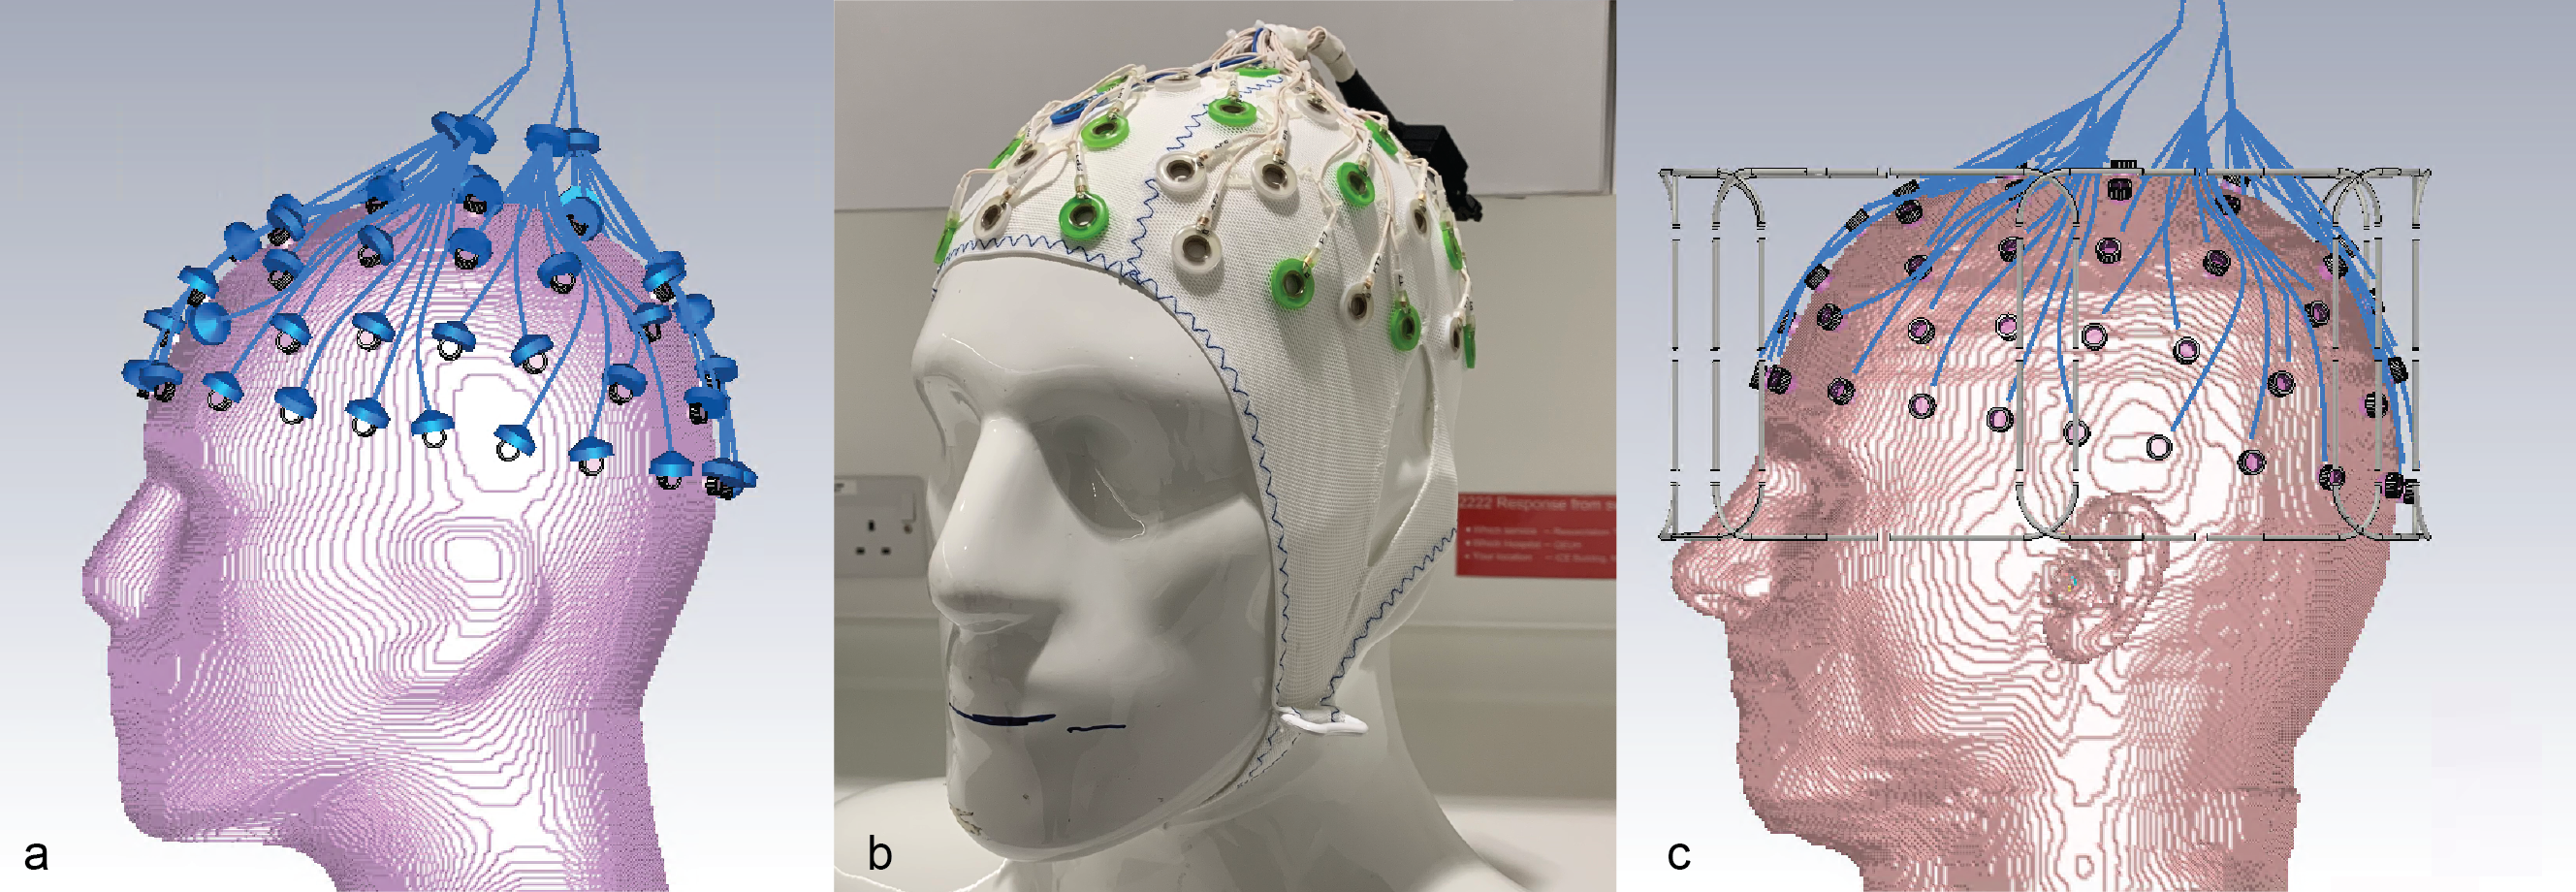
The numerical model in CST (Dassault Systems, France) consisted of a close-fitting oblate rectangular 8-channel array. The adjacent elements were geometrically overlapped. For design optimization, these loops were idealized perfect conductors with fixed value capacitors represented as lumped elements. Each loop has 2 ports, which are linked to an external circuit model containing a matching circuit and a tuning capacitor. All losses up to the coil plug was included in the model. Initially, the S-parameters were optimized using a head-shaped phantom filled with tissue equivalent solution. The EEG cap was added to the phantom model and its influence on the transmit field was verified in both simulation and measurement7,8 (figure 2a, b). The fidelity of the model was also improved by including the fiberglass phantom shell (εr = 4.3, 2mm thick) and a secondary shell (εr = 64.8, σ = 1.48 S/m, 1mm thick) represented the electrolyte gel as required by the manufacturer to provide a conductive path between electrodes when using the EEG cap on a non-conductive phantom. The electrical properties of the gel was measured using a dielectric probe kit (DAK, Speag AG, Zurich, Switzerland). Duke and Ella models (virtual family, 1mm resolution) was simulated in three different positions along the z-direction, both with and without the EEG cap (isocenter; 15mm and 30mm towards the head direction). In anticipation of the added complexity to the model that the EEG electrodes would impart, a relatively high local mesh regime was implemented with the minimum mesh size of 0.4mm, giving an average number of 75 million mesh cells. The model including the EEG electrodes has 66 PEC loops (Figure 2c). They are approximately 1mm from the surface of the phantom and are each filled by same electrolyte gel used to shell the phantom. The EEG electrodes are connected to a common port via CST ‘bond wires,’ which have the characteristics of a perfect conductor. Each of these contains a 10KΩ resistor (not shown) and the location of the port is approximately 5 cm above the location of the electrode CPz. The port is matched to the system with an impedance of 50Ω.Results
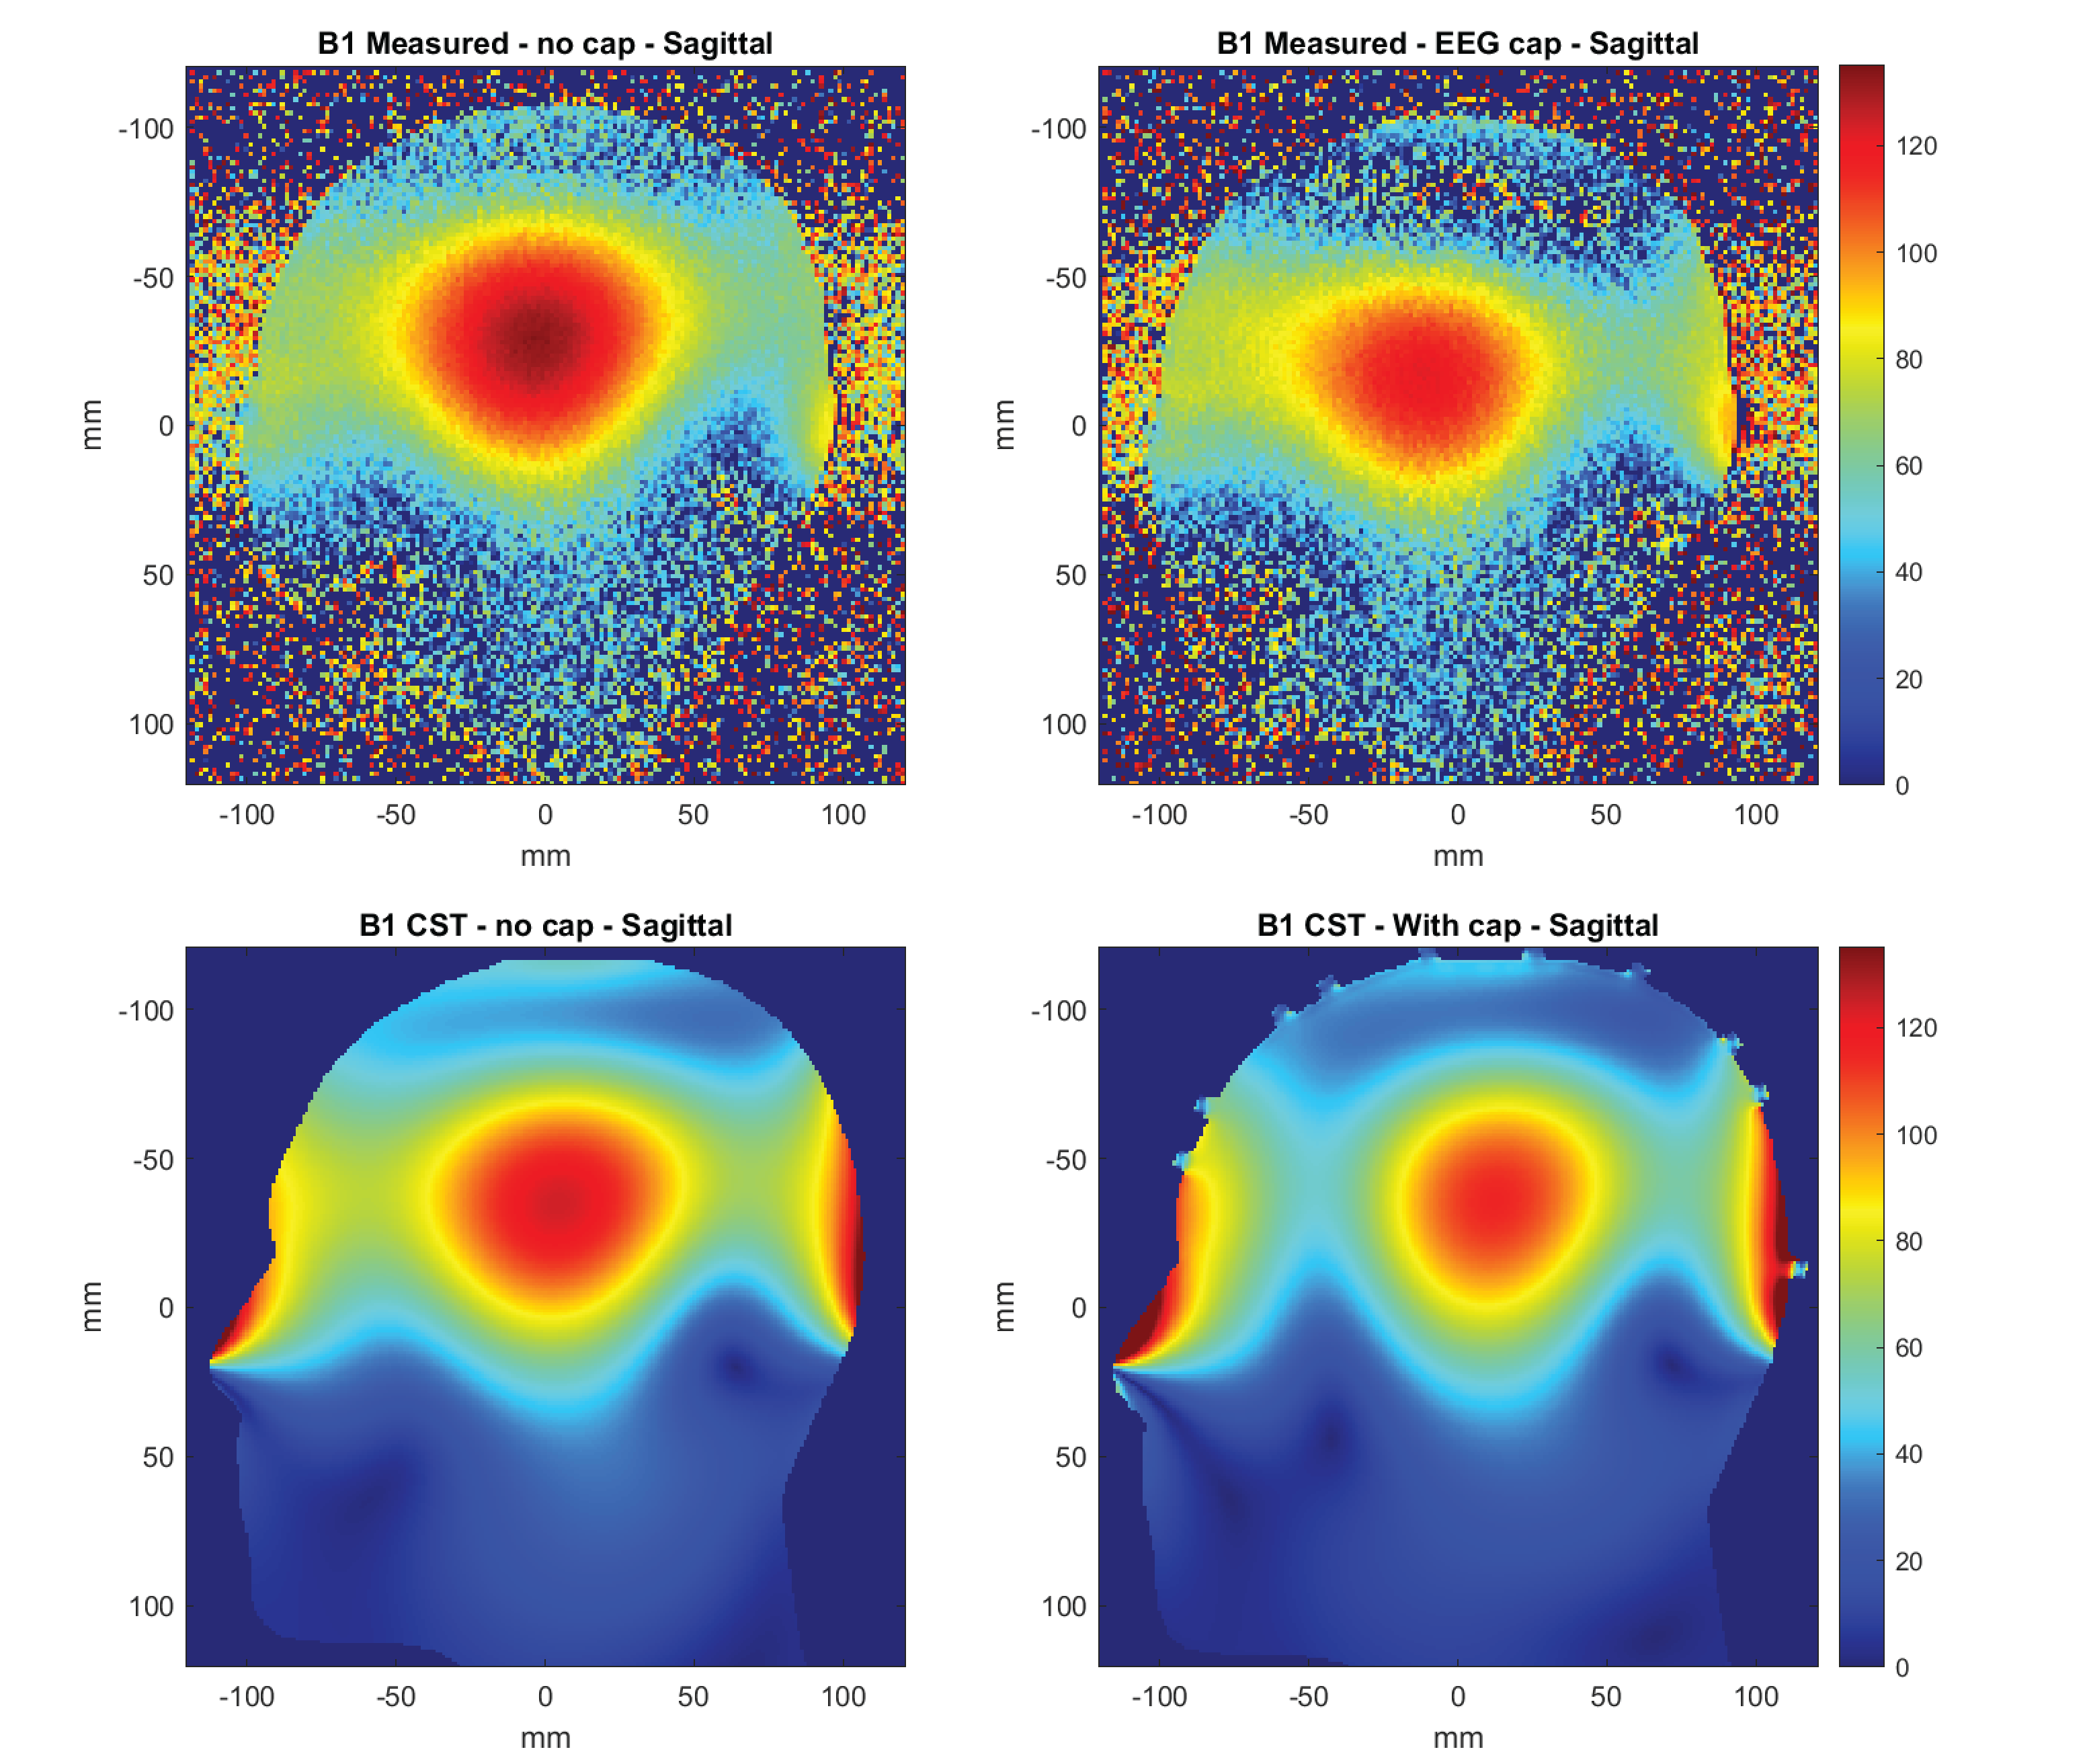
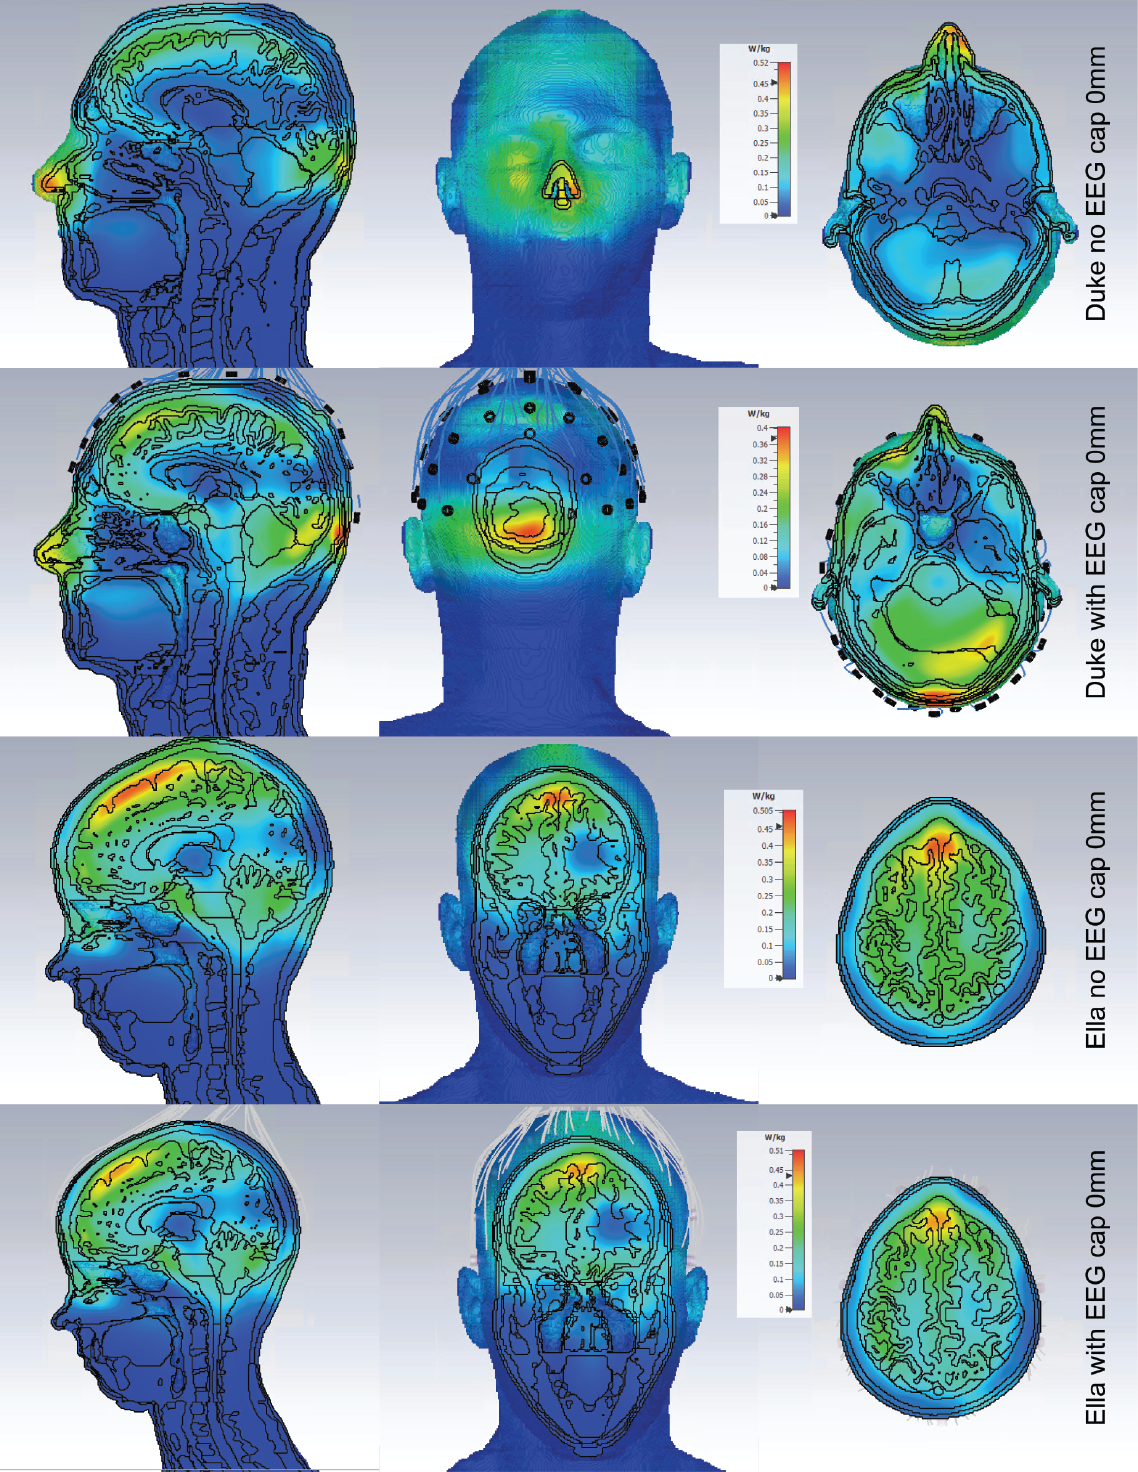
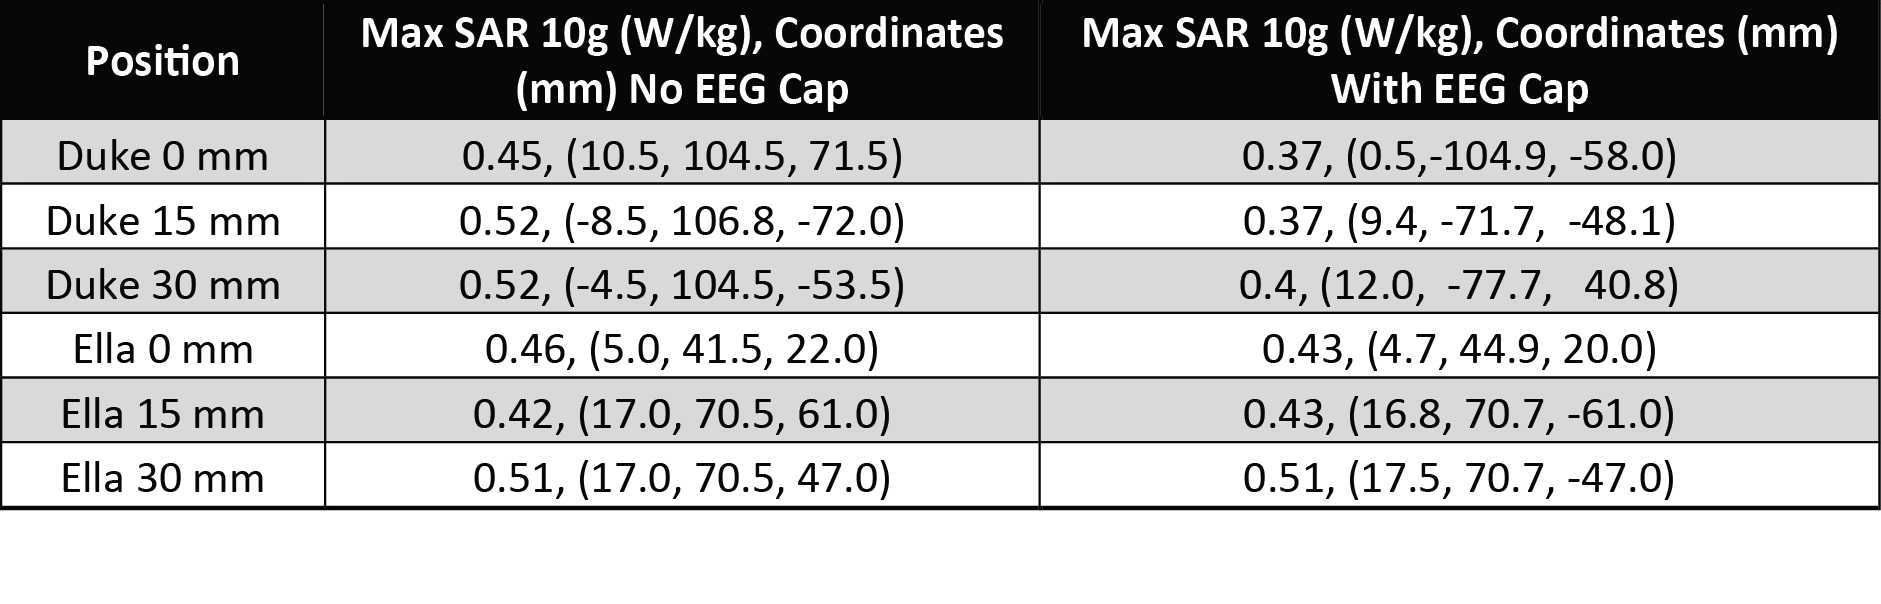
Adding the electrodes in the numerical domain attenuated the B1+ field by approximately 9%, reducing the peak value from 125 nT/V to 115 nT/V. However, the spatial distribution of the field remains unaffected (Figure 3). This is consistent with measurement, where a reduction in transmit efficiency of 10% was measured. In Figure 4 the slice locations where the maximum SAR10g was observed are shown for Duke and Ella at the isocenter position. The maximum SAR10g was 0.52 W/kg for a 1W input in the Duke model 15mm into the coil. The inclusion of the EEG cap altered the location of the maximum SAR in the Duke model, where it is now located at the posterior, in a position close to the overlap between coils and electrodes. This is likely due to the larger volume of the Duke model. The Ella model, with a smaller head does not show such a change in the peak SAR location. In both cases the SAR is reduced at the 0mm position with the cap, which is to be expected due to its shielding effect, then increases slightly as the head position moves into the coil. A summary of the peak SAR10g values and locations is shown in figure 5.Discussion
Phantom simulations and measurements of the coil B1+ field does not show local influence caused by the inclusion of EEG cap. Similar behavior was seen on the body models in different positions. From these data and the measurements we can establish the safety margin that will be included in the coil file during healthy volunteer scanning as the K-factor. The safety margin includes factors for subject variations, measurement error tolerances, EEG factor and model variations which gives us an overall factor of 3.4 and a k-factor of 1.8, which is a conservative estimate. While these results demonstrate that the EEG cap does influence the distribution of the SAR, we do not see any significant increase in the overall magnitude and they provide a strong basis for the overall safety and fundamental design of this coil and EEG system, allowing development of EEG-fMRI study using this coil to continue through healthy volunteer imaging.Acknowledgements
No acknowledgement found.References
1. Pisauro M, Fouragnan E, Retzler C et al. Neural correlates of evidence accumulation during value-based decisions revealed via simultaneous EEG-fMRI. Nat Commun 8, 15808 (2017)
2. Fouragnan, E., Retzler, C., Mullinger, K. et al. Two spatiotemporally distinct value systems shape reward-based learning in the human brain. Nat Commun 6, 8107 (2015)
3. F. Pittau et al., ‘Simultaneous Eeg and Functional Mri at Ultra-High Field (7t) in Epilepsy: Feasibility and First Results’, Epilepsia, vol. 57, pp. 24–25, Dec. 2016.
4. J. Jorge, F. Grouiller, R. Gruetter, et al. ‘Towards high-quality simultaneous EEG-fMRI at 7 T: Detection and reduction of EEG artifacts due to head motion’, Neuroimage, vol. 120, pp. 143–153, Oct. 2015
5. Avdievich A, Giapitzakis I, Pfrommer A et al. Decoupling of a double‐row 16‐element tight‐fit transceiverphased array for human whole‐brain imaging at 9.4 T. NMR in Biomedicine. 2018:31:e3964
6. Paterson, Gavin, McElhinney, Paul, Philiastides,Marios G, et al. A tight-fit 8-channel transceiver array for simultaneous EEG-fMRI at 7-Tesla, ISMRM, August 2020
7. M. C. Meyer, R. Scheeringa, A. G. Webb, et al. ‘Adapted cabling of an EEG cap improves simultaneous measurement of EEG and fMRI at 7T’, J. Neurosci. Methods, vol. 331, p. 108518, Feb. 2020
8. Jorge J, Grouiller F, Ipek O et al. Simultaneous EEG–fMRI at ultra-high field: Artifact prevention and safety assessment. Neuroimage 105 (2015) 132-144.
Figures