2289
Numerical Simulation study on the effects of intentionally inhomogeneous E-field distributions on RF-induced heating of implants1MRI-STaR Magnetic Resonance Institute for Safety Technology and Research GmbH, Gelsenkirchen, Germany, 2General and Theoretical Electrical Engineering (ATE), University of Duisburg-Essen, Duisburg, Germany, 3MR:comp GmbH, Gelsenkirchen, Germany
Synopsis
RF-induced heating of implants is strongly dependent on the E-Field magnitude at the test location, which is why a universal ±1dB and ±20° phase shift target field value limit is applied. We used numerical simulation to vary the exposing E-Fields, while keeping a constant average E-field magnitude at the test location. Strong deviations in heating development could be observed. In a second step we added phase shifts between exposition sources.
The results suggest that, in addition to the limits, the exact field distribution especially the E-field directions should also be taken into account in critical inhomogeneous cases.
Introduction
MRI imaging is generally considered safe; however there are certain complications with the RF-induced heating of implants. The standards ISO/TS 109741 and ASTM-F2182² define laboratory systems that can mimic the electrical RF-fields of an MRI system. These E-fields should be as homogeneous as possible (± 1dB in Magnitude, ±20° in phase1), which is naturally restricted by engineering limits. For evaluation, simulations with explicit inhomogeneous E-fields were performed. The exposure parameters are varied in diverse ways, while the mean E-field value over the object length remains constant. The second intention is to investigate, if phase differences between RF sources could be used as an effective approach to apply tailored E-field distributions to test objects in an otherwise strictly static setup.METHODS
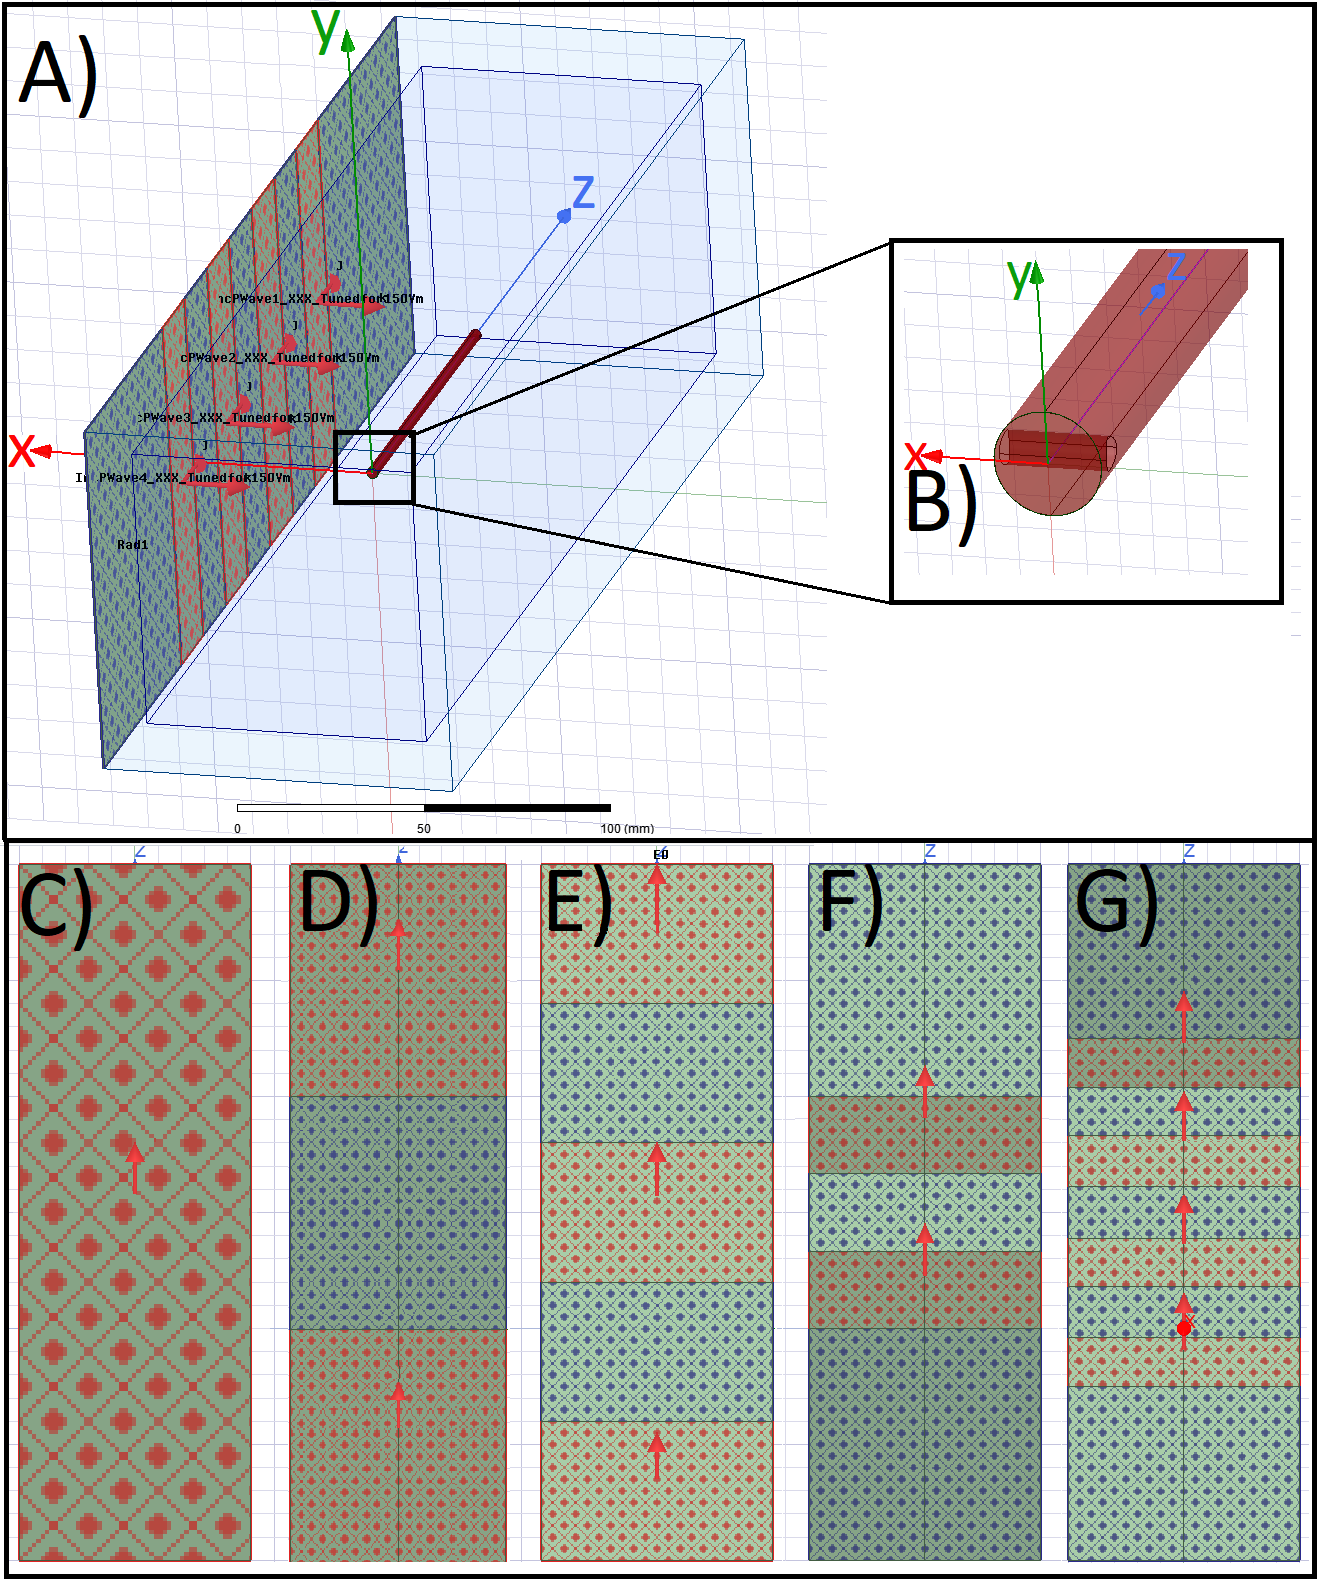
EM simulations are carried out at 64MHz by coupling Ansys HFSS and ICEPAK via the Volume Loss Density (VLD). The setup is based on the ASTM-F2182 Interlab study3: simulation box size 100x100x300mm³, one-sided PlaneWave (PW) excitation (Ê in z-dir; k in x-dir.), centrally placed 100mm titanium rod, starting temperature 20°C, heat flow disabled and a gelled saline medium (σ=0.47S/m, εr=1, c=4181J/kg°C) (FIG.1). RF heating is determined at the holes of the titanium rod.The simulation volume is surrounded by Perfect Matched Layers (PML) boundaries, with the exception of the Plane Wave excitation side, where HFSS standard “radiation” boundaries are used. After converging (factor 0.01), the calculated VLD is exported to ICEPAK in a reduced EM export volume (80x80x280mm³), to prevent interactions with the RF boundaries. Icepak calculates the transient heat flux in 5s steps up to 900s.
PW sources are varied (FIG.1) to achieve different inhomogeneous distributions. Simulations without the test object are carried out to scale the PW sources to 150V/m (Erms) along a 100mm central line. Following this, the effect of phase shifts (PS) between two PW sources on the E-field distribution and heating are investigated, by reusing the dual PW setup (FIG2.F). One PW source remains constant; while the other shifts its phase from ‑45° to 45° in 5° steps.
RESULTS
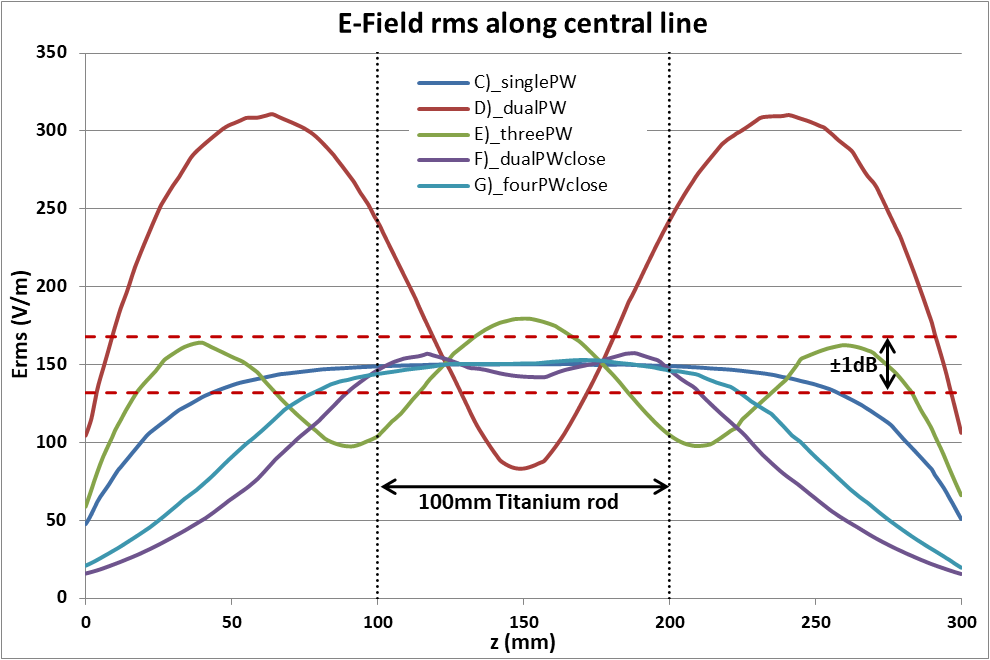
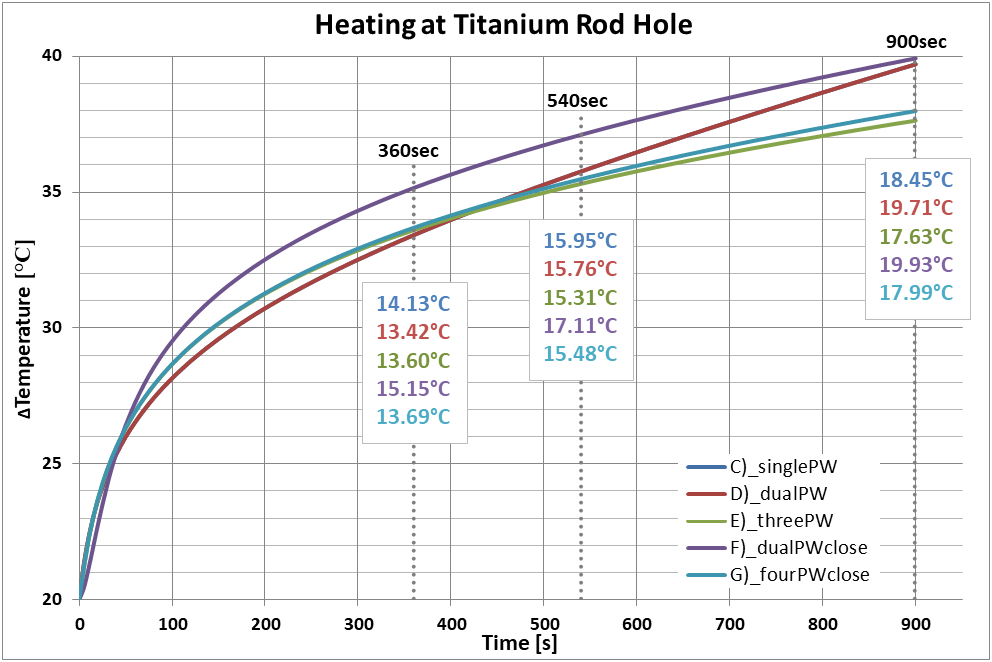
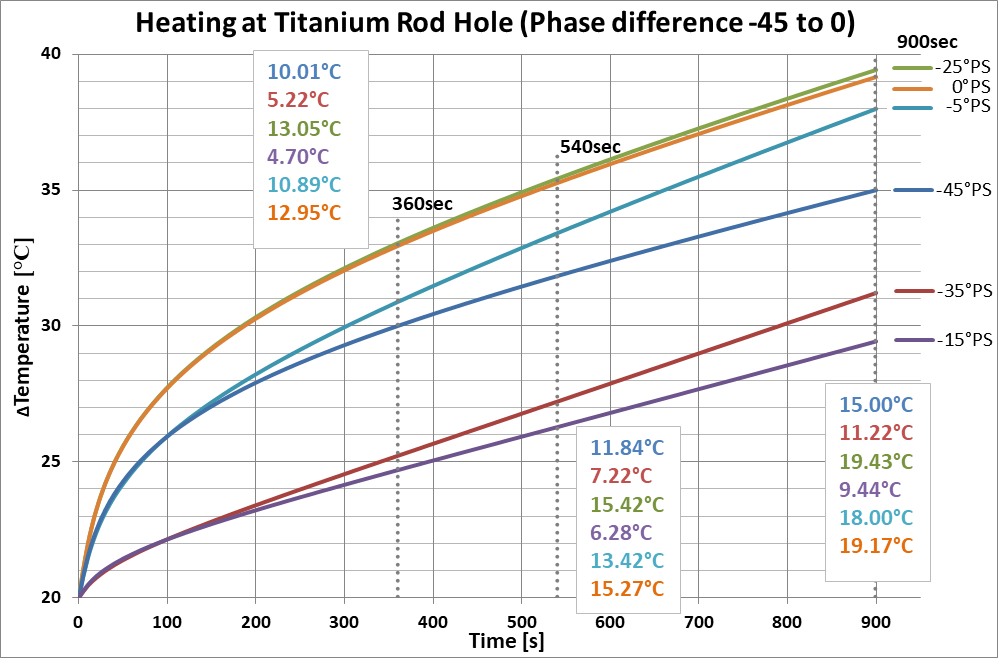
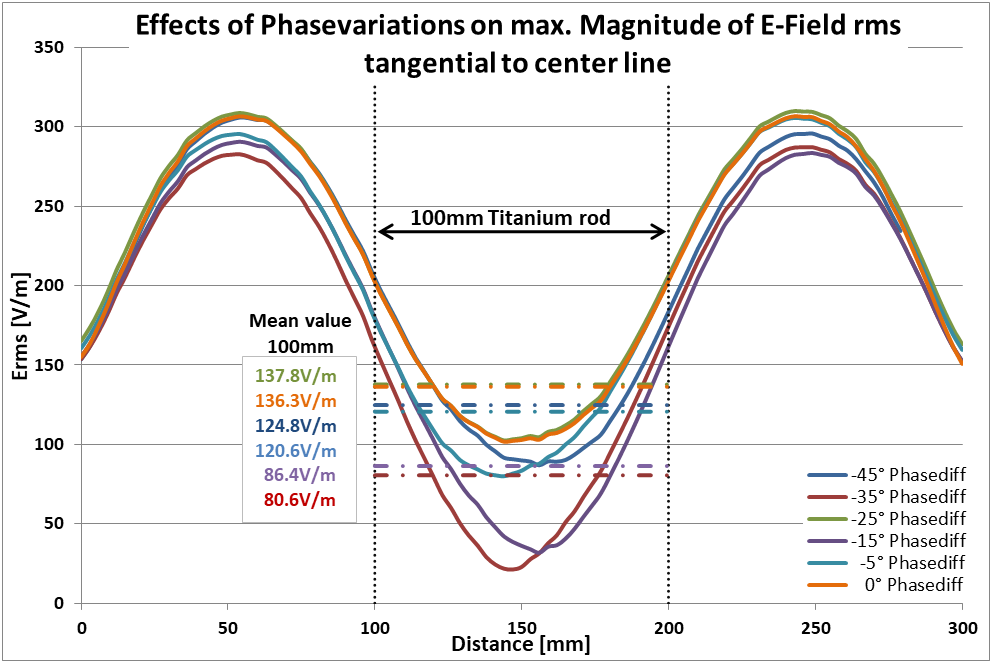
In FIG.2 the E-field sources are matching the geometric arrangement of the PW sources. Only two excitation setups have deviations outside of the 150V/m ±1dB limit along the central line (100mm to 200mm). The single PW and the 4 PW source setup show a nearly constant Erms (C&F). The dual source PW setup (D) shows the highest E-field variation. FIG.3 shows the corresponding RF heating curves. Although all setups were tuned to 150V/m and show a similar progress, except for setup (D), they reach different temperatures, even between the similar single and four PW source setup. The maximum temperature difference after 900sec amounts to 2.30°C.The temperature differences of the RF heating curves of the phase shifted PW sources are distinctly higher (FIG.4), only a few representing curves are given. Although the -25° PS and the 15° PS are quite close to each other, the temperature difference is 9.99°C after 900s. The order of the phase shifts is not mirrored in the order of the temperature curves. The -25° PS and the in-phase case are forming the upper end of the scale, while the -15° PS and -35° PS form the lower end. Since only the 0° PS is tuned to 150V/m the tangential maximum E-field magnitude is plotted along the phantom in FIG.5. The order of the averaged E-field values agrees with the order of the heating values, except for -45° PS and -5° PS, which switch places. Considering these: A deviation of only 4.2V/m mean, max tangential Erms can lead to a heating difference of 3.0°C.
DISCUSSION
The results of the evaluated PW setups with in-phase excitations show a similar temperature rise with a deviation of 2.3° C. This could be due to the fact that only the tangential E-field components lead to RF Heating. The tuned Erms always remains constant, but with different PW sources the scattering of the E-field increases and is not strictly in tangential direction.This scattering and “mismatch” between multiple sources is also the focus of the phase shift analysis, where this behaviour is forced. The phase differences cause unpredictable variations in E-Field magnitude and heating, even inside the 20°PS limit. Once understood, this behaviour might be used to arbitrarily generate E-field distributions. In a future work this should be examined more closely with PS variations tuned individually to 150V/m and a focus on the relationship between the magnitudes, the field directions and the individual field components (cf. -5° PS & -45° PS).Noting: Despite the exact same setup there seems to be a calculation error in the HFSS/ ICEPAK parameter sweep used for phase shifting. The 0° PS and curve D) should be identical D), but differ around (~2-4%).
CONCLUSION
Solitary specifications such as averaging along a central line and a limit of 1dB and 20% Phase shift may not be sufficient for extremely inhomogeneous sources and phase shifted excitation sources. In such cases, RF-induced heating can no longer be connected to the test object characteristics but are rather arbitrarily. A more detailed analysis should be carried out.Also phase variations between sources might be used to force certain E-field behaviour.
Acknowledgements
No acknowledgement found.References
1. Technical specification ISO/TS 10974:2018 “Assessment of the safety of magnetic resonance imaging for patients with an active implantable medical device”. The International Organization for Standardization. 2018.
2. ASTM F2182-19e2 “Standard Test Method for Measurement of Radio Frequency Induced Heating On or Near Passive Implants During Magnetic Resonance Imaging”. ASTM international. 2019.
3. Murdock K, Gross D, Leewood A, et al. Computational modeling of RF-induced heating due to a titanium-alloy rod: An Interlaboratory Comparison for the ASTM F2182 task group. ISMRM 27th Annual Meeting & Exhibition, May 2019, Montreal, Canada. 2019.
Figures