2284
Validation of a new 64MHz RF exposure system for testing medical implants for RF-induced heating according to ASTM-F2182 and ISO/TS 109741MRI-STaR - Magnetic Resonance Institute for Safety, Technology and Research GmbH, Gelsenkirchen, Germany, 2TU Dortmund University, Dortmund, Germany, 3MR:comp GmbH, Testing Services for MR Safety & Compatibility, Gelsenkirchen, Germany
Synopsis
To
determine the RF-induced heating of implants, it is necessary, that the RF
field source used for testing fulfills several requirements. This study
introduced the validation of a new developed linear exposure system for testing.
The results for E-Field distributions from numerical simulations are validated experimentally
by measuring these E-field distributions. Furthermore, the temperature rise at
the 100mm titanium rod is compared with the target values form ISO/TS 10974
Annex I.
The system fulfills the requirements and is suitable for testing active and
passive implants for RF-induced heating according to ASTM F2182 and ISO/TS
10974.
Introduction
One of the safety issues for patients with implants during an MRI examination is RF-induced heating. For testing these implants, an appropriate RF-source, producing an electromagnetic field, is necessary. Typically, a MR scanner or a stand-alone RF birdcage coil system is used.This study introduces an alternative RF field source and its validation for testing all kinds of implants for RF-induced heating.
Methods
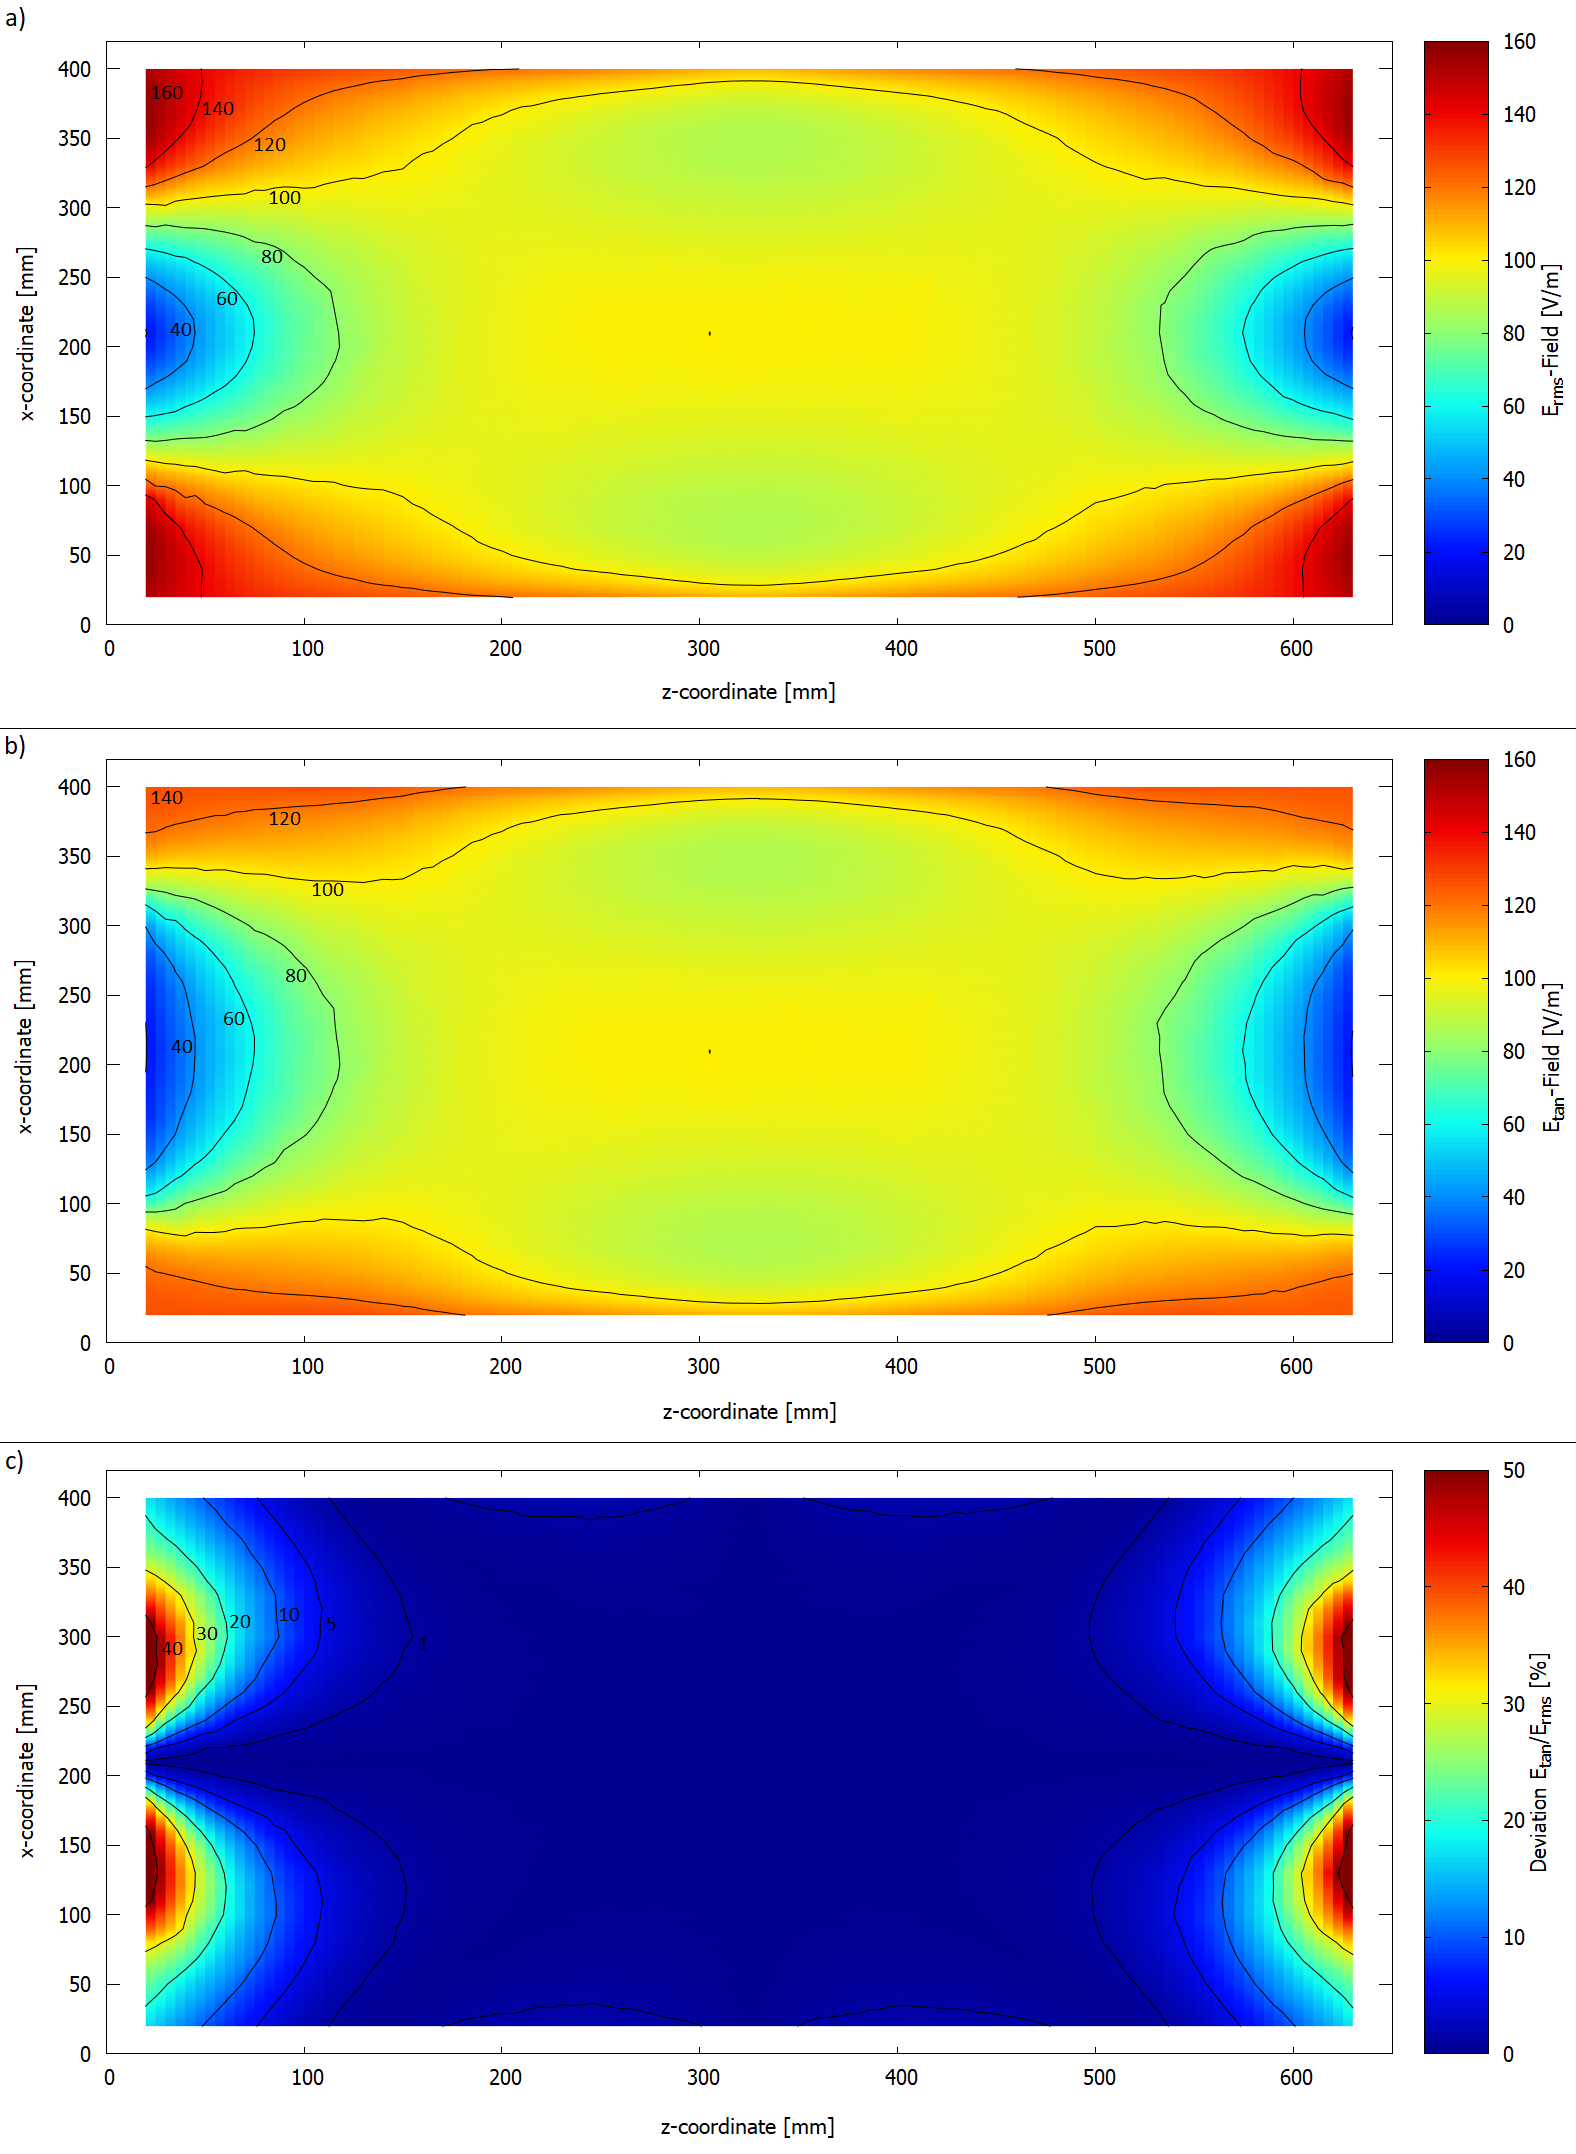
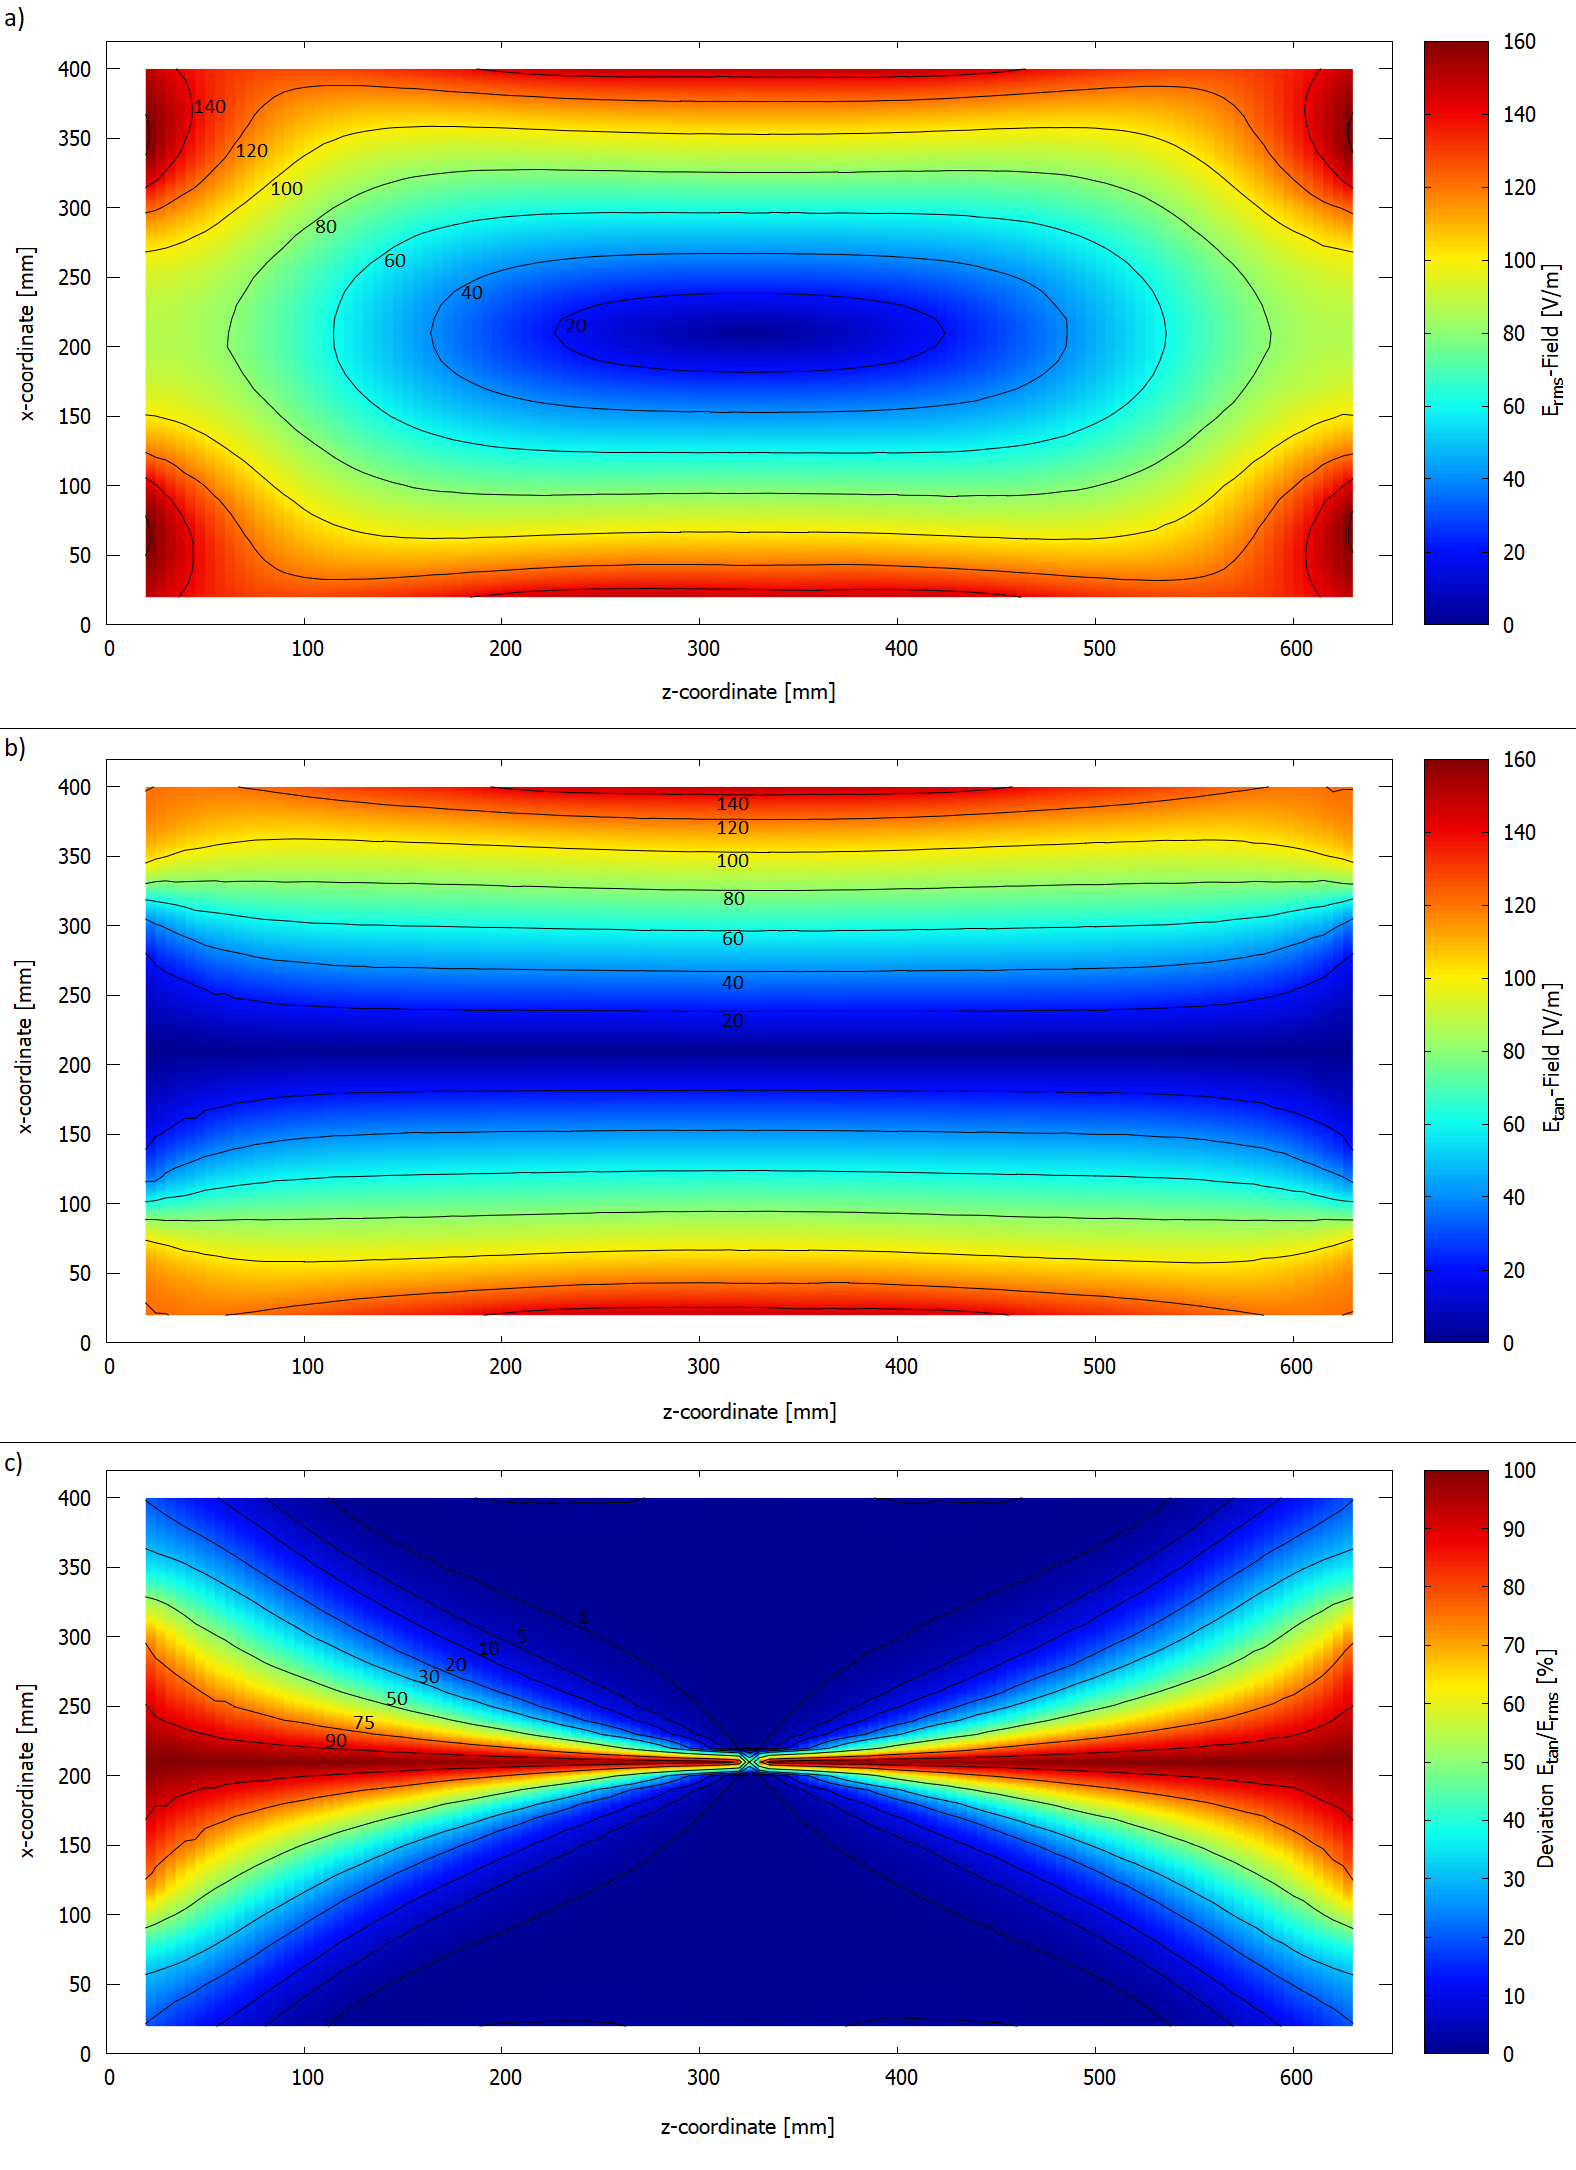
Requirements to a RF-field source are described in ISO/TS 109471 and ASTM-F21822 for active and passive implants. Incident field variation over the entire implant volume should be less than ±1dB. Ideal exposure configuration provides nearly uniform tangential electric field incident along the test object1.Numerical simulations with Ansys HFSS were used to develop a Linear Exposure System (LES). This system consists of two independent channels and is attached to the walls of an ASTM phantom (420mm x 90mm x 650mm). Erms- and Etan,z-field (in z direction) distributions were simulated for the xz-plane at central height (45mm) with 10mm x 5mm spatial resolution and 20mm distance to walls. This was done for two different phases 0° and 180° between channels.
After construction, the simulated values were measured experimentally with an Erms probe (SAR Probe, EX3DV4, SPEAG). Input power 45dBm, phantom dimensions and electrical properties (σ=0.47 S/m) of saline solution were identical to the simulations.
In a second measurement a 100mm titanium rod (SAIMD-21,2) is centrally placed in the phantom parallel to the z-axis. At this location, the field is homogeneous and due to large distance from the wall, reflections effects are avoided3.
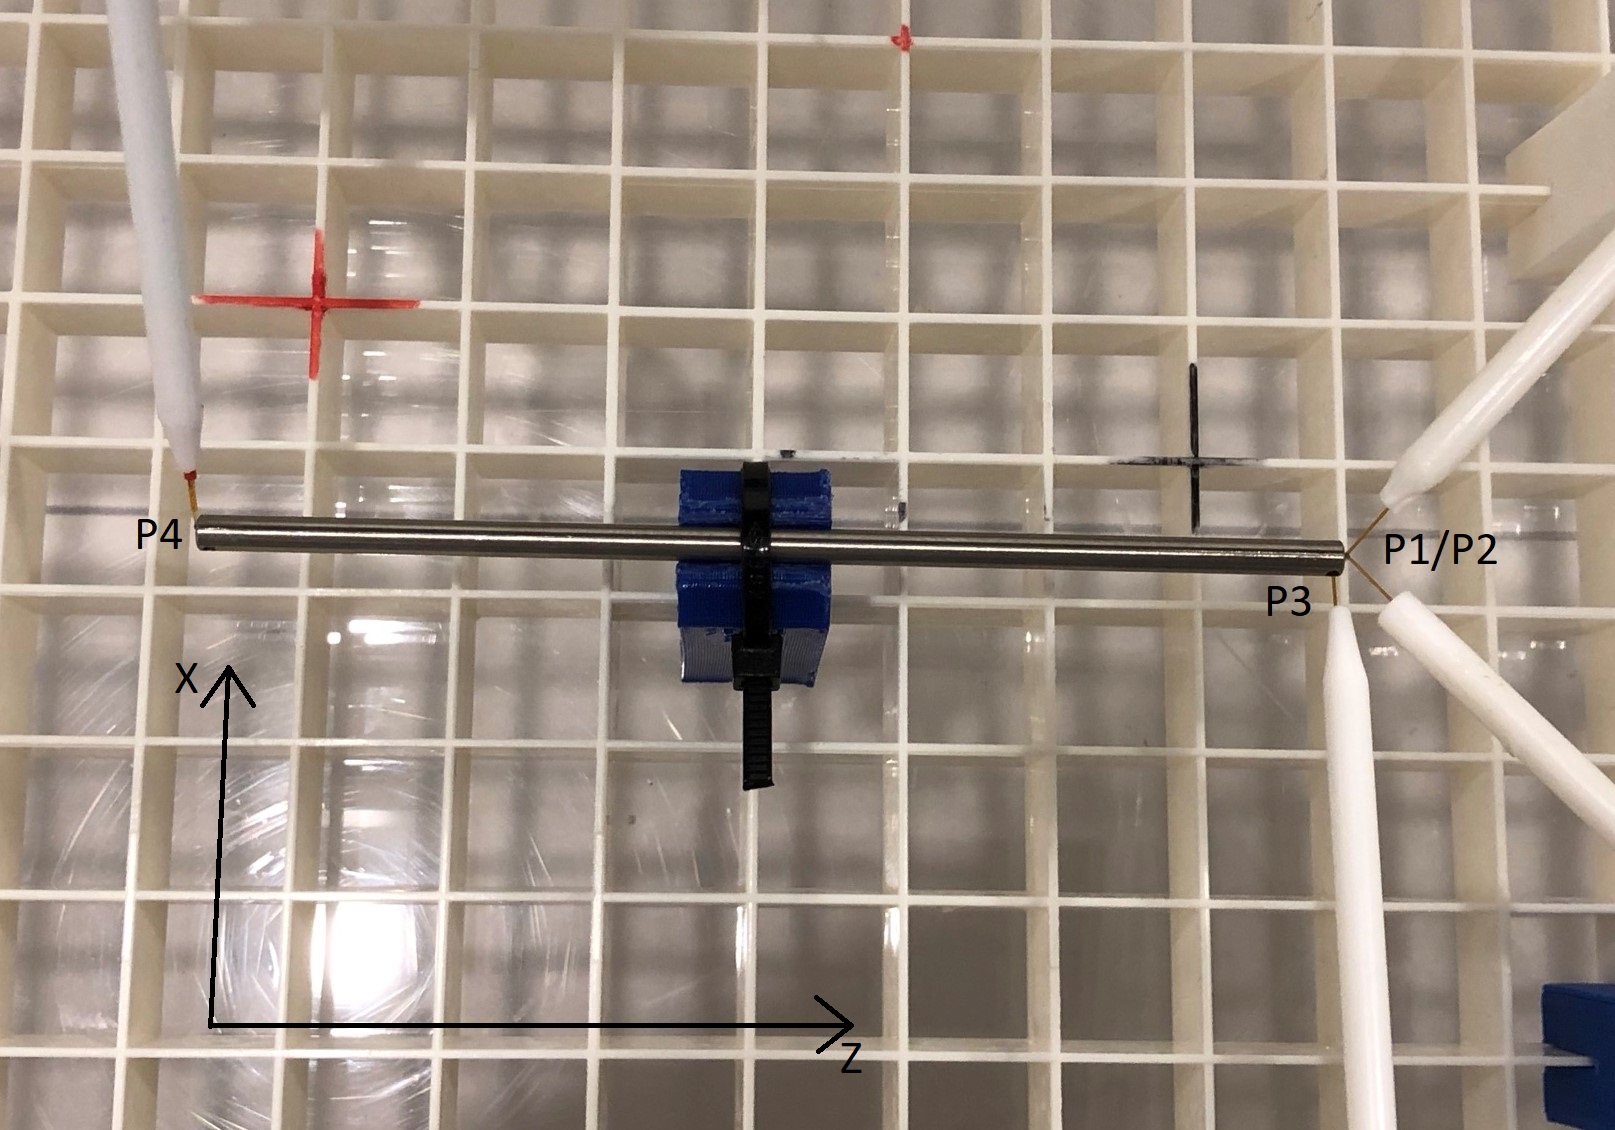
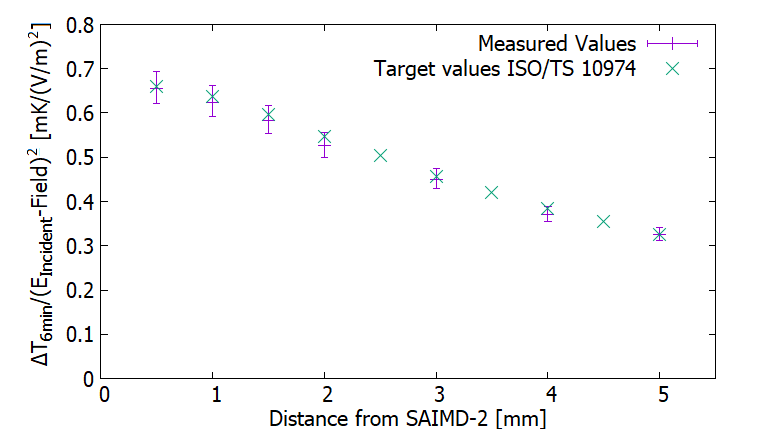
Four fiber optic temperature probes P1-P4 were used to measure the temperature rise (cf. Fig. 1). P1 and P2 were placed at one axial rod tip and P3 inside the hole on the same side. P4 was placed axial at the opposite tip. Seven 360s test runs were performed. After each test run P4 was moved distally away from the rod (0.5 to 5mm). Incident field was calculated from the temperature rise of an additional test run, where the rod was removed but the temperature probes remained in positions. Temperature rise at each probe and position is normalized to the square of incident E-field. These values are compared to the target values for the SAIMD-2 in Annex I2 from an ideal plane wave simulation.
Results
Simulated Erms-Field distributions are shown in Fig. 2a/3a, Etan,z-field distributions in Fig. 2b/3b and deviations in Fig. 2c/3c for 0°/180°, respectively.Erms-field distribution varies over phase relations. At 0° the Erms-field is homogeneous over a large area in the phantom middle. Etan,z-field distribution shows the same behavior. Deviation between Erms- and Etan,z-field for 0° is less than 1% for almost the entire plane. Thus, Erms-field equals Etan,z-field. E-field variation between the 80V/m and 100V/m isolines is inside ±1dB.
Erms-field distribution for 180° varies substantially from 0°. The distribution is homogeneous along elliptical lines and decreases towards the phantom middle. Etan,z-distribution is homogeneous along z-axis along the entire phantom. The deviation between Erms and Etan,z varies over the plane. There is a larger area, where deviation is less 1%, but it increases in x-direction.
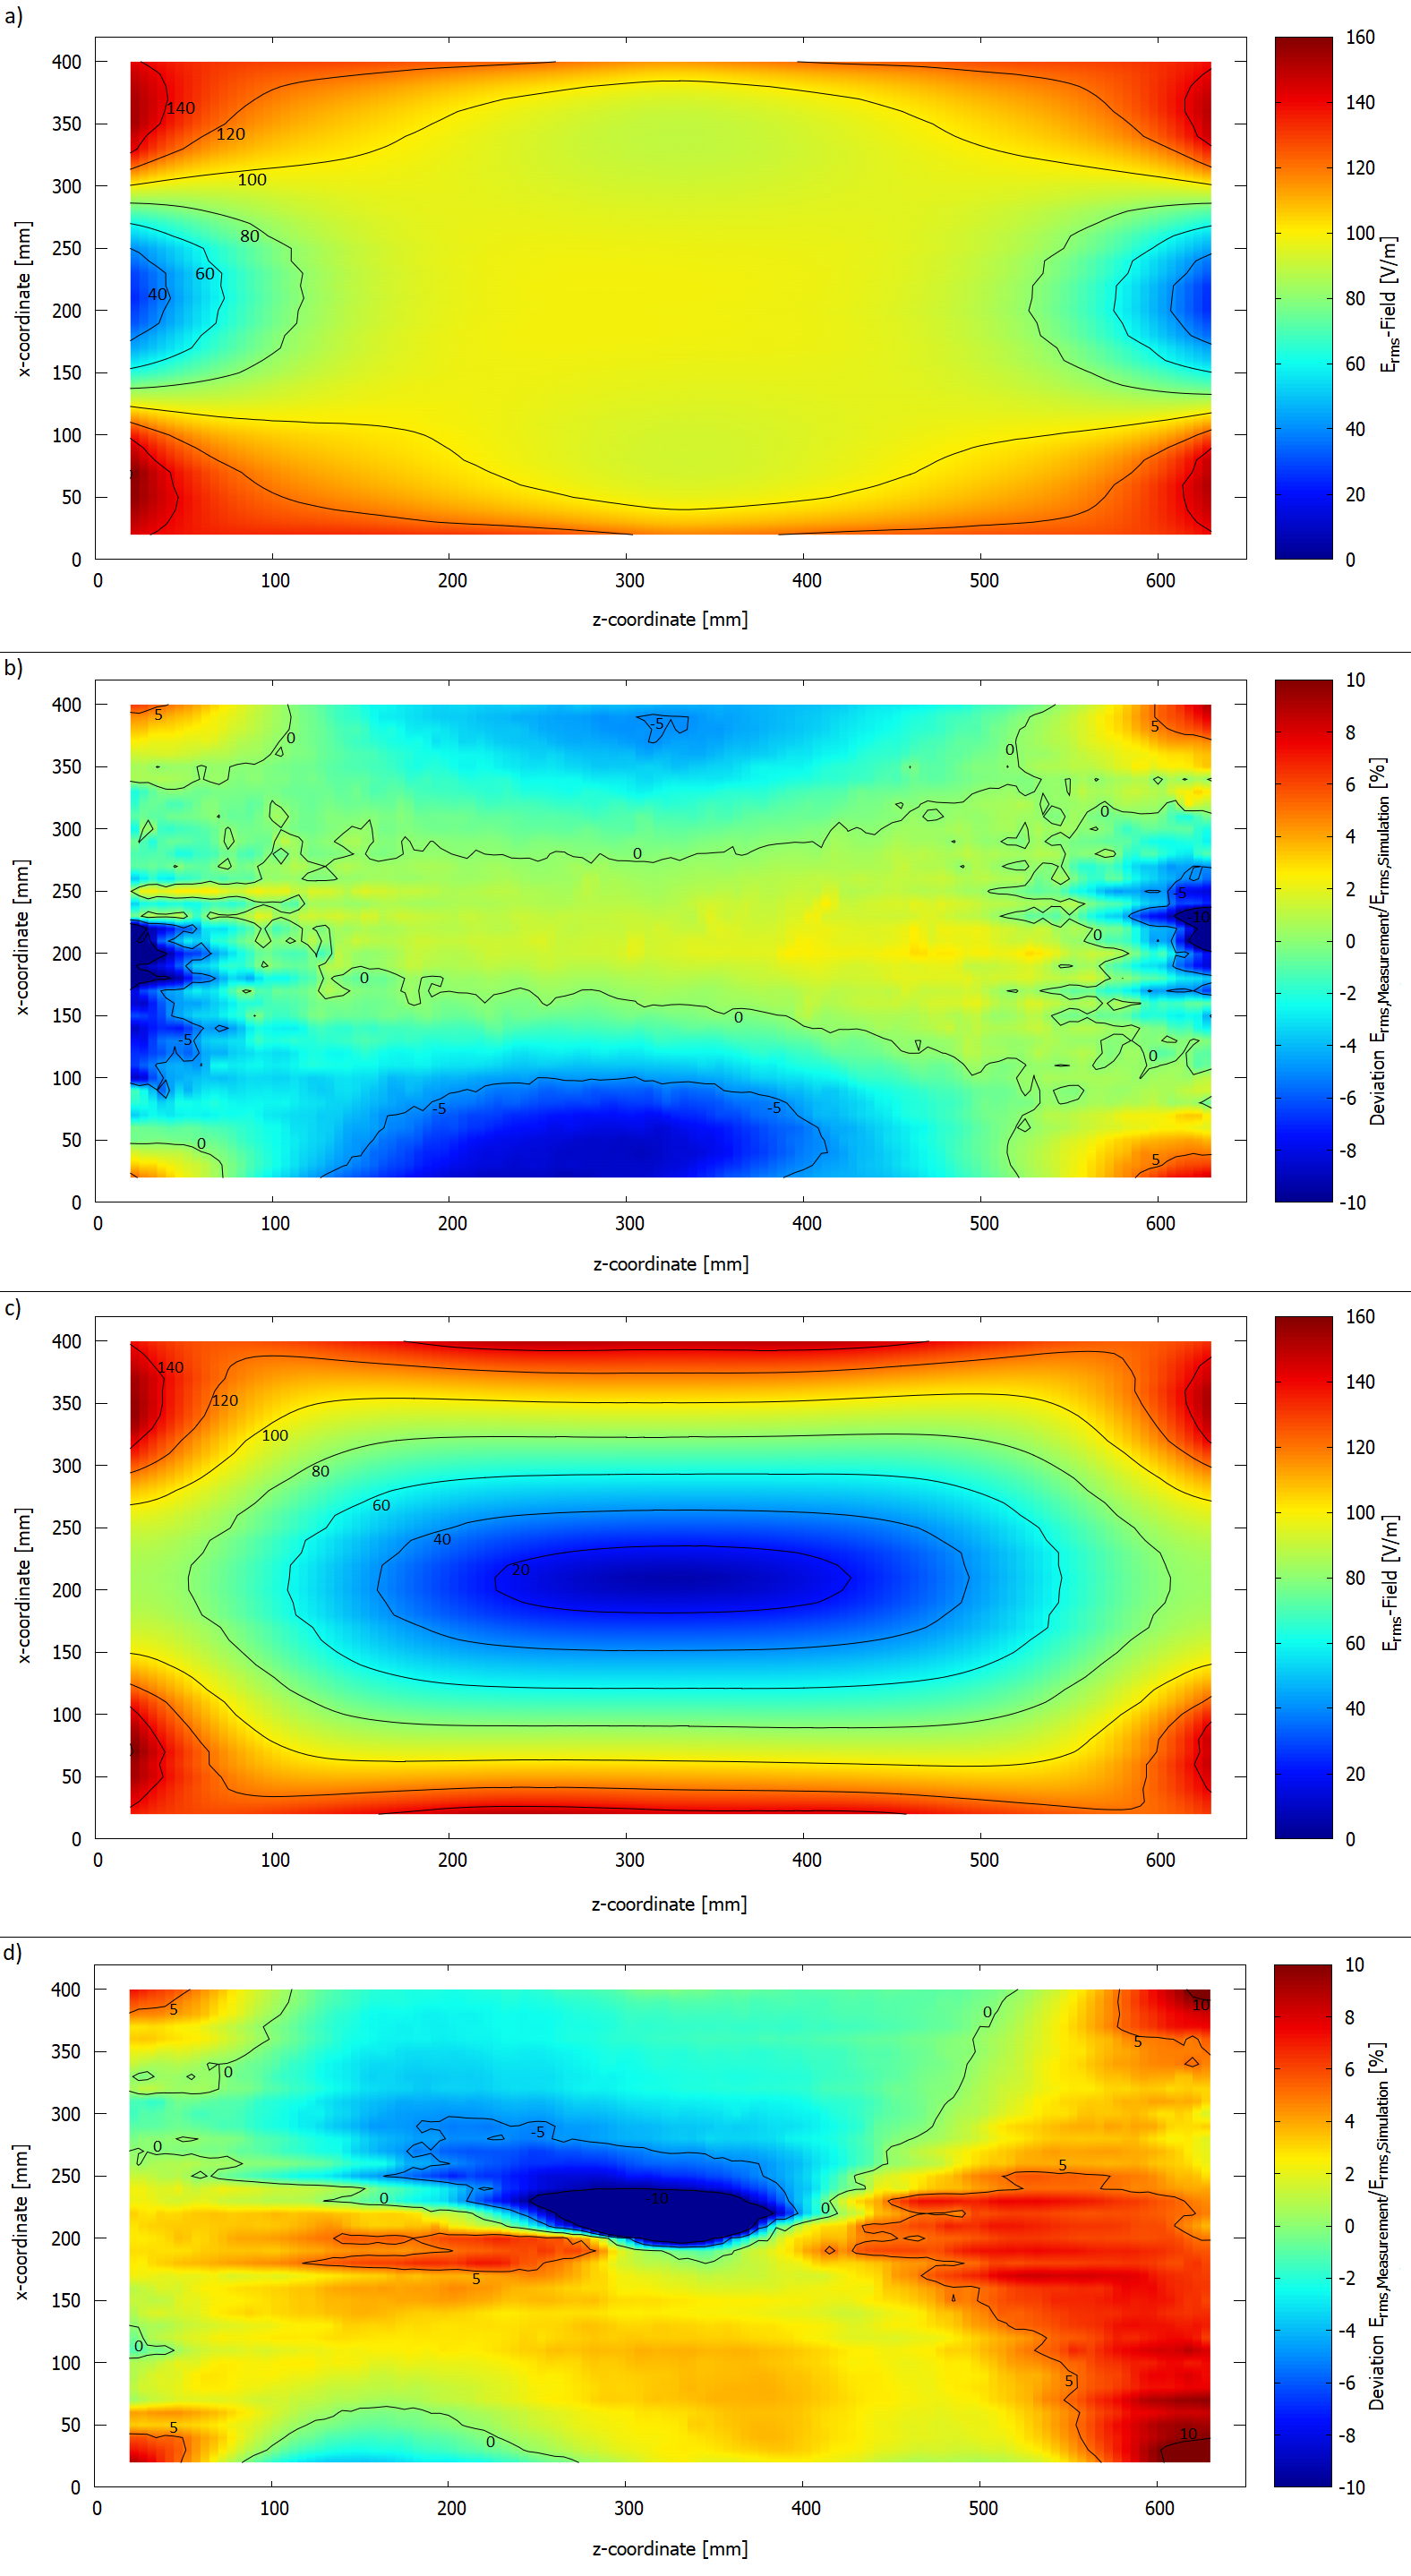
The measured Erms-field distributions are shown in Fig 4a/c and the deviation between simulation and measurement is shown in Figure 4b/d for both phase relations 0°/180°.
The measured Erms-field distributions are similar to the simulated distributions for both phases. Fig. 4b shows a deviation for 0° of ±5% over the entire plane except the corners. For 180°, Fig. 4d shows a larger deviation, which is still mostly inside ±5%. In corners and at the isocenter, deviation increases to ±10%.
For temperature measurements the incident E-field is 162.51±5.5 V/m. Temperature rise at P4 is divided by the square of incident field at each position. These values and target values exported from Annex I1 are shown in Fig. 5.
The target value for the rod hole is 0.621 mK/(V/m)2 and the measured value at P3 0.629±0.008 mK/(V/m)2. For P1/P2 the measured value is 0.652±0.012 mK/(V/m)2 and target value at 0.5mm is 0.66 mK/(V/m)2.
Discussion
The results in Fig. 2 and Fig. 3 show, that E-field distribution varies with phase. The Erms-values are equal to Etan,z-values over most parts of the phantom. The measurements confirm and validate the simulation results for the Erms-field distribution within deviation of ±5% and therefore also Etan,z-distribution. In addition, the results in Fig. 5 show that the new exposure system fulfills the requirements for testing implants according to 1,2.Conclusion
This study shows that the new RF-field source is able to produce different uniform tangential E-field distributions over a large area. The simulated E-field distributions are validated by measurements and the temperature rise at the rod reaches the target values. Due to almost no field variation, it is suitable for implants with small diameter and long wires as well as orthopedic implants with large 3D volumes.Acknowledgements
No acknowledgement found.References
1. Technical specification ISO/TS 10974:2018, “Assessment of the safety of magnetic resonance imaging for patients with an active implantable medical device,” The International Organization for Standardization, 2018.
2. ASTM F2182-19e2, “Standard Test Method for Measurement of Radio Frequency Induced Heating On or Near Passive Implants During Magnetic Resonance Imaging”, ASTM international, 2019.
3. M. Kozlov, M. Angelone, “Effect of Multiple Scattering on Heating Induced by Radio Frequency Energy”, IEEE T ELECTROMAGN C, Vol 62, No.5, October 2020.
Figures