2283
Radio-Frequency Induced Heating of Hip and Knee Implants in the Cylindrical and Planar Systems1Center for Devices and Radiological Health, US Food and Drug Administration, Silver Spring, MD, United States, 2Hitachi Healthcare Americas, Twinsburg, OH, United States, 3Healthcare Business Unit, Hitachi, Ltd., Tokyo, Japan
Synopsis
Radio-Frequency (RF) induced thermal injury is a common adverse event reported to US Food and Drug Administration. RF-induced heating risk depends on the interaction of implantable medical devices with electric field distribution in the MRI systems. A study showed that RF-induced heating of a neuromodulation device was much lower in the planar system compared to the cylindrical system. In this study, the hip and knee implants were studied in an anatomical human model at a 1.2T planar system and a 1.5T cylindrical system.
INTRODUCTION
Radio-Frequency (RF) induced thermal injury is a common adverse event reported to US Food and Drug Administration1. RF-induced heating risk depends on the interaction of implantable devices with electric field (E-field) in the MRI systems. Therefore, the RF safety risk of implants may differ when different coil designs are used. A recent study showed a significantly lower RF heating due to a neuromodulation device in the planar system2. In this study, the hip and knee implantable devices were examined using validated computational modeling. Specific absorption rate (SAR) results were compared in an anatomical human model between a 1.5T cylindrical system (64MHz) and a 1.2T planar system (49.5MHz).METHODS: Modeling Validation
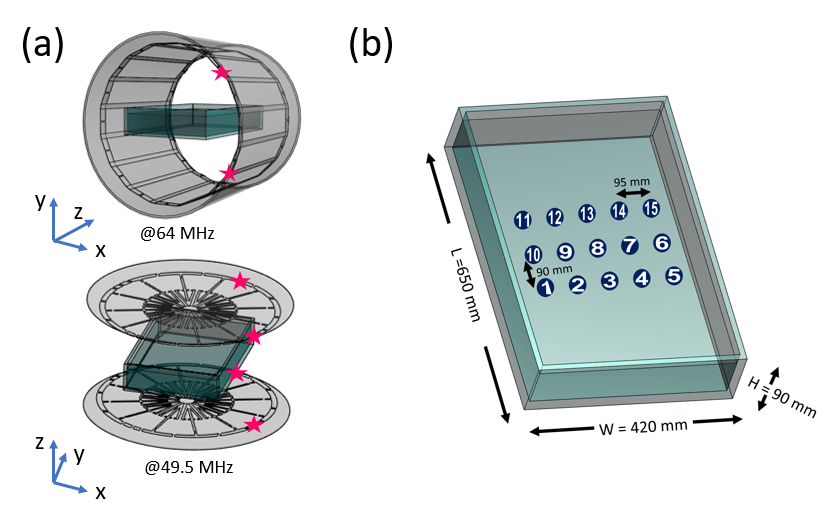
The MITS 1.5 64MHz birdcage coil (ZMT, Zurich, Switzerland) and the open-bore OASIS 1.2T MRI scanner (Hitachi Ltd) were used for measuring E-field and magnetic field (H-field) to validate the electromagnetic modeling setups. ASTM phantom was prepared with saline with a conductivity of 0.27S/m. Fifteen data points of E-field and magnetic field (H-field) were collected in the ASTM phantom using a hand-held measurement system with an E-field probe and an H-field probe (EASY4MRI, SPEAG, Switzerland) in both systems. The probe performance was confirmed using a transverse electromagnetic cell (Model 8802, Narda, USA). The corresponding models were prepared based on the physical coils3,4, and the coil and phantom setups are shown in Fig.1.The simulated values were scaled by the ratio of the average H-field values between simulation and measurement.
$$H'_{S}=H_{S}(\frac{\sum H_{M}}{\sum H_{S}})$$
$$E'_{S}=E_{S}(\frac{\sum H_{M}}{\sum H_{S}})$$
HS and HM are the simulated and measured H-field values, and ES is the simulated E-field value. The H'S and E'S values were used to find correlation between the measured and simulated E- and H- field values.
METHODS: Modeling with Implants
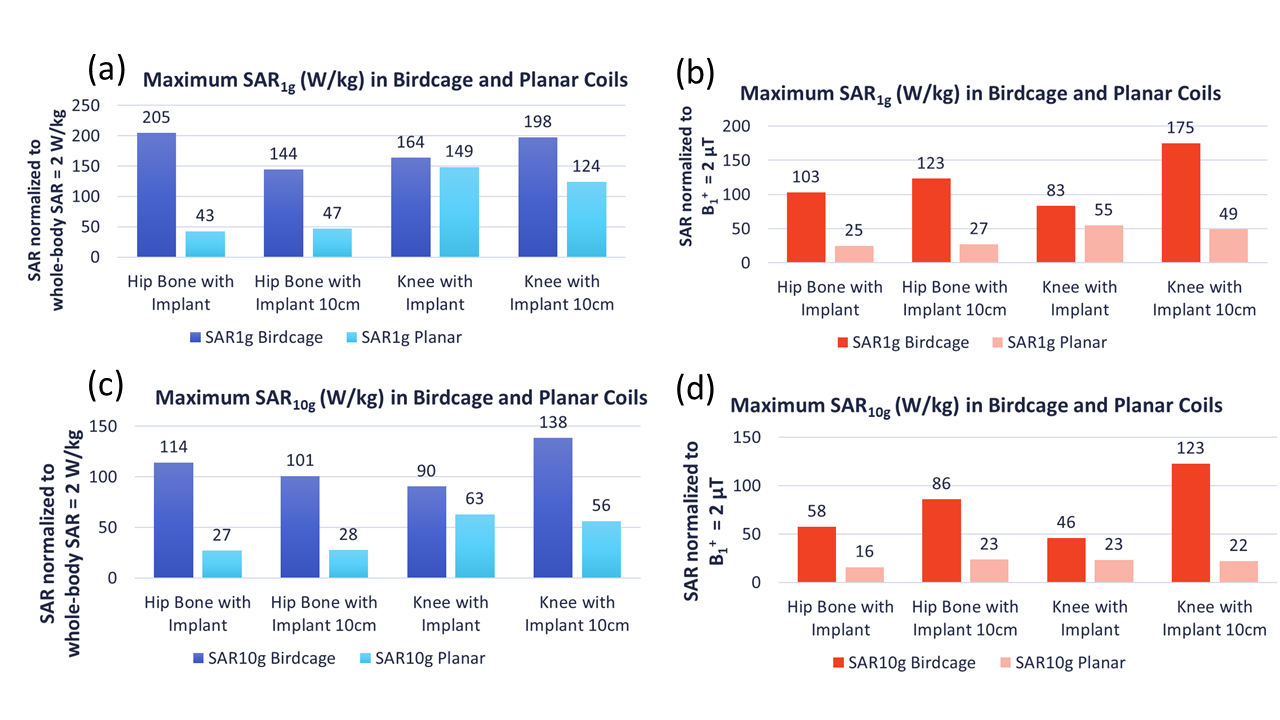
The generic models of hip and knee implantable devices were used along with the AustinMan body5. The effective length of the hip implant was 33.4cm, and the socket was 3.2cm in diameter. The effective length of the knee implant was 18.6cm. Both were modeled as titanium. All the modeling was done in the Sim4Life platform (V5.2.2, Zurich Med Tech, Switzerland). The Huygens’ Approach6 was used to calculate the incident field with an unloaded coil first, then used to compute fields within the body model with 2mm-isotropic grids. Two scenarios were simulated for each implant: (a) the imaging landmark at the center of the body and the hip or knee level and (b) the imaging landmark at the center of the implant (resulting in a 10cm side shift of (a)).The SAR results were further analyzed in MATLAB (Mathworks, MA, USA). The maximum 1g- and 10g-averaged SAR values (SAR1g and SAR10g) were calculated by using two normalization methods: whole-body SAR=2W/kg and a slice of B1+=2µT. The B1+ slice was determined in axial slice 6cm away from the iso-center, so the device is not included.
RESULTS: Measurement
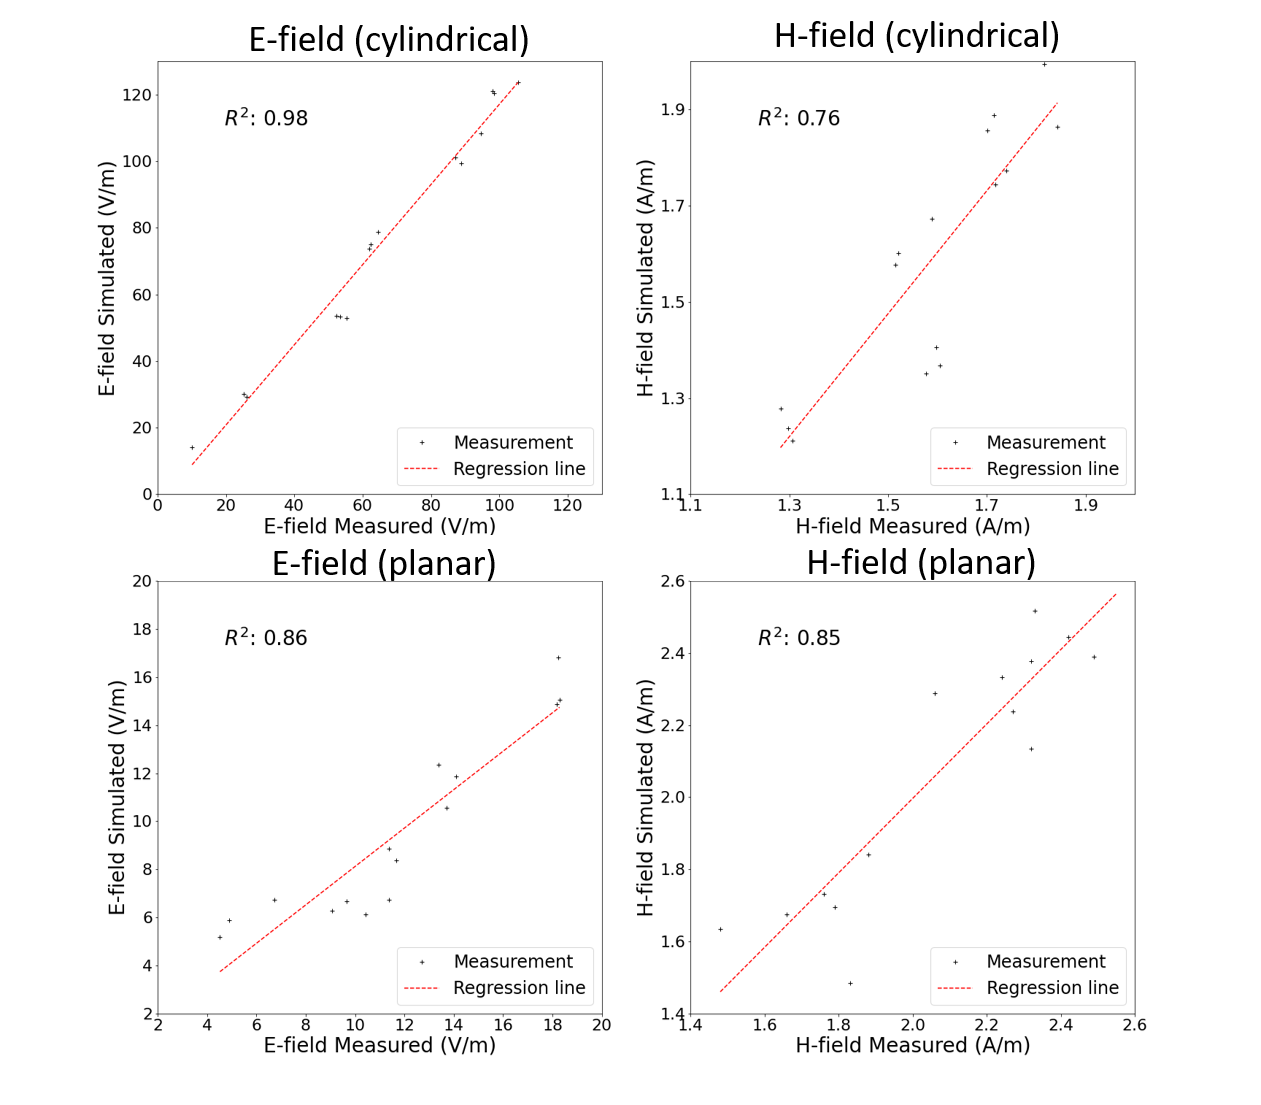
The scaled measurement results were compared with the simulation results (Fig.2). The correlation (R2) of the E-fields was 0.86 for the planar coil and 0.98 for the cylindrical coil. The correlation of H-fields was 0.85 for the planar coil and 0.76 for the cylindrical coil.RESULTS: Modeling
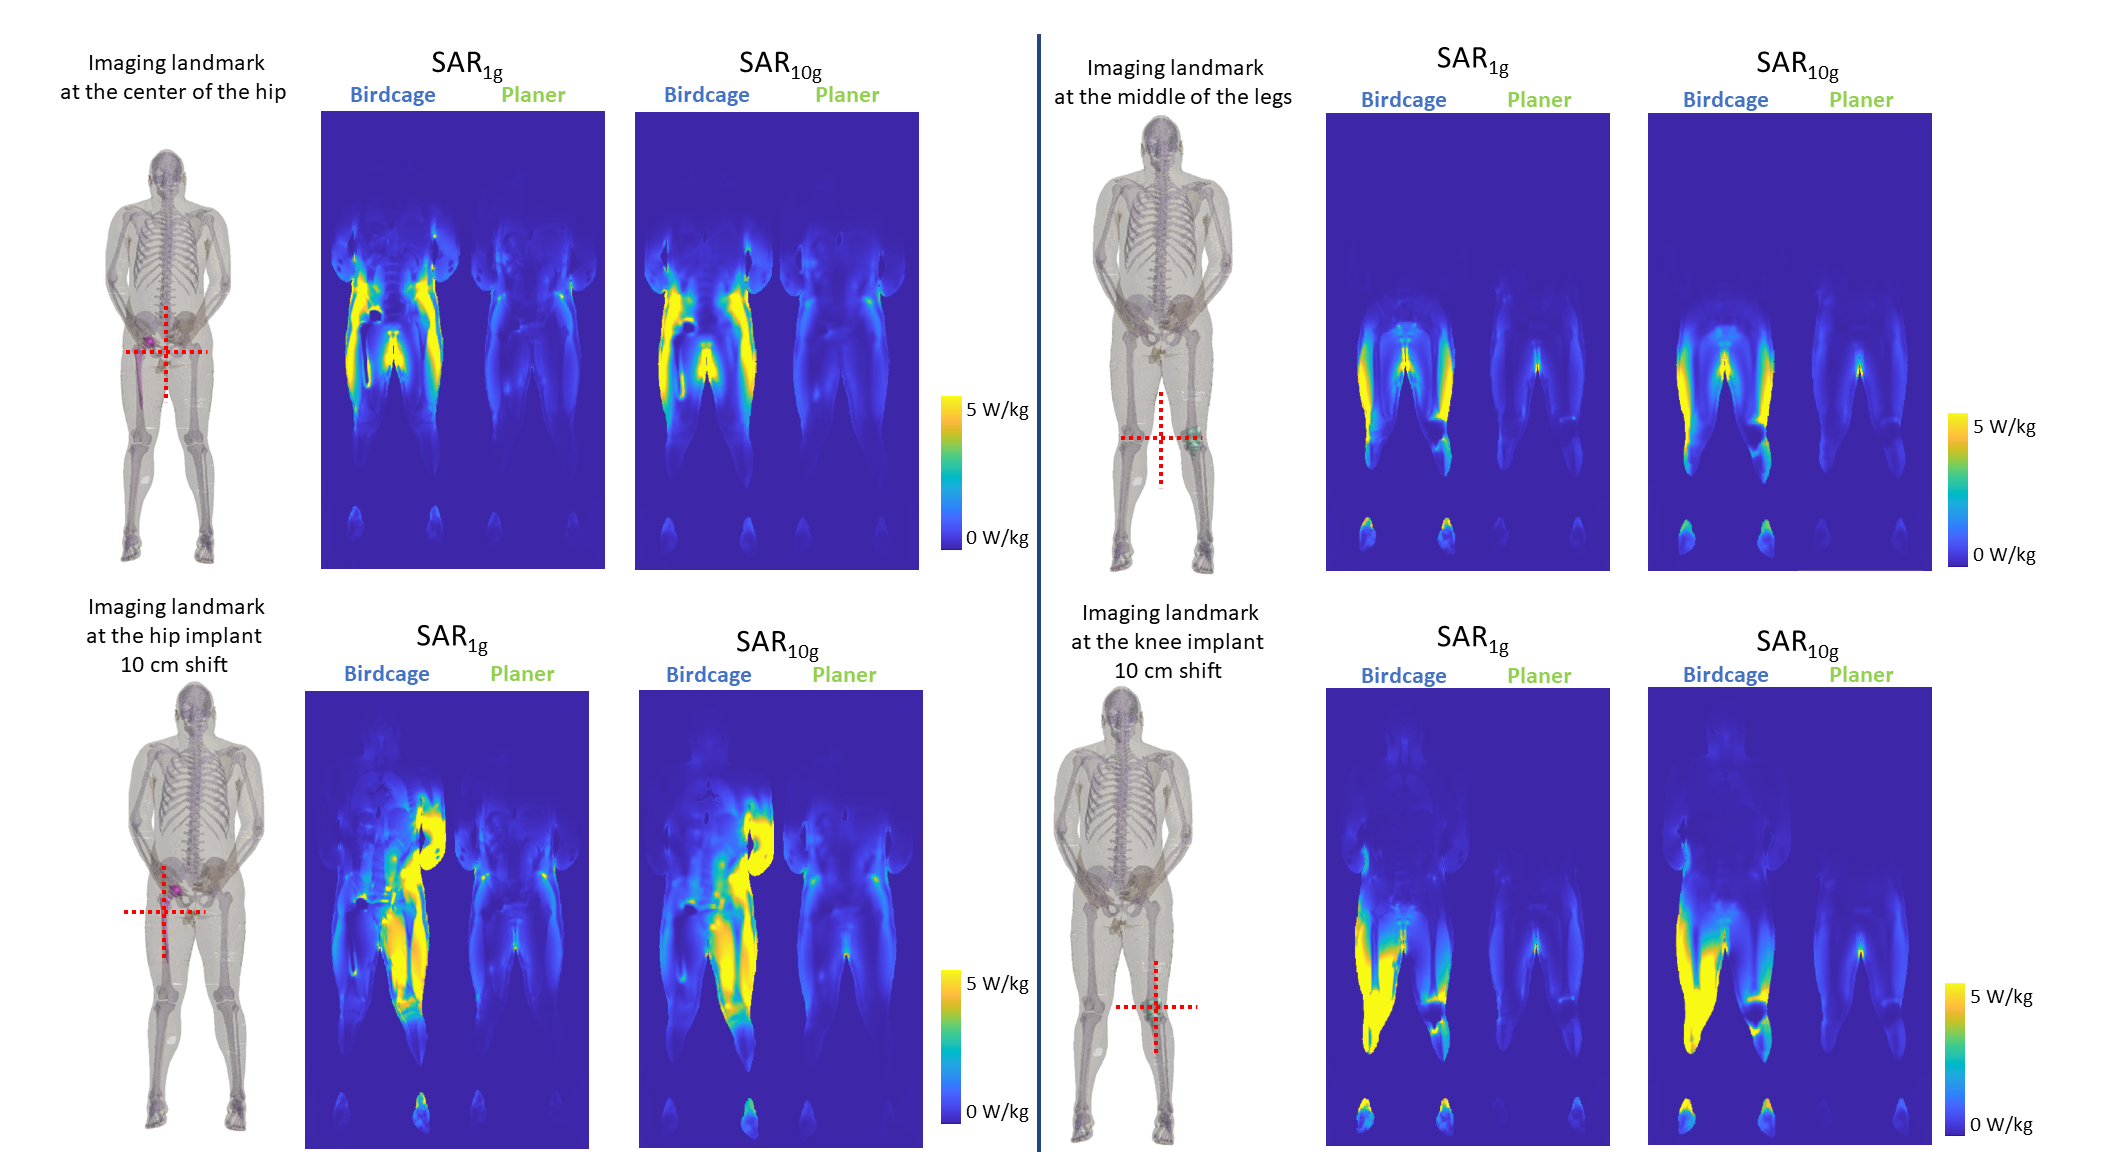
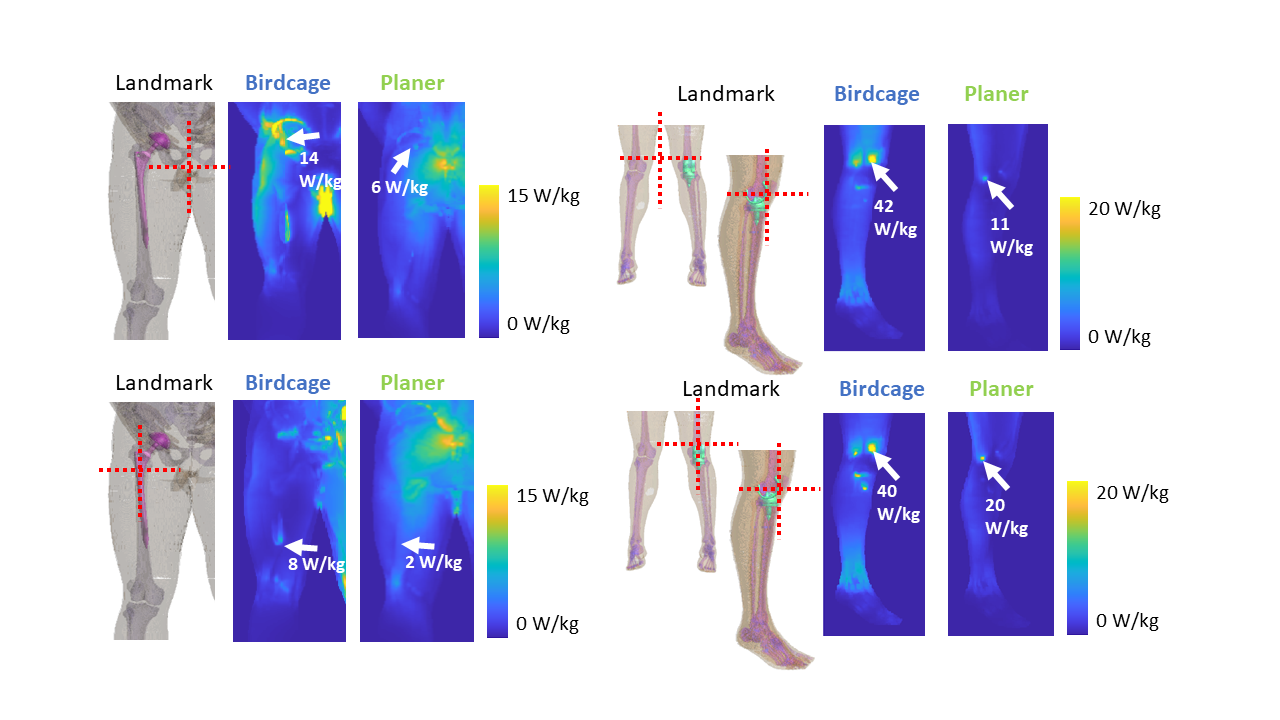
The maximum SAR1g and SAR10g results are shown in Fig.3. None of the maximum values were found near the implants. The maximum SAR values were observed at the body parts close to the coils, i.e. in the arms and legs for the cylindrical coil and in the back for the planar coil. The slice SAR1g and SAR10g maps at the implant locations showed that the presence of the implants resulted in a discontinuity in E-fields (Fig.4). Overall, the SAR values around the implants were much lower for the planar system. The maximum intensity projection maps of SAR1g showed the SAR values in the planar system were up to 75% lower than those in the cylindrical system (Fig.5).DISCUSSION
The potential RF heating induced by the two implant models used in this study were relatively low in both systems; however, the landmark differences revealed the high SAR exposure concern of the other side of the body when the imaging landmark is on the implant in the cylindrical system. The results suggest that the planar system may be more suitable especially for the clinical cases that patients have knee or hip implants on both sides of the body. The maximum SAR values demonstrated with two different normalization methods revealed that B1+ scaling for cylindrical system showed about 50% lower SAR with the iso-center at the center of the body and about 15% lower SAR with the iso-center at the implant. For the planar system, the maximum SAR normalized with B1+ scaling was up to 60% lower for the knee landmarks and 40% lower for the hip landmarks, compared to the SAR values normalized with the 2W/kg limit. The use of B1+=2μT as a safety limit may allow more patients to be scanned with MRI systems.CONCLUSION
The validated computational modeling offers a viable approach to compare the potential risk of RF-induced heating of implants. The 1.2T planar system demonstrated lower risk of heating of hip and knee implants compared to the 1.5T system. Having different coil designs may improve patient access to MRI scans.Acknowledgements
DISCLAIMER: The mention of commercial products, their sources, or their use in connection with material reported herein is not to be construed as either an actual or implied endorsement of such products by the Department of Health and Human Services.References
1. Delfino JG, Krainak DM, Flesher SA, et al. MRI-related FDA adverse event reports: A 10-yr review. Medical Physics. 2019;46(12):5562–5571.
2. Golestanirad L, Kazemivalipour E, Lampman D, et al. RF heating of deep brain stimulation implants in open-bore vertical MRI systems: A simulation study with realistic device configurations. Magn. Reson. Med. 2019;001-9.
3. S. Suzuki, T. Shimoda, and T. Taniguchi, “High frequency coil for magnetic resonance imaging device https://patentscope.wipo.int/search/en/detail.jsf?docId=WO2008108048,” 2009.
4. Lucano E, Liberti M, Mendoza GG, et al. Assessing the electromagnetic fields generated by a radiofrequency mri body coil at 64 mhz: Defeaturing versus accuracy. IEEE Transactions on Biomedical Engineering, 2016;(63):1591–1601
5. Massey JW and Yilmaz AE. AustinMan and AustinWoman: High-Fidelity, anatomical voxel models developed from the VHP color images. Conf Proc IEEE Eng Med Biol Soc 2016: 3346-3349.
6. Benkler, S., Chavannes, N., Kuster, N. Novel FDTD Huygens source enables highly complex simulation scenarios on ordinary PCs. Conf Proc IEEE APSURSI, 2009: 1-4.
Figures