2279
Using deep neural networks to predict RF heating of implanted conductive leads exclusively from implant trajectory and RF coil features1Biomedical Engineering, McCormick School of Engineering, Northwestern University, Evanston, IL, United States, 2Radiology, Feinberg School of Medicine, Northwestern University, Chicago, IL, United States, 3Neurosurgery, Feinberg School of Medicine, Northwestern University, Chicago, IL, United States, 4Physical Therapy and Human Movement Sciences, Feinberg School of Medicine, Northwestern University, Chicago, IL, United States
Synopsis
Safety risks associated with radiofrequency (RF) heating of tissue around implanted leads limit MRI accessibility for patients with active electronic implants such as those with deep brain stimulation (DBS) devices. RF heating is highly sensitive to the trajectory of the implanted lead, and full-wave electromagnetic simulations are currently the standard method for quantifying RF heating, requiring extensive computational resources and simulation time. Here, we present a promising, fast approach for predicting trajectory-specific maximum local specific absorption rate (SAR) in the tissue around tips of implanted lead models using deep learning.
Introduction
Radiofrequency (RF) induced heating is a major safety concern for patients with active electronic implants such as those with deep brain stimulation (DBS) devices. It is well established that the lead’s trajectory and orientation with respect to the MRI scanner’s electric field are significant contributors to RF heating.1-5 Extensive effort is dedicated to quantifying and mitigating the problem of RF heating, mostly by means of detailed electromagnetic (EM) simulations. Even with today’s high-power computing clusters, these simulations are notoriously cumbersome and typically take tens of hours to complete a single simulation scenario.6 In a departure from current methods for solving Maxwell’s Equations through full-wave EM computational techniques, we propose to train a deep neural network (DNN) to predict the power deposition in the tissue around implanted conductive leads. We demonstrate that even a not-so-deep DNN can be trained to reliably distinguish between low-SAR and high-SAR lead configurations using only the background electric field of the MRI RF coil and the lead trajectory.Methods
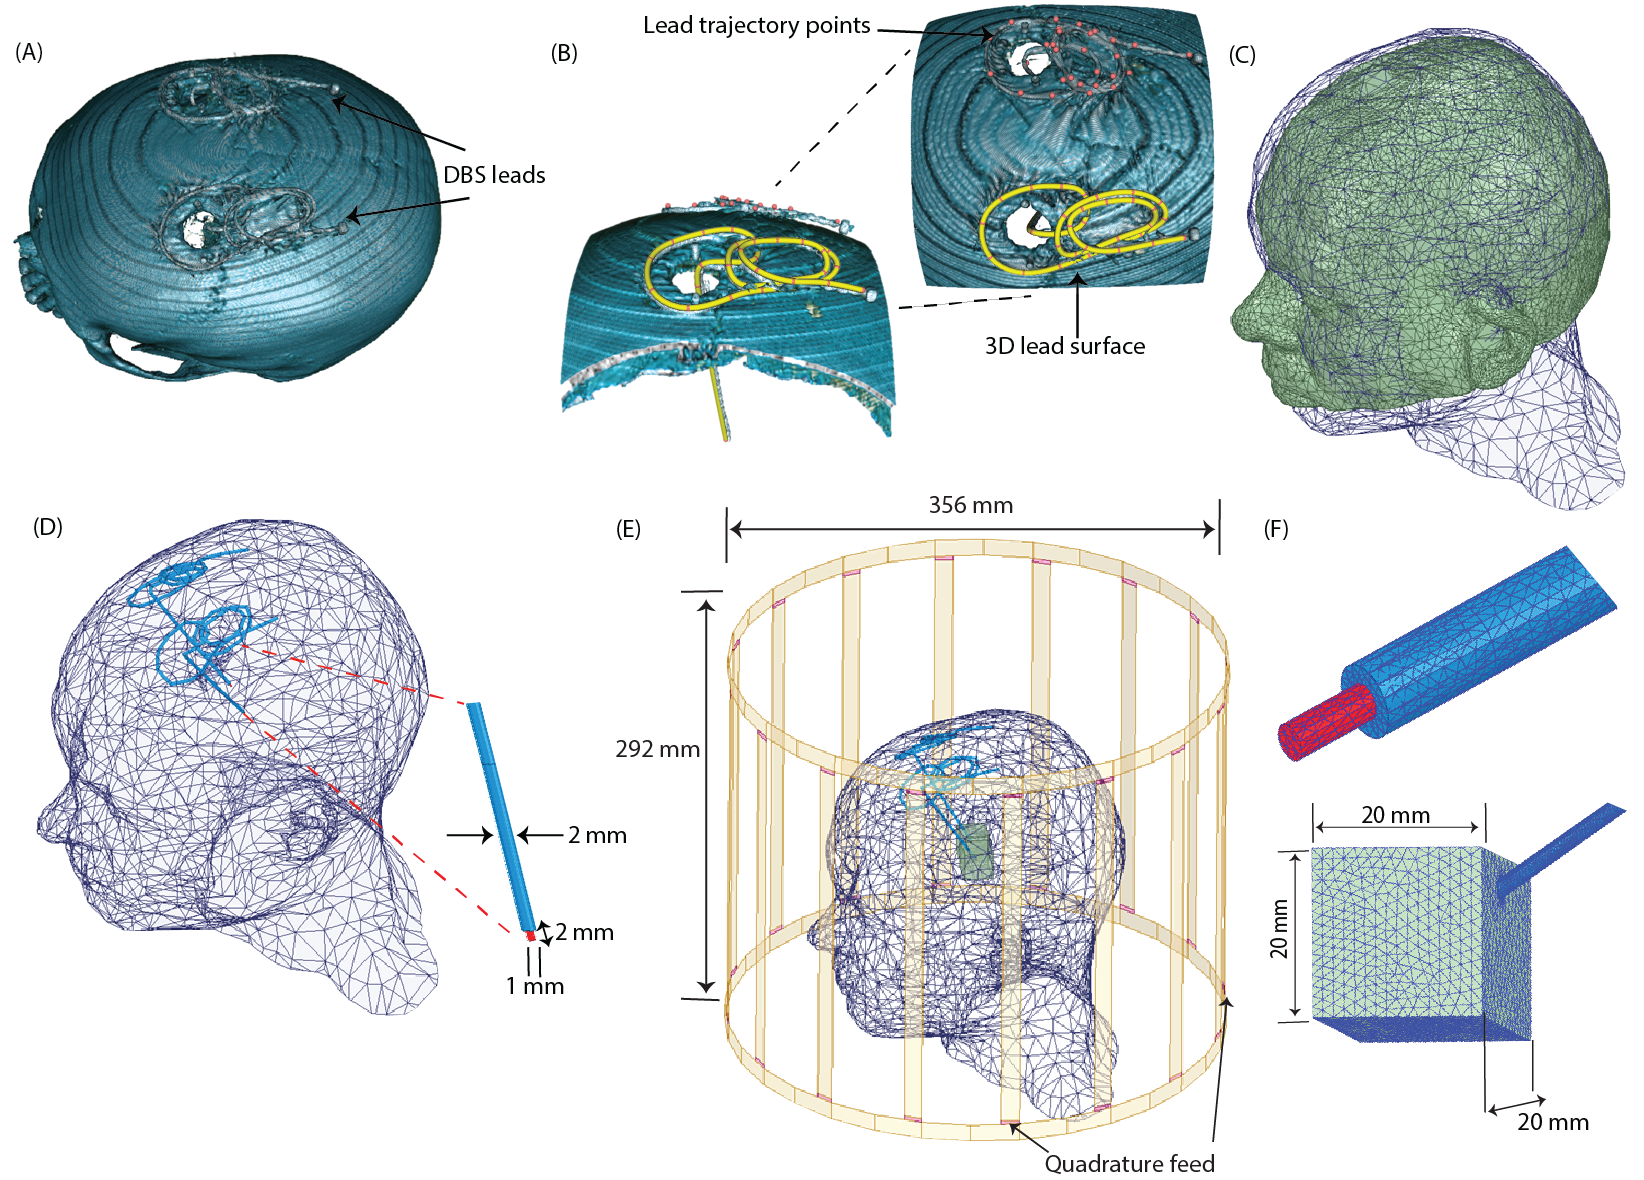
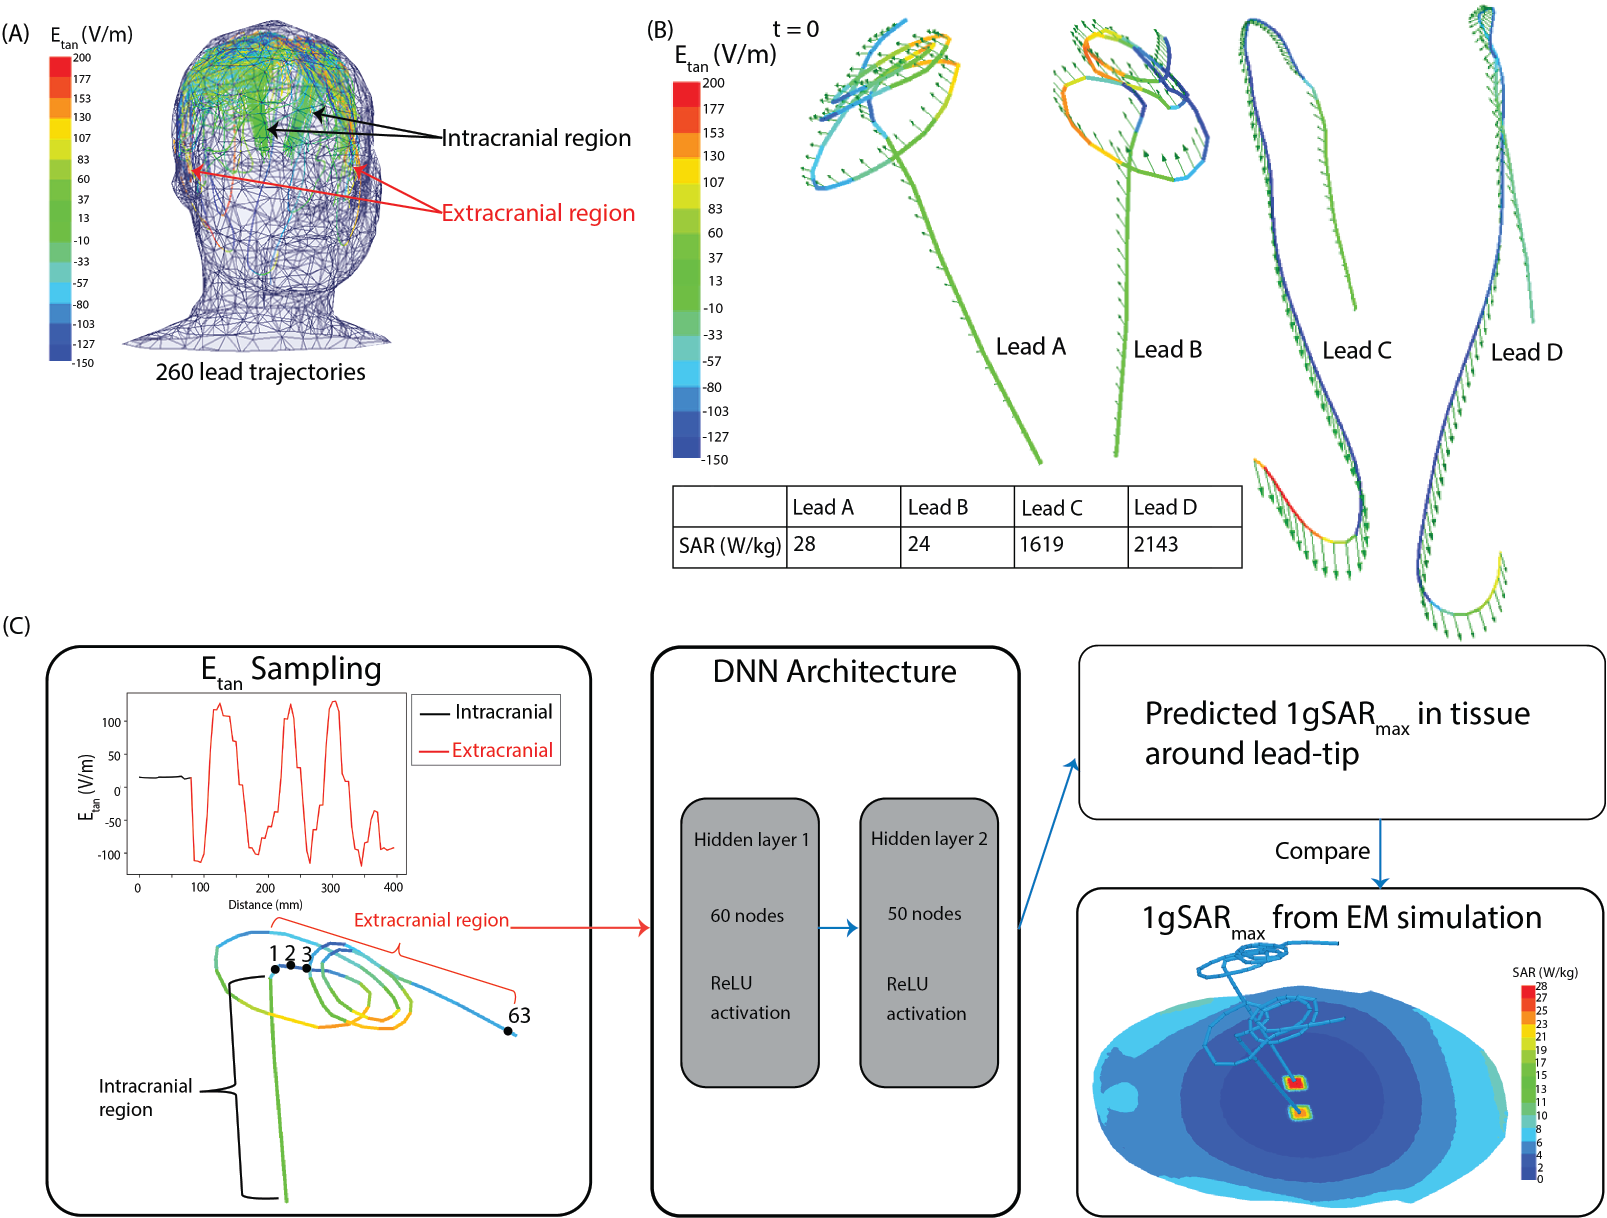
Creation of dataset: A dataset of 260 DBS lead models consisting of 83 patient-derived lead models and 177 lead models with artificial trajectories was developed. Patient-derived lead trajectories were identified from postoperative CT images of patients who underwent deep brain stimulation at Northwestern Memorial Hospital. DBS lead artifacts were identified and segmented in 3D Slicer 4.10.2, and simplified DBS lead models (40 cm in length) were reconstructed to have the following composition: conductive wire (σ=4 x 10⁶ S/m, diameter=1 mm), urethane insulation (σ=0 S/m, εr=3.5, diameter=2mm), and 2 mm exposed tip (Figure 1). Artificial trajectories were included to account for patient-to-patient variation in the extracranial DBS lead trajectories and to include worst-case heating scenarios. Electromagnetic simulations were implemented in ANSYS Electronic Desktop 2019 R1 HFSS using a 16-rung low-pass birdcage head coil tuned to the RF frequency of 64 MHz and loaded with a homogeneous head model (σ=0.49 S/m, εr=66.34) and lead model. The maximum 1g-averaged SAR, 1gSARmax, was calculated in a 20-mm-x-20-mm-x-20-mm region of tissue surrounding the lead-tip. These 1gSARmax values served as the ground-truth SAR values.We determined the distribution of the tangential component of the MRI incident electric field (Etan) along each lead trajectory, and this served as the input features to the DNN as illustrated in Figure 2. Etan values were sampled at 5 mm increments along the length of each lead.
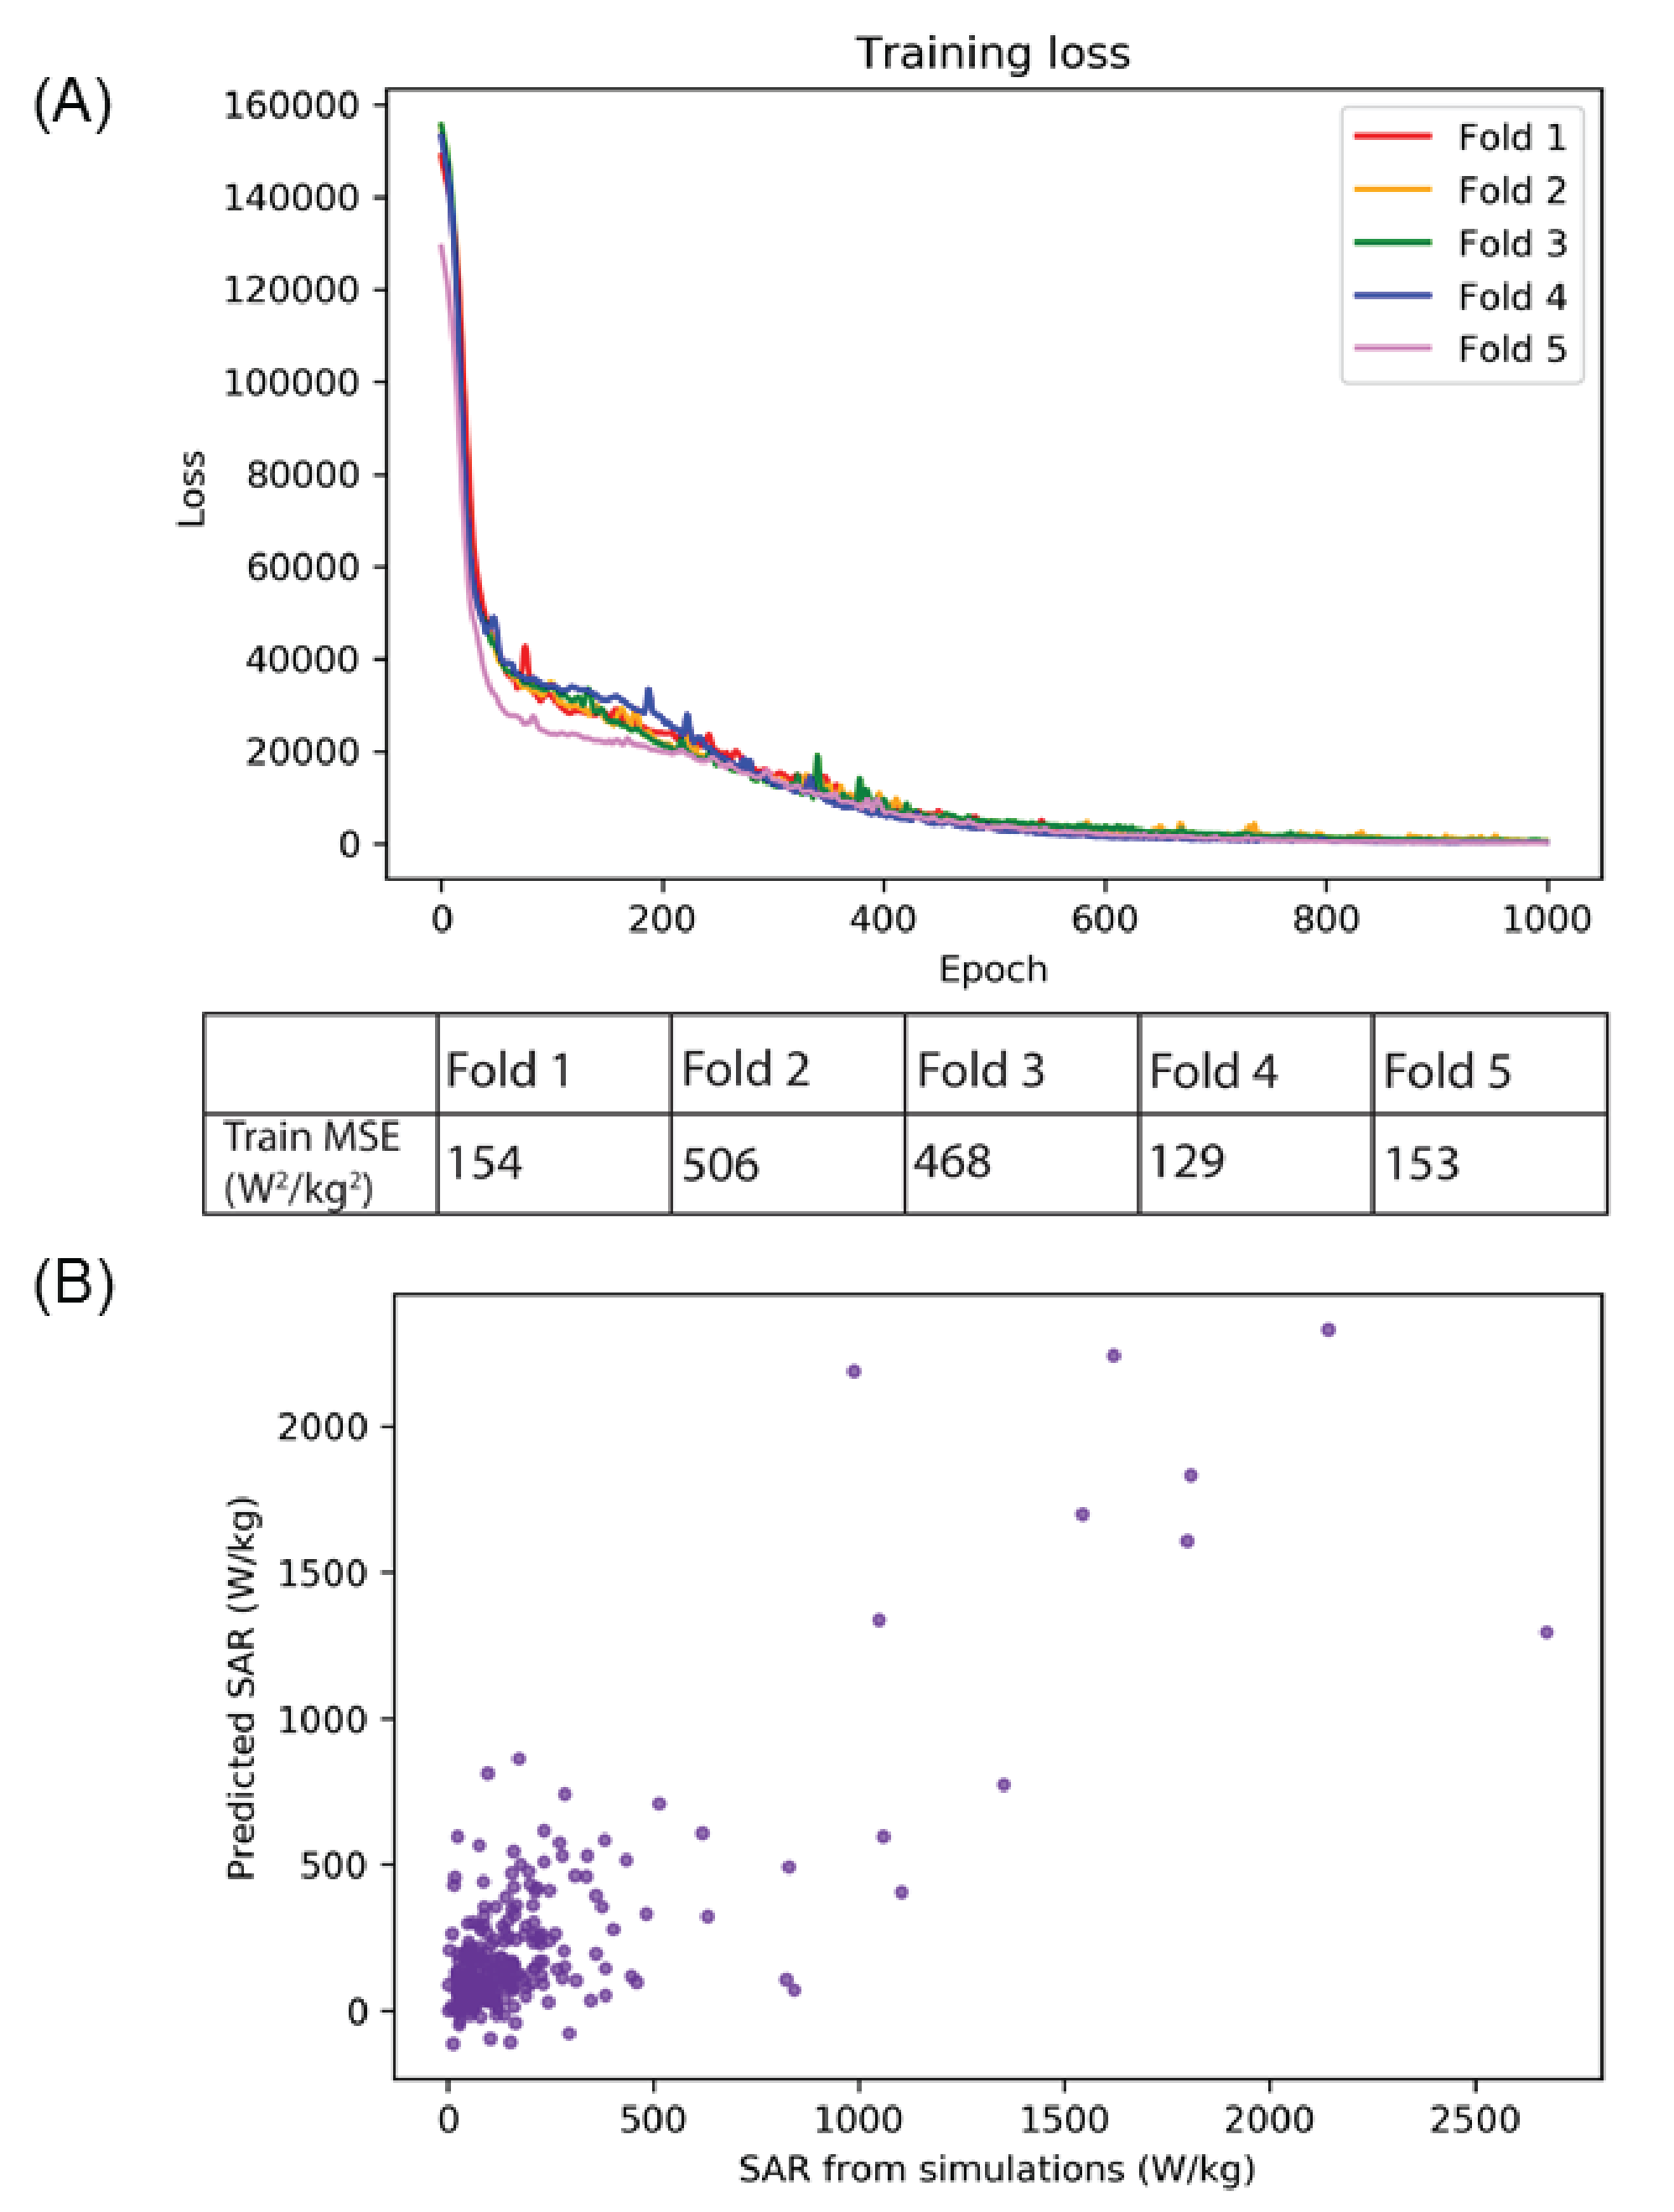
Network architecture and evaluation: Development and implementation of the neural network were performed using Python 3.6 and Python libraries including Keras and Scikit-learn. The DNN was trained to predict 1gSARmax at the tips of implanted lead models from the Etan values associated with the extracranial region of the leads. The Adam optimizer was used to determine the network weights.7 Training loss per epoch was assessed for potential overfitting to the data. Additionally, we performed five-fold cross validation to evaluate the model’s training and testing on a unique test dataset. Preliminary hyperparameter optimization was conducted using the GridSearchCV method with five-fold cross validation on the training dataset of the first fold. The optimal hyperparameter values were subsequently applied to the four remaining training and testing datasets in the five-fold cross validation schema. The mean squared error (MSE) and correlation coefficient (R) were used to evaluate performance of the DNN.
Results
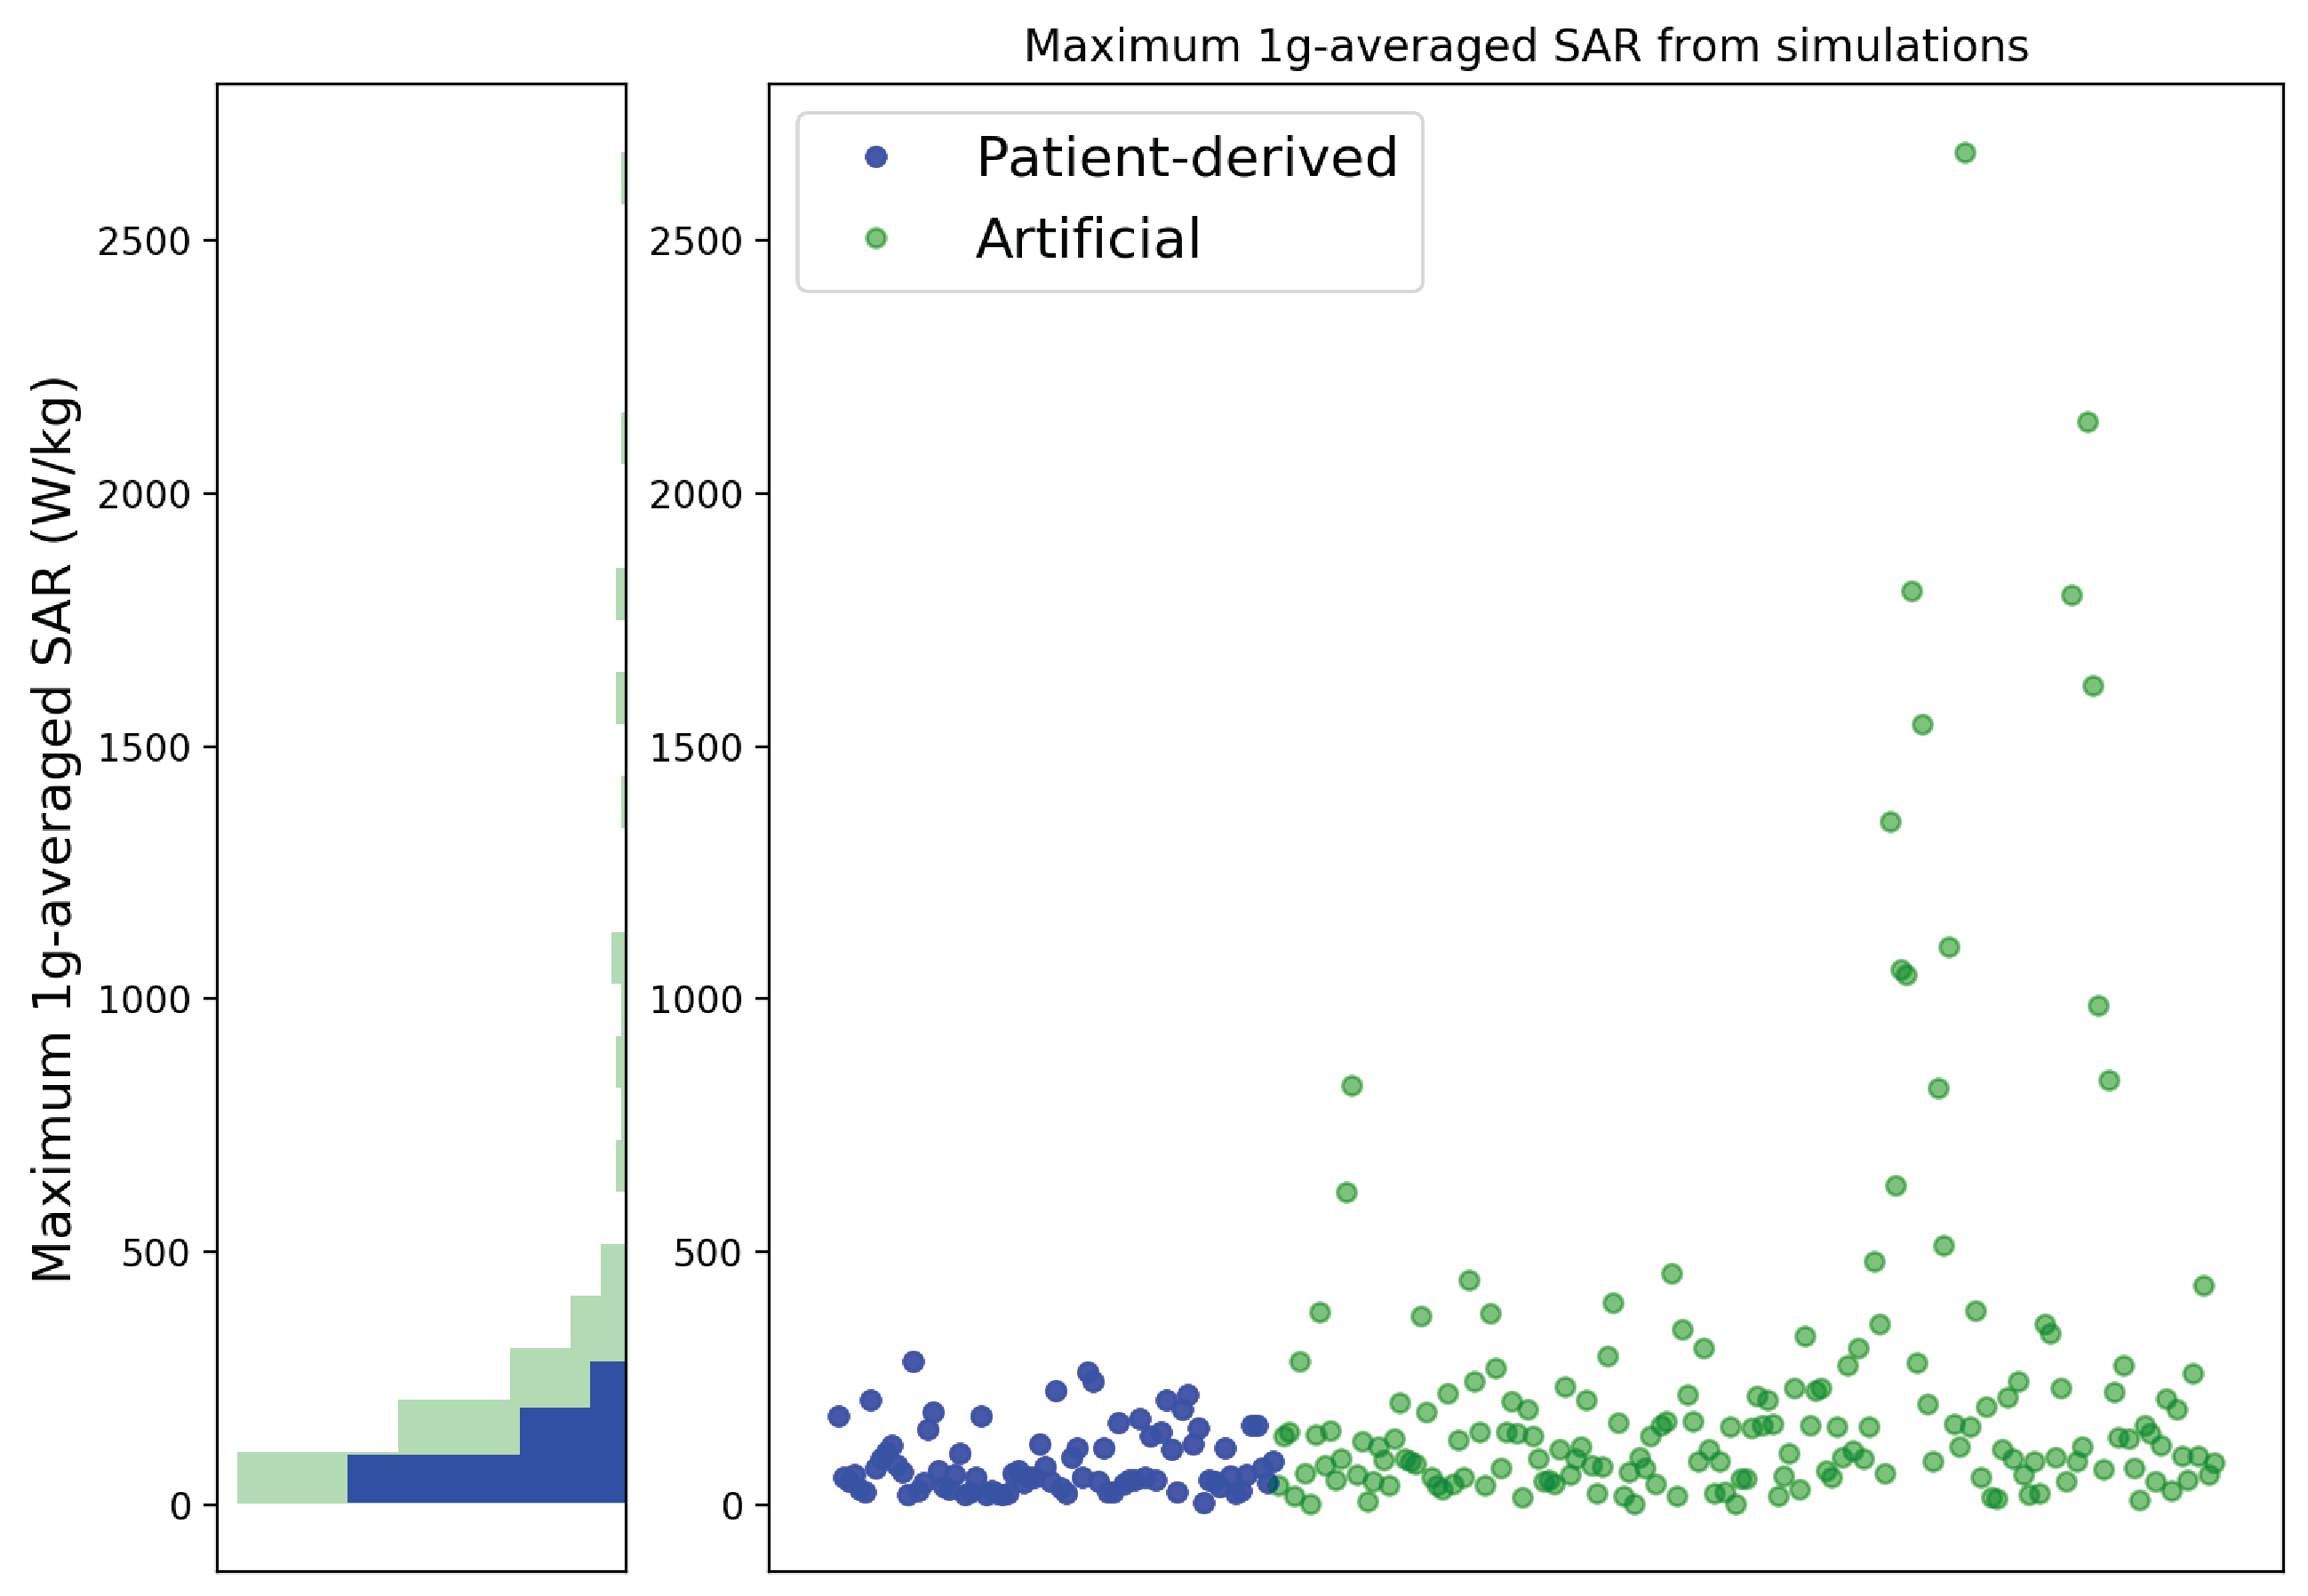
From EM simulations, ground-truth maximum RF-induced heating was quantified as 1gSARmax. Maximum RF-induced heating occurred in the tissue around the lead-tips for all implanted lead models. Artificial lead trajectories demonstrated worst-case scenario heating as these trajectories had significantly higher 1gSARmax (247.4 ± 388.9 W/kg) than leads with patient-derived trajectories (86.5 ± 65.3 W/kg) (Figure 3).The resulting predictive model was a fully connected feed-forward neural network comprised of two hidden layers with 60 and 50 nodes in the first and second layer, respectively, and an output layer. The DNN was able to train and predict 1gSARmax for patient-derived and artificial lead trajectories based on the distribution of Etan of each lead. As indicated in Figure 4, the DNN performed with an average MSE = 282 ± 168 W2/kg2 following 1000 epochs of training during each fold of five-fold cross validation. Figure 4 shows the predicted 1gSARmax from the DNN; testing performance from the five-fold cross validation resulted in an average R=0.73.
Discussion
This work demonstrates the application of a deep learning-based approach for predicting RF-induced energy deposition in the tissue around the tips of implanted leads. Our DNN shows potential to predict 1gSARmax without the need for time-consuming full-wave EM simulations while our dataset accounted for clinically relevant and synthetic lead trajectories. The performance of our DNN and the use of Etan values for SAR predictions suggest that this approach may be extended towards SAR prediction of active electronic medical devices such as DBS leads, where the lead trajectory is an important determinant of SAR amplification.Acknowledgements
This work was supported by NIH grant R00EB021320.References
1. Mattei E, Triventi M, Calcagnini G, et al. Complexity of MRI induced heating on metallic leads: Experimental measurements of 374 configurations. Biomed Eng Online. 2008;7:11.
2. Golestanirad L, Pilitsis J, Martin A, et al. Variation of RF heating around deep brain stimulation leads during 3.0 T MRI in fourteen patient-derived realistic lead models: The role of extracranial lead management. Proc. Intl. Soc. Mag. Reson. Med. 25 2017.
3. Golestanirad L, Angelone LM, Iacono MI, et al. Local SAR near deep brain stimulation (DBS) electrodes at 64 and 127 MHz: A simulation study of the effect of extracranial loops. Magn Reson Med. 2017;78(4):1558–1565.
4. Golestanirad L, Kirsch J, Bonmassar G, et al. RF-induced heating in tissue near bilateral DBS implants during MRI at 1.5 T and 3T: The role of surgical lead management. NeuroImage. 2019;184:566–76.
5. Bhusal B, Nguyen BT, Sanpitak PP, et al. Effect of Device Configuration and Patient’s Body Composition on the RF Heating and Nonsusceptibility Artifact of Deep Brain Stimulation Implants During MRI at 1.5T and 3T. J Magn Reson Imaging. 2020.
6. Nguyen BT, Pilitsis J, Golestanirad L. The effect of simulation strategies on prediction of power deposition in the tissue around electronic implants during magnetic resonance imaging. Phys Med Biol. 2020;65(18):185007
7. Kingma DP, Ba JL. Adam: A method for stochastic optimization. 3rd Int. Conf. Learn. Represent. ICLR 2015 - Conf. Track Proc., 2015.
Figures