2278
Quantifying Fetal and Maternal Body Composition Using 3-D Stack-Of-Radial Free-Breathing MRI1Pediatrics, University of California Los Angeles, Los Angeles, CA, United States, 2Radiological Sciences, University of California Los Angeles, Los Angeles, CA, United States
Synopsis
This pilot prospective cohort study investigated fetal and maternal body composition in the third trimester of pregnancy using 3D stack-of-radial free-breathing MRI. Nine women with healthy pregnancies, gestational diabetes, or fetal growth restriction were included. Fetal subcutaneous fat and liver fat, as well as maternal liver fat, subcutaneous fat, and visceral fat were successfully measured. Maternal body composition was associated with fetal body composition. Pregnancies complicated by gestational diabetes appear to alter fetal body composition.
INTRODUCTION
Fetuses with growth restriction and infants of diabetic mothers are at risk for metabolic syndrome.1,2 Body composition, including visceral and subcutaneous adipose tissue (VAT, SAT) and liver fat, is associated with obesity and metabolic syndrome.3,4 However, little is known about how fetal body composition relates to infant anthropometrics and childhood obesity. Magnetic resonance imaging (MRI) non-invasively quantifies the volume of adipose tissue in adults and children.5,6 MRI also measures proton-density fat fraction (PDFF, %), a biomarker of fat content. However, fetal and maternal movement limit the ability of conventional MRI to quantify fetal adipose tissue volume and content. 3-D stack-of-radial “free-breathing” (FB) MRI can successfully compensate for body movements and physiological motion and accurately quantify adipose tissue volume and content in adults, pregnant women, adolescents, and young infants.5-9 In this study, we used FB-MRI to measure maternal and fetal body composition in the third trimester of pregnancy in healthy women and women with pregnancy complications. The objectives of the study were twofold: 1) Demonstrate the ability to quantify fetal and maternal body composition parameters using 3D stack-of-radial FB-MRI and report findings, 2) Investigate associations between maternal factors and fetal body composition parameters.METHODS
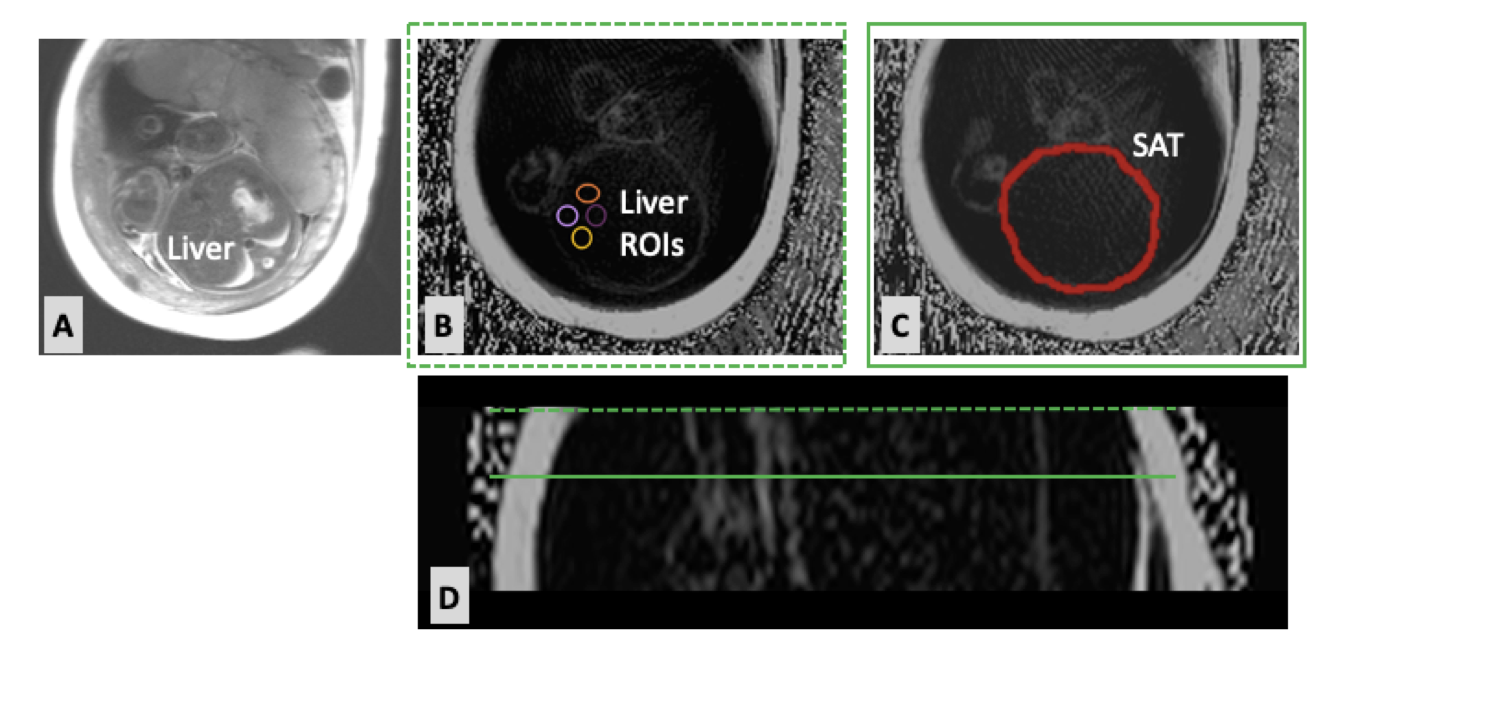
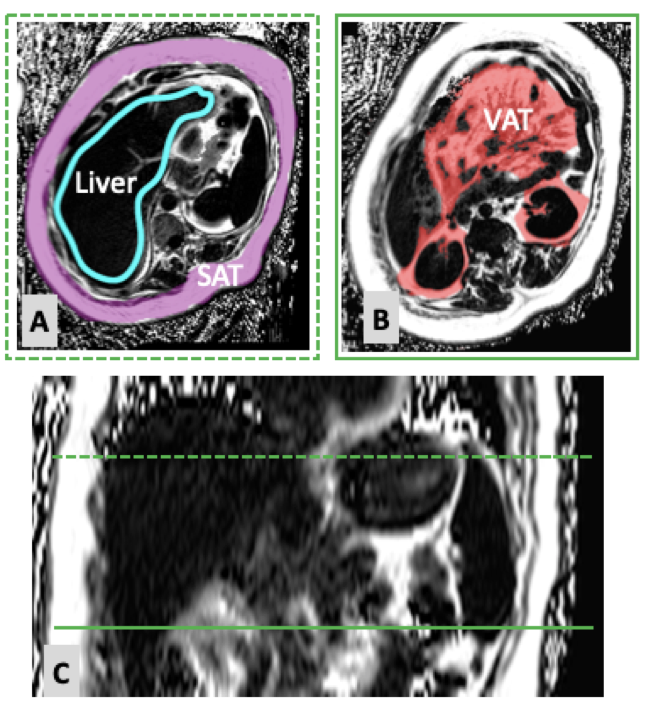
In this IRB-approved prospective pilot study, pregnant women at 30-36 weeks gestation underwent research MRI scans of their abdomen and fetus at 3T (Prisma or Skyra, Siemens). There were three cohorts: healthy subjects, subjects with gestational diabetes, and subjects with fetal growth restriction. Pregnant women were scanned in the left or right lateral decubitus position with feet-first or head-first orientation. Body array and spine array coils were used and pillows were provided to ensure subject comfort. The entire scan session was 60 min. T2-HASTE images were obtained as anatomical references. Axial 3-D stack-of-radial FB-MRI sequences were obtained to quantify fetal liver PDFF and fetal abdominal SAT volume and PDFF. Axial 3-D stack-of-radial FB-MRI sequences were also obtained to quantify maternal liver PDFF and abdominal SAT and VAT volume and PDFF. The imaging parameters are reported in Table 1.Maternal VAT was defined as adipose tissue in the intra-abdominal area starting below the dome of the liver until the uterus and placenta were visible. Maternal SAT was defined as adipose tissue above the muscle fasica and below the skin of the abdomen, and did not include breast tissue. Fetal SAT was defined as adipose tissue above the muscle fascia and below the skin on axial slices involving the liver to the small bowel. Fetal VAT was not measured, as it was not reliably visualized. Measurements were performed by a trained researcher under the supervision of an expert radiologist in image analysis software (Horos) using the brush tool (fetal SAT, maternal VAT, maternal SAT), four 1-cm2 circular regions of interest (ROIs) (fetal liver PDFF), and the polygon ROI tool (maternal liver PDFF). PDFF was reported as the mean of the segmented tissue or ROI. T2-HASTE images were utilized as an anatomical reference for ROI placement on fetal PDFF maps.
Clinical information about maternal pregnancy and infant’s birth hospital course were obtained. Means and standard deviations (SD) were calculated for each body composition measurement and continuous clinical variables. Means were compared between cohorts with t-test and ANOVA with Tukey post-hoc analysis. Spearmen correlation coefficients and linear regression were utilized to calculate associations between body composition and clinical markers. P<0.05 was considered significant.
RESULTS
Nine pregnant women completed research MRI scans. Both maternal and fetal scans were obtained for seven women. Demographic information is reported in Table 2. Examples of fetal liver and SAT measurements using 3-D stack-of-radial FB-MRI are shown in Figure 1. Examples of maternal liver, VAT, and SAT measurements are shown in Figure 2. Table 3 reports mean and SD measurements.Maternal pre-pregnancy body mass index (BMI) positively correlated with fetal liver PDFF (r2=0.698, p=0.01), maternal SAT PDFF (r2=0.700, p=0.04), maternal SAT volume (r2=0.626 p=0.03), and maternal VAT volume (r2 0.799 p=0.01). Maternal SAT PDFF positively correlated with fetal liver PDFF (r2=0.705, p=0.04). Maternal liver PDFF positively correlated with fetal SAT volume (r2=0.806, p=0.02). Fetuses of women with gestational diabetes had significantly higher liver PDFF than those in the healthy cohort (p=0.03).
DISCUSSION
There have been no studies of maternal body composition utilizing MRI to date and few studies involving fetal body composition. In this small pilot study, we used 3-D stack-of-radial FB-MRI to measure fetal and maternal body composition in the third trimester of pregnancy. Pregnancies complicated by gestational diabetes appear to alter maternal and fetal body composition. Pre-pregnancy BMI and maternal SAT PDFF and volume were associated with fetal liver PDFF. Increased fetal liver PDFF may portend future metabolic disorders with fat deposition occurring in utero. This pilot study had limited sample size. Longitudinal studies investigating fetal and childhood body composition in a larger cohort are needed to better decipher these associations and may provide further insight into the fetal origins of obesity and metabolic syndrome.CONCLUSION
3-D stack-of-radial FB-MRI quantified fetal and maternal body composition in pregnant women. Maternal factors were associated with fetal body composition. By utilizing MRI, we may be able to better understand how maternal and fetal body composition impact future childhood and adult diseases.Acknowledgements
This work was supported in part by the UCLA Children’s Discovery Institute and the NIH/NIDDK under award R01DK124417.References
1. Betty R. Vohr & Charlotte M. Boney (2008) Gestational diabetes: The forerunner for the development of maternal and childhood obesity and metabolic syndrome?, The Journal of Maternal-Fetal & Neonatal Medicine, 21:3, 149-157,DOI: 10.1080/147670508019294302.
2. Thorn,Stephanie R, Rozance,Paul J, Brown,Laura D, Hay,William W. The Intrauterine Growth Restriction Phenotype: Fetal Adaptations and Potential Implications for Later Life Insulin Resistance and Diabetes. Semin Reprod Med 2011. Vol 29 Issue 03: 225-2363.
3. Weghuber D, Zelzer S, Stelzer I, Paulmichl K, Kammerhofer D, Schnedl W, Molnar D, Mangge H. High risk vs. "metabolically healthy" phenotype in juvenile obesity - neck subcutaneous adipose tissue and serum uric acid are clinically relevant. Exp Clin Endocrinol Diabetes. 2013 Jul;121(7):384-90. doi: 10.1055/s-0033-1341440. Epub 2013 Mar 21. PMID: 23519645.4.
4. Mauno Vanhala. Childhood weight and metabolic syndrome in adults (1999). Annals of Medicine, 31:4, 236-239. DOI: 10.3109/078538999089958855.
5. Ly K, Armstrong T, Yeh J, Gharehmani S, et al. Free breathing MRI Assessment of Body Composition in Healthy and Overweight Children—An Observational Study (2019). Journal of Pediatric Gastroenterology and Nutrition: 68 (6), 782-787. doi: 10.1097/MPG.00000000000023096.
6. Armstrong, T., Ly, K.V., Ghahremani, S. et al. Free Breathing 3D Quantification of infant body composition and hepatic fat using a stack-of-radial magnetic resonance imaging technique. Pediatr Radiol (2019) 49: 876. https://doi.org/10.1007/s00247-019-04384-77.
7. Armstrong T, Dregely I, Stemmer A, et al. Free-Breathing Liver Fat Quantification using a Multiecho 3D Stack-of-Radial Technique (2018). Magnetic Resonance in Medicine; 79(1):370-382.8.
8. Armstrong, T., Liu, D., Martin, T., et al. 3D mapping of the placenta during early gestation using free‐breathing multiecho stack‐of‐radial MRI at 3T (2019). J. Magn. Reson. Imaging, 49: 291-303. doi:10.1002/jmri.262039.
9. Armstrong T, Ly KV, Murthy S, et al. Free-Breathing Quantification of Hepatic Fat in Healthy and NAFLD Children Using a Multiecho 3D Stack-of-Radial MRI Technique (2018). Pediatric Radiology, 48:941-953.
Figures