2274
Dffusion tensor imaging of the physis and metaphisys as predictor of child growth1Columbia University Medical Center, New York, NY, United States, 2Children’s Hospital of Philadelphia, Philadelphia, PA, United States, 3Massachusetts General Hospital, Boston, MA, United States, 4New York University, New York, NY, United States
Synopsis
Prediction of growth potential in the pediatric population is critical to trace therapies targeting growth deficiencies and to inform surgical planning. Clinical models to predict growth potential are very inaccurate. We aim to validate DTI of the physis and metaphysis (DTI-P/M) as a prediction biomarker of growth potential in children. We compared in a cohort of 90 children the prediction accuracy of DTI-P/M and clinical models. Our data showed that DTI-P/M predicted growth potential more accurately than clinical models (over 40% reduction in error). Even more importantly, compared to clinical models DTI-MP predictions did not show any prediction bias.
INTRODUCTION
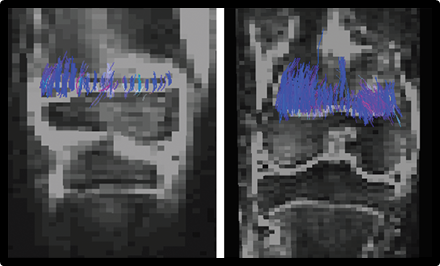
Early detection of abnormal skeletal growth is challenging as abnormal function of the physis, or growth plate, only becomes evident when there is slow height gain, deformity, or a final short stature. Clinically, physeal function is assessed with height measurements, which are used to predict height velocity (HV), or change in stature during 1 year, and total height gain (THG), or the difference between present height and final height.1 Current methods to predict HV and THG rely on determination of bone age1,2 and provide inaccurate predictions, which may vary by as much as 8 cm.3Diffusion tensor imaging of the physis and metaphysis (DTI-P/M) has shown promise to assess physeal function.5 DTI-P/M measures diffusion through the columns of physeal chondrocytes and metaphyseal ossifying cartilage aligned with the bone’s longitudinal axis. As children approach skeletal maturity physeal chondrocytes progressively ossify reducing the organization and length of columns. Thus, measures of tractography can be a direct measure of growth plate activity.6
The objectives of this study were 1) to validate DTI-P/M as a predictive biomarker of VH and THG; 2) To compare predictive value of DTI-M/P with current clinical measures.
METHODS
Subjects. We included 90 children (42/48 girls/boys, 4 to 17 years, median 13 y) with an open distal femoral physis and no evidence of physeal abnormality on T1-weighted images. All children provided measurements of height at the time of MRI and 10‒14 months after. 70 of children (36/34 girls/boys, median 14 y) provided serial height measurements until final height.DTI-P/M. MRIs of the right knee were acquired at 3T with a 15-channel knee coil. DTI was measured using a fat-suppressed EPI sequence with 20 diffusion directions; b-values of 0, 600 s/mm2; TR/TE=7100/82 ms; parallel imaging factor=2; resolution=2×2×3 mm3. Conventional MRI of the knee was also acquired in each children.
Image processing. From DTI-P/M images we calculated fractional anisotropy (FA) and performed tractography using a minimum FA threshold of 0.15 and a maximum turning angle of 40° between two adjacent voxels. Tractography were summarized by tract volume (TV), tract length (TL).
Clinical prediction of HV and THG. Bone age was estimated for all the subjects. From bone age we used the standard models to predict VH7 and THG8. Root mean square errors (RMSE) between estimated and measured HV and THG were calculated.
DTI-P/M prediction of HV and THG. To test predictive value of DTI-P/M for HV and THG we build a multilinear model including DTI-P/M measures (FA, TV and TL), and biological variables (age, sex). Models were validated using 10-fold correlation and RMSE between estimated and measured parameters were calculated for all validation sets (RMSECV).
Statistical analysis. To validate DTI-P/M we built a multilinear model using a stepwise algorithm (enter criteria: p-value<0.05; exit-criteria p>0.10; criteria of improved fit: p-value<0.05). The prediction value of the models was tested using 10-fold cross-validation (1,000 partitions). We used average cross-validation RMSECV as prediction error.
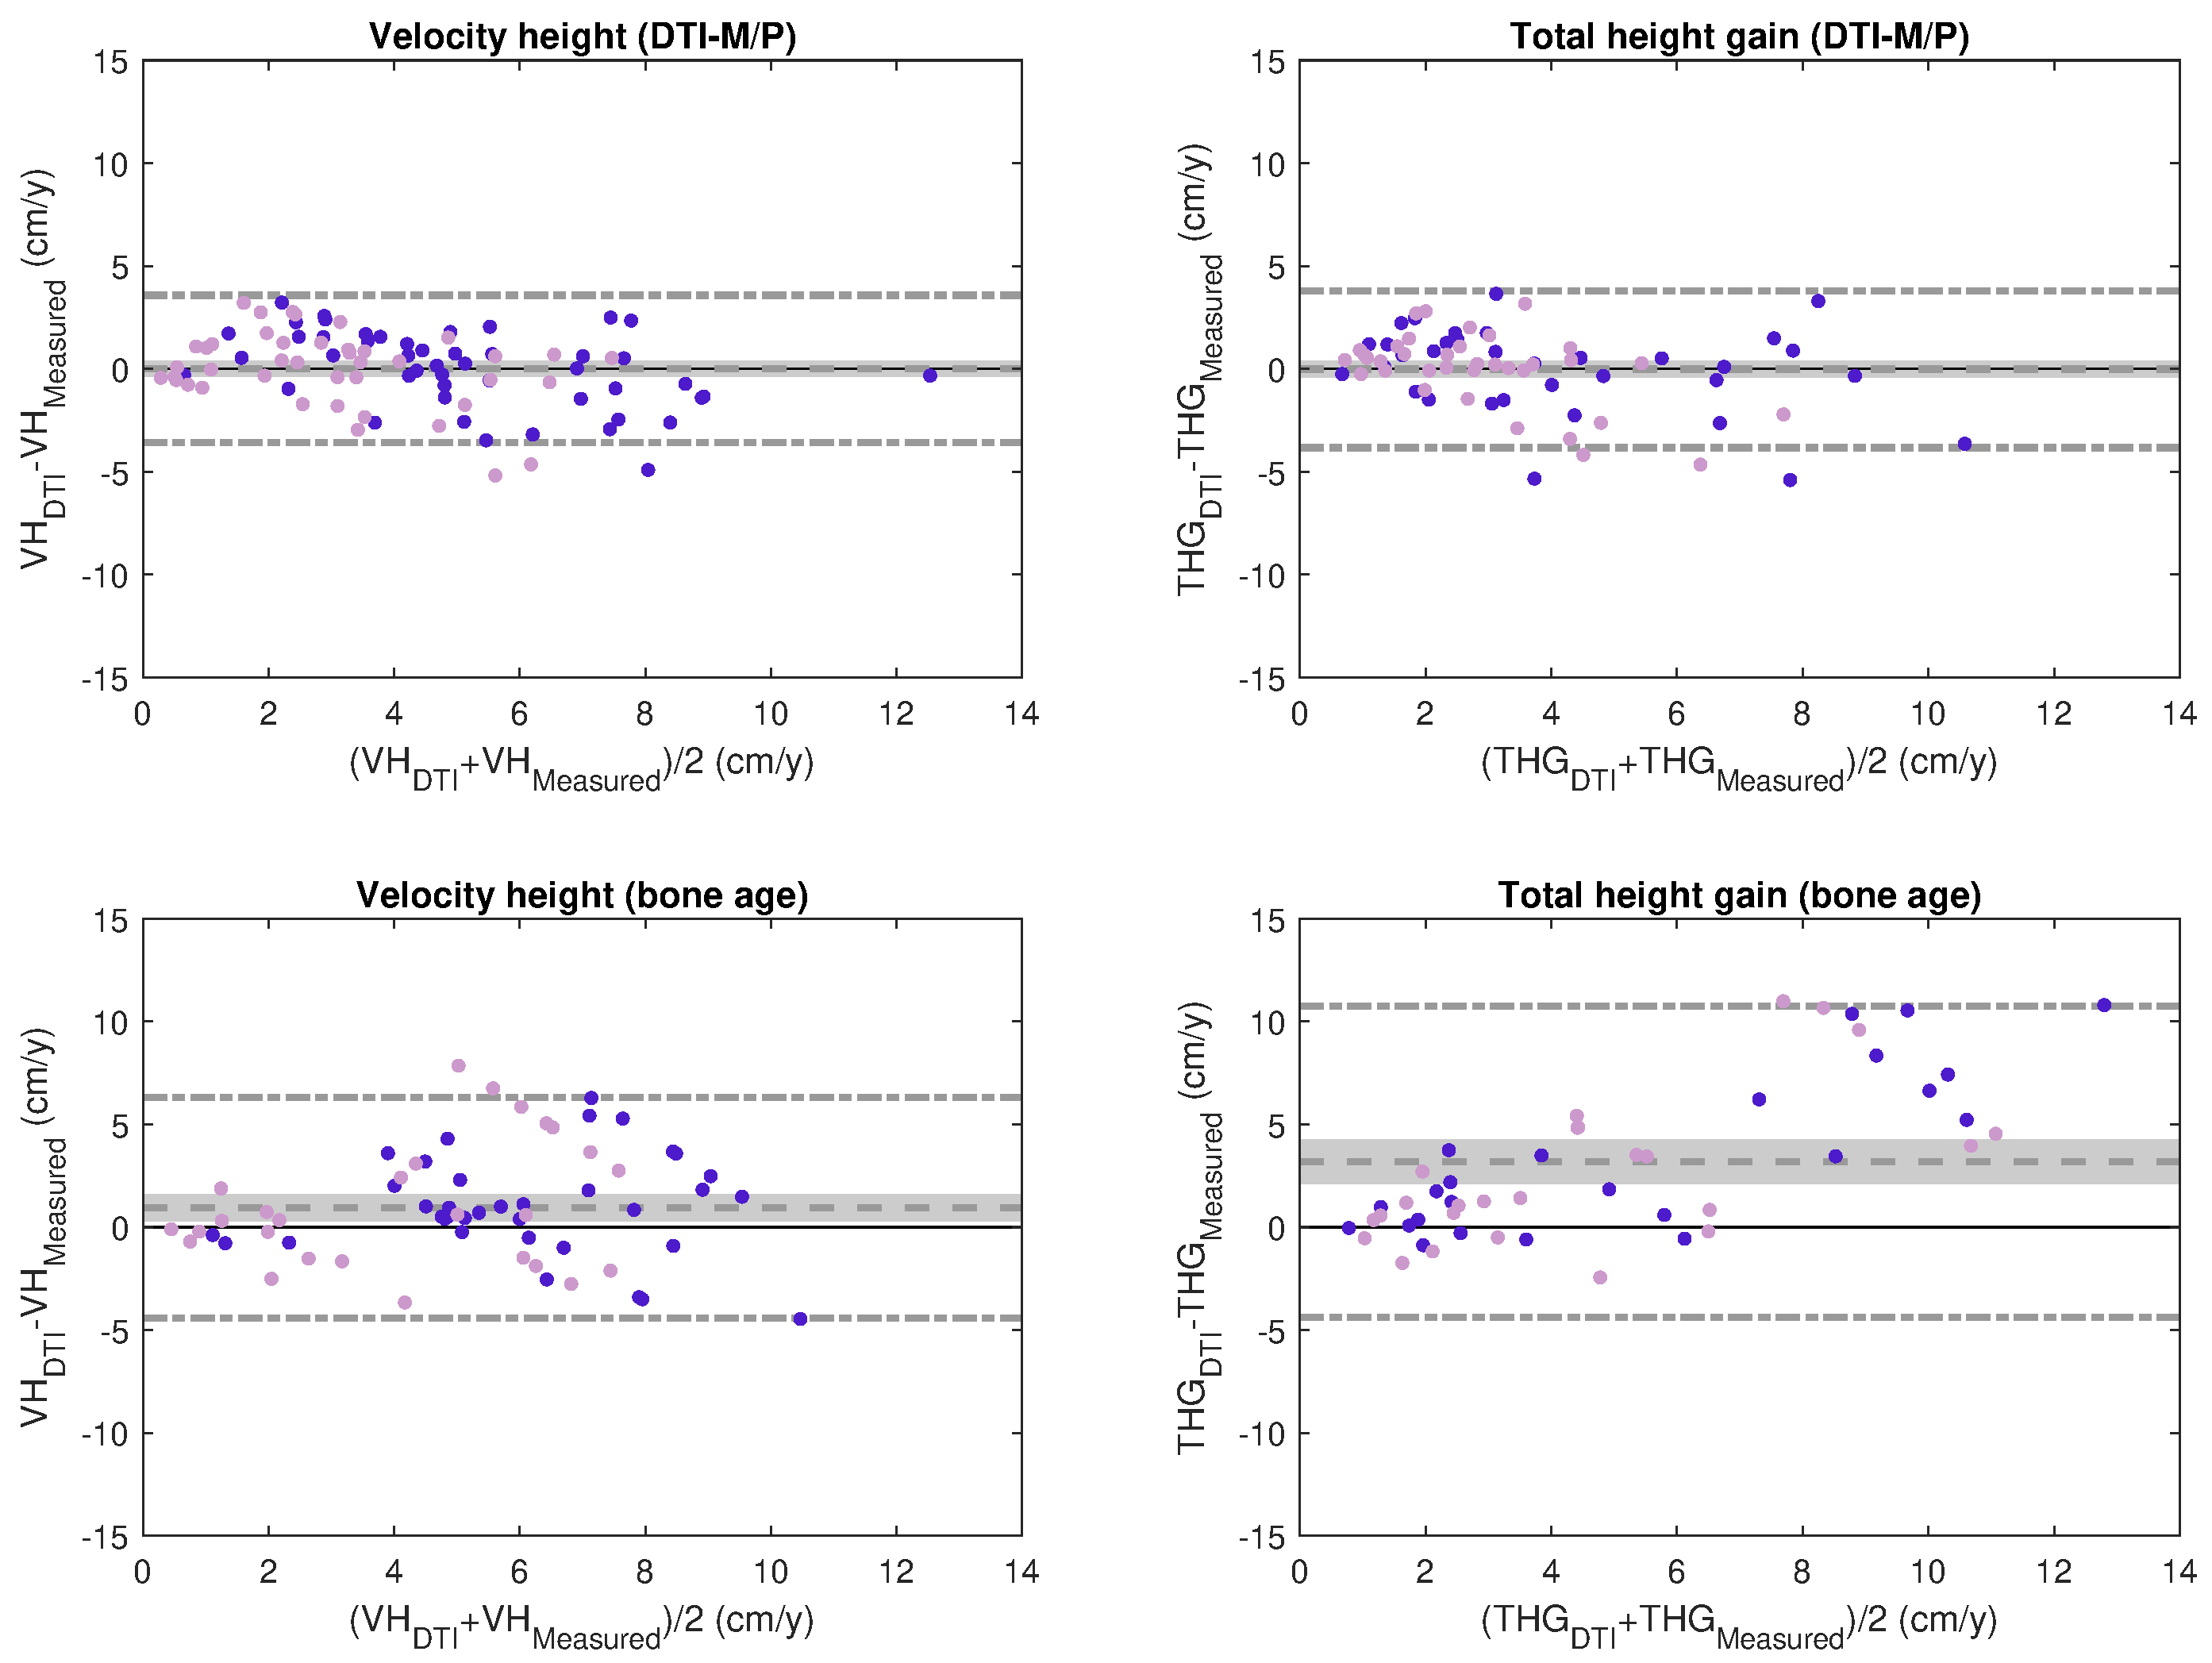
Bland-Altman plots were used to compare the predictive value of DTI-P/M and bone age. For DTI-P/M we used the RMSECV from validation datasets in 10-fold cross-validation. Two-sided t-test stratified by age was used to test for prediction bias after testing for normality (Kolmogorov-Smirnov).
RESULTS
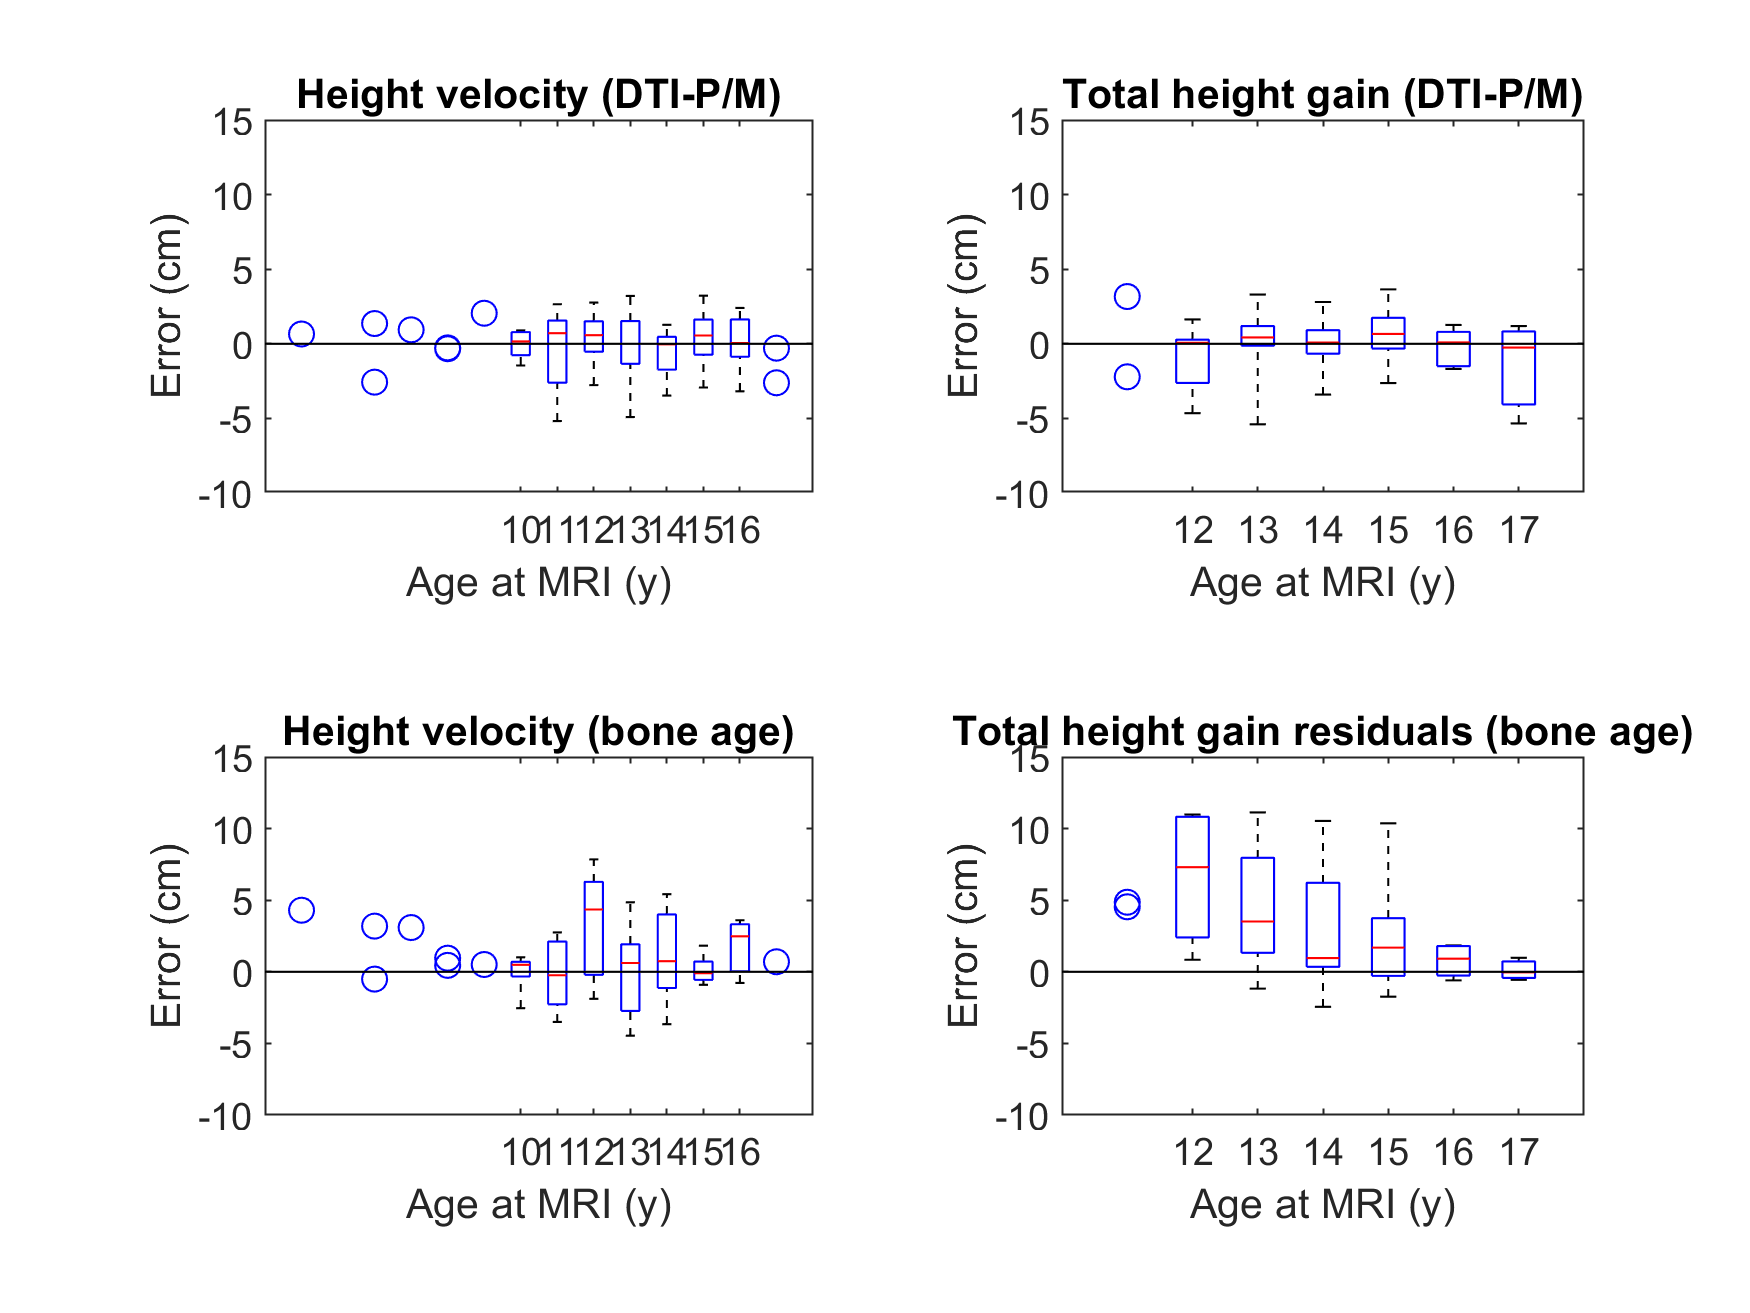
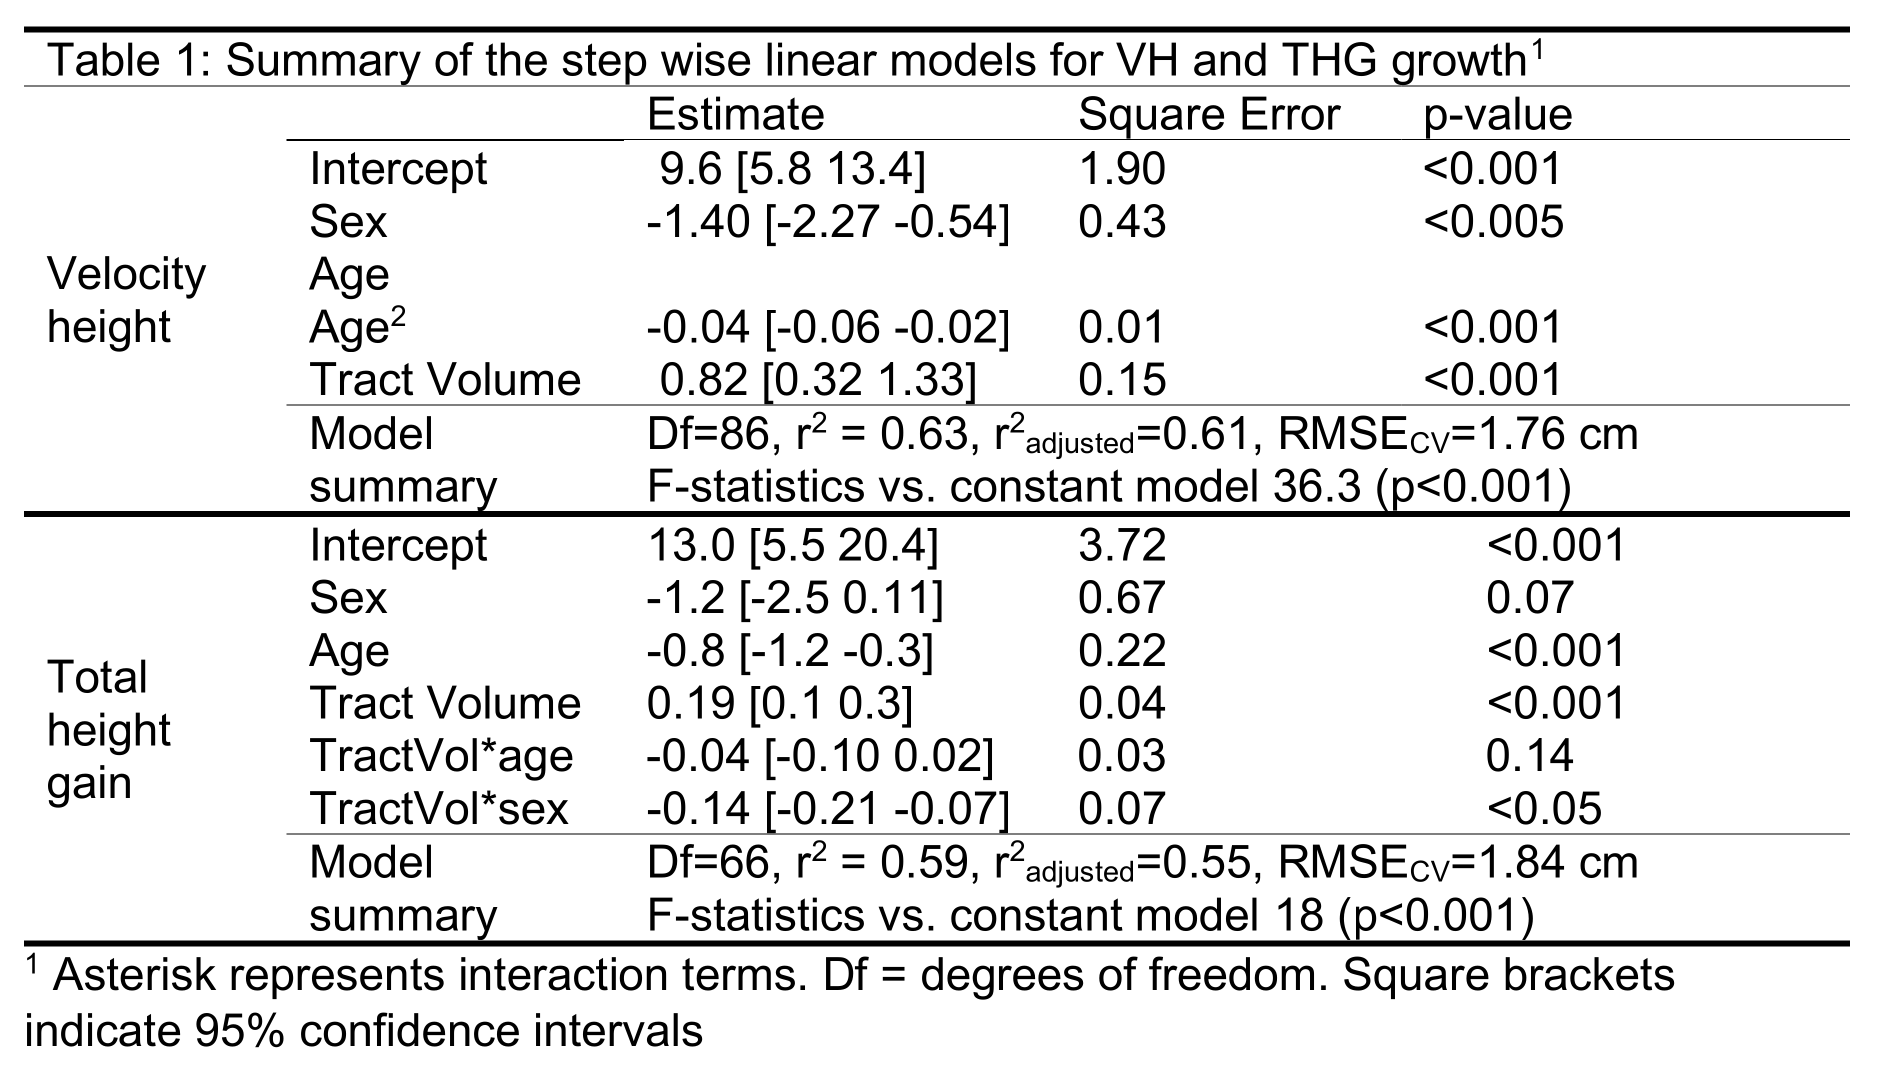
Clinical prediction of HV and THG. The RMSE of the prediction was 2.87 and 4.97 cm for VH and THG, respectively. Bland Altman plots for bone-age based predictions (Fig. 1) showed significant bias in the estimation of both HV (0.93±2.73 cm, p<0.01) and THG (3.19±3.85 cm, p<0.01). Analysis of the residuals by age (Fig. 2) indicated significant (p<0.05) prediction bias in VH for the 12 y group (+3.30 cm) and in THG for ages 12‒14 y (6.61‒2.54 cm).DTI-P/M prediction of HV and THG. The stepwise model identified TV as the strongest predictor for HV and THG (Table 1). DTI-P/M significantly improved data fitting (p<0.05) and explained 63% (RMSECV=1.76cm, VH) and 59% (RMSECV=1.83cm, THG) of the variance. Bland-Altman plots (Fig. 1) did not have a significant bias in HV (p=0.99, (0.00±1.83) cm), nor in THG (p=0.94, (-0.02±1.94) cm). Analysis of residuals did not show bias in VH nor THG for any age group (p>0.25, Fig. 2).
DISCUSION
Our study shows that compared to standard clinical methods DTI-P/M improved prediction of both HV (40% RMSE reduction) and THG (63% RMSE reduction) without measurement bias.Providing an accurate assessment of physeal function is critical. Current clinical methods detect physeal dysfunction after many months, which is suboptimal for evaluating the response to therapies such as growth hormone (GH) treatment. GH treatment entails daily injections, has potential complications, and costs $100,000 annually per child.9,10 Accurate prediction of growth will facilitate decisions about surgical interventions, which differ based on residual growth potential.
The function of the physis relates to the columnar architecture of the cartilage. HV depends on the number of cells in each physeal column and their organization. DTI tractography metrics reflect the length and organization of columns of cartilage and newly formed bone. Thus, DTI metrics should provide a window into the micro-structure and function of the physis, and thus into physeal activity.5
CONCLUSION
Our data demonstrate that DTI-P/M, particularly tract volume, can be an accurate predictive biomarker of potential growth overperforming current clinical methods.Acknowledgements
No acknowledgement found.References
1 Kelly A, Winer KK, Kalkwarf H, et al. Age-based reference ranges for annual height velocity in US children. J Clin Endocrinol Metab. 2014; 99(6):2104-12. PMCID: PMC4037731
2Nguyen JC, Markhardt BK, Merrow AC, Dwek JR. Imaging of Pediatric Growth Plate Disturbances. Radiographics. 2017 Oct;37(6):1791-1812. doi: 10.1148/rg.2017170029. PMID: 29019753.
3Pennock AT, Bomar JD, Manning JD. The Creation and Validation of a Knee Bone Age Atlas Utilizing MRI. J Bone Joint Surg Am. 2018 Feb 21;100(4):e20. doi: 10.2106/JBJS.17.00693. PMID: 29462038.
4Collett-Solberg PF, Jorge AAL, Boguszewski MCS, Miller BS, Choong CSY, Cohen P, Hoffman AR, Luo X, Radovick S, Saenger P. Growth hormone therapy in children; research and practice - A review. Growth Horm IGF Res. 2019 Feb;44:20-32. PMID: 30605792
5MA, Delgado J, Berman JI, et al. Diffusion-Tensor Imaging of the Physes: A Possible Biomarker for Skeletal Growth-Experience with 151 Children. Radiology. 2017; 284(1):210-218. PMID: 28156202
6Barrera CA, Bedoya MA, Delgado JA, Berman JI, Chauvin NA, Edgar JC, Jaramillo D. Correlation between diffusion tensor imaging parameters of the distal femoral physis and adjacent metaphysis, and subsequent adolescent growth. Pediatr Radiol 2019; 49:1191-1200
7Bayley N & Pinneau SR. Tables for predicting adult height from skeletal age: revised for use with the Greulich-Pyle hand standards. Journal of Pediatrics 1952 40 423–441
8Tanner JM, Landt KW, Cameron N, et al. Prediction of adult height from height and bone age in childhood. A new system of equations (TW Mark II) based on a sample including very tall and very short children. Archives of Disease in Childhood 1983; 58:767-776.
9Troutman JA, Sullivan MC, Carr GJ, Fisher J. Development of growth equations from longitudinal studies of body weight and height in the full term and preterm neonate: From birth to four years postnatal age. Birth Defects Res. 2018 Jul 3;110(11):916-932. doi: 10.1002/bdr2.1214. Epub 2018 Mar 14. PMID: 29536674; PMCID: PMC6030425.
10Jaimes C, Chauvin NA, Delgado J, Jaramillo D. MR imaging of normal epiphyseal development and common epiphyseal disorders. Radiographics. 2014 Mar-Apr;34(2):449-71
Figures