2272
MRI T2* liver iron concentration measurement in children comparison using Wood or Garbowski (T2*-LIC) conversions and Ferriscan (R2-LIC)1Radiology, Phoenix Children's Hospital, Phoenix, AZ, United States
Synopsis
LIC analysis may be performed with accurate and reproducible results in children using an ROI or a whole liver segmentation technique using locally available software and the FerriScan® technique.
Background:
Iron overload in the liver is a common manifestation of chronic transfusion and leads to morbidity, endocrine complications, including multiple endocrinopathies, and mortality. [1,2] It is paramount that children with history of chronic transfusion are monitored for elevated liver iron concentration. Quantification of LIC using MRI data is performed using a variety of software applications, one of which is approved by the US FDA. Measurement of LIC with non-invasive means using MRI is an important method of performing intermittent monitoring of LIC and need for ongoing chelation therapy. It has been reported that MRI LIC quantification is more precise than liver biopsy. [3] There are known limitations in MRI LIC estimation; financial cost, exam turn-around time and accuracy and reproducibility. [4,5,6] Prior comparison of these methods in adults have shown good correlation between gradient echo T2* and spin echo R2 LIC techniques up to a LIC of 10 m/g. It is thus far unknown if this correlation exists in pediatric populations and if reasonable presumptions to explain variation in results at higher ranges of LIC are seen in children who may have differences in physiologic performance of the liver and homogeneity of liver iron distribution.Purpose
We sought to evaluate correlation between T2*-LIC values in children and young adults with transfusion iron overload compared to our current clinical standard, (R2-LIC) FerriScan.Materials & Methods:
Between 03/2019 and 11/2020, 54 patients with transfusion iron overload underwent 72 abdomen MRI exams for LIC quantification. Each patient underwent mDIXON T2* and Ferriscan® (Resonance Health, Western Australia), R2 sequences for LIC (mg/g) measurement. Three readers performed individual, blinded measurement of mDIXON T2* and R2* using Liver Health ISP, 1 reader drew and elliptical region of interest (ROI) on a single slice in the right hepatic lobe and 2 readers performed whole liver segmentation, yielding average R2* values which subsequently yielded LIC (mg/g) based on linear relationships ([Fe] mg/g=R2*×0.0254+0.202) [6] and LIC=31.94(T2*)-1.014. [5,6] T2 image data was forwarded to Ferriscan yielded reported LIC (mg/g) measured in a homogeneous ROI of the liver. A power-law relationship equation LIC=0.15*(R2)1.3555 correction was applied to Ferriscan LIC values. [4,5]Results
54 patients, age 20 months-34 years, with transfusional iron overload; primary diagnoses: anemia (Diamond-Blackfan, β thalassemia) n=19, Hgb SS or sickle cell disease n=8, cancer (leukemia n=19, neuroblastoma n=1, sarcoma n=3), Hunter syndrome n=1, unknown n=3. LIC range 0.6-20.5 mg/g FerriScan and 1.2-16.0 mg/g Liver Health. Agreement between FerriScan® and individual readers was assessed with Bland-Altman and ROC analysis. Bland-Altman analysis showed that for patients with a Ferriscan measured LIC under 10 mg/g the 95% limits of agreement between Ferriscan and any of the three readers were within 2.6 mg/g and the bias was less than 0.1 mg/g for all three readers. For the two readers performing whole liver segmentation the 95% limits of agreement were within 0.3 mg/g and the bias was less than 0.1 mg/g. An empirical ROC analysis found an area under the curve (AUC) greater than 0.98 for all readers for classifying patients as normal/mild iron overload vs. moderate/severe iron overload (cutoff = 7.0 mg/g) and for the task of classifying patients as normal vs. Mild/moderate/severe iron overload (cutoff = 3.0 mg/g). When comparing individual readers with Wood and Garbowski LIC values to Ferrriscan excellent correlation was found and R2 When comparing individual readers with Wood and Garbowski LIC values to Ferrriscan excellent correlation was found and R2 > 0.82 for all linear fits regardless of the relationship used to convert T2* and R2* to LIC.Conclusion
LIC analysis may be performed with accurate and reproducible results in children using an ROI or a whole liver segmentation technique using locally available software and the FerriScan® technique. LIC values over 10 mg/g vary using both techniques, perhaps due to artifact from the presence of high levels of iron.Acknowledgements
No acknowledgement found.References
1. De Sanctis V, Elsedfy H, Soliman AT, et al. Clinical and biochemical data of adult thalassemia major patients (TM) with multiple endocrine complications (MEC) versus TM patients with normal endocrine functions: a long-term retrospective study (40 years) in a tertiary care center in Italy. Mediterr J Hematol Infect Dis 2016; 8: e2016022.
2. Sharma R, Seth A, Chandra J, et al. Endocrinopathies in adolescents with thalassaemia major receiving oral iron chelation therapy. Paediatr Int Child Health 2016; 36: 22-7.
3. Wood JC, Zhang P, Rienhoff H, Abi-Saab W, Neufeld EJ. Liver MRI is more precise than liver biopsy for assessing total body iron balance: a comparison of MRI relaxometry with simulated liver biopsy results. Magn Reson Imaging 2015;33(6):761–767.]
4. Doyle E, et al, Fixing the MRI R2-iron calibration of the liver. Am J Hematol. DOI:10.1002/ajh.25754.
5. Garbowski MW, Carpenter JP, Smith G, et al. Biopsy-based calibration of T2* magnetic resonance for estimation of liver iron concentration and comparison with R2 Ferriscan. JCVMRI. 2014; 16:40.
6. Wood JC, Enriquez C, Ghugre N, et al. MRI R2 and R2* mapping accurately estimates hepatic iron concentration in transfusion-dependent thalassemia and sickle cell disease patients. Blood. 2005; 106(4):1480-1465.
Figures
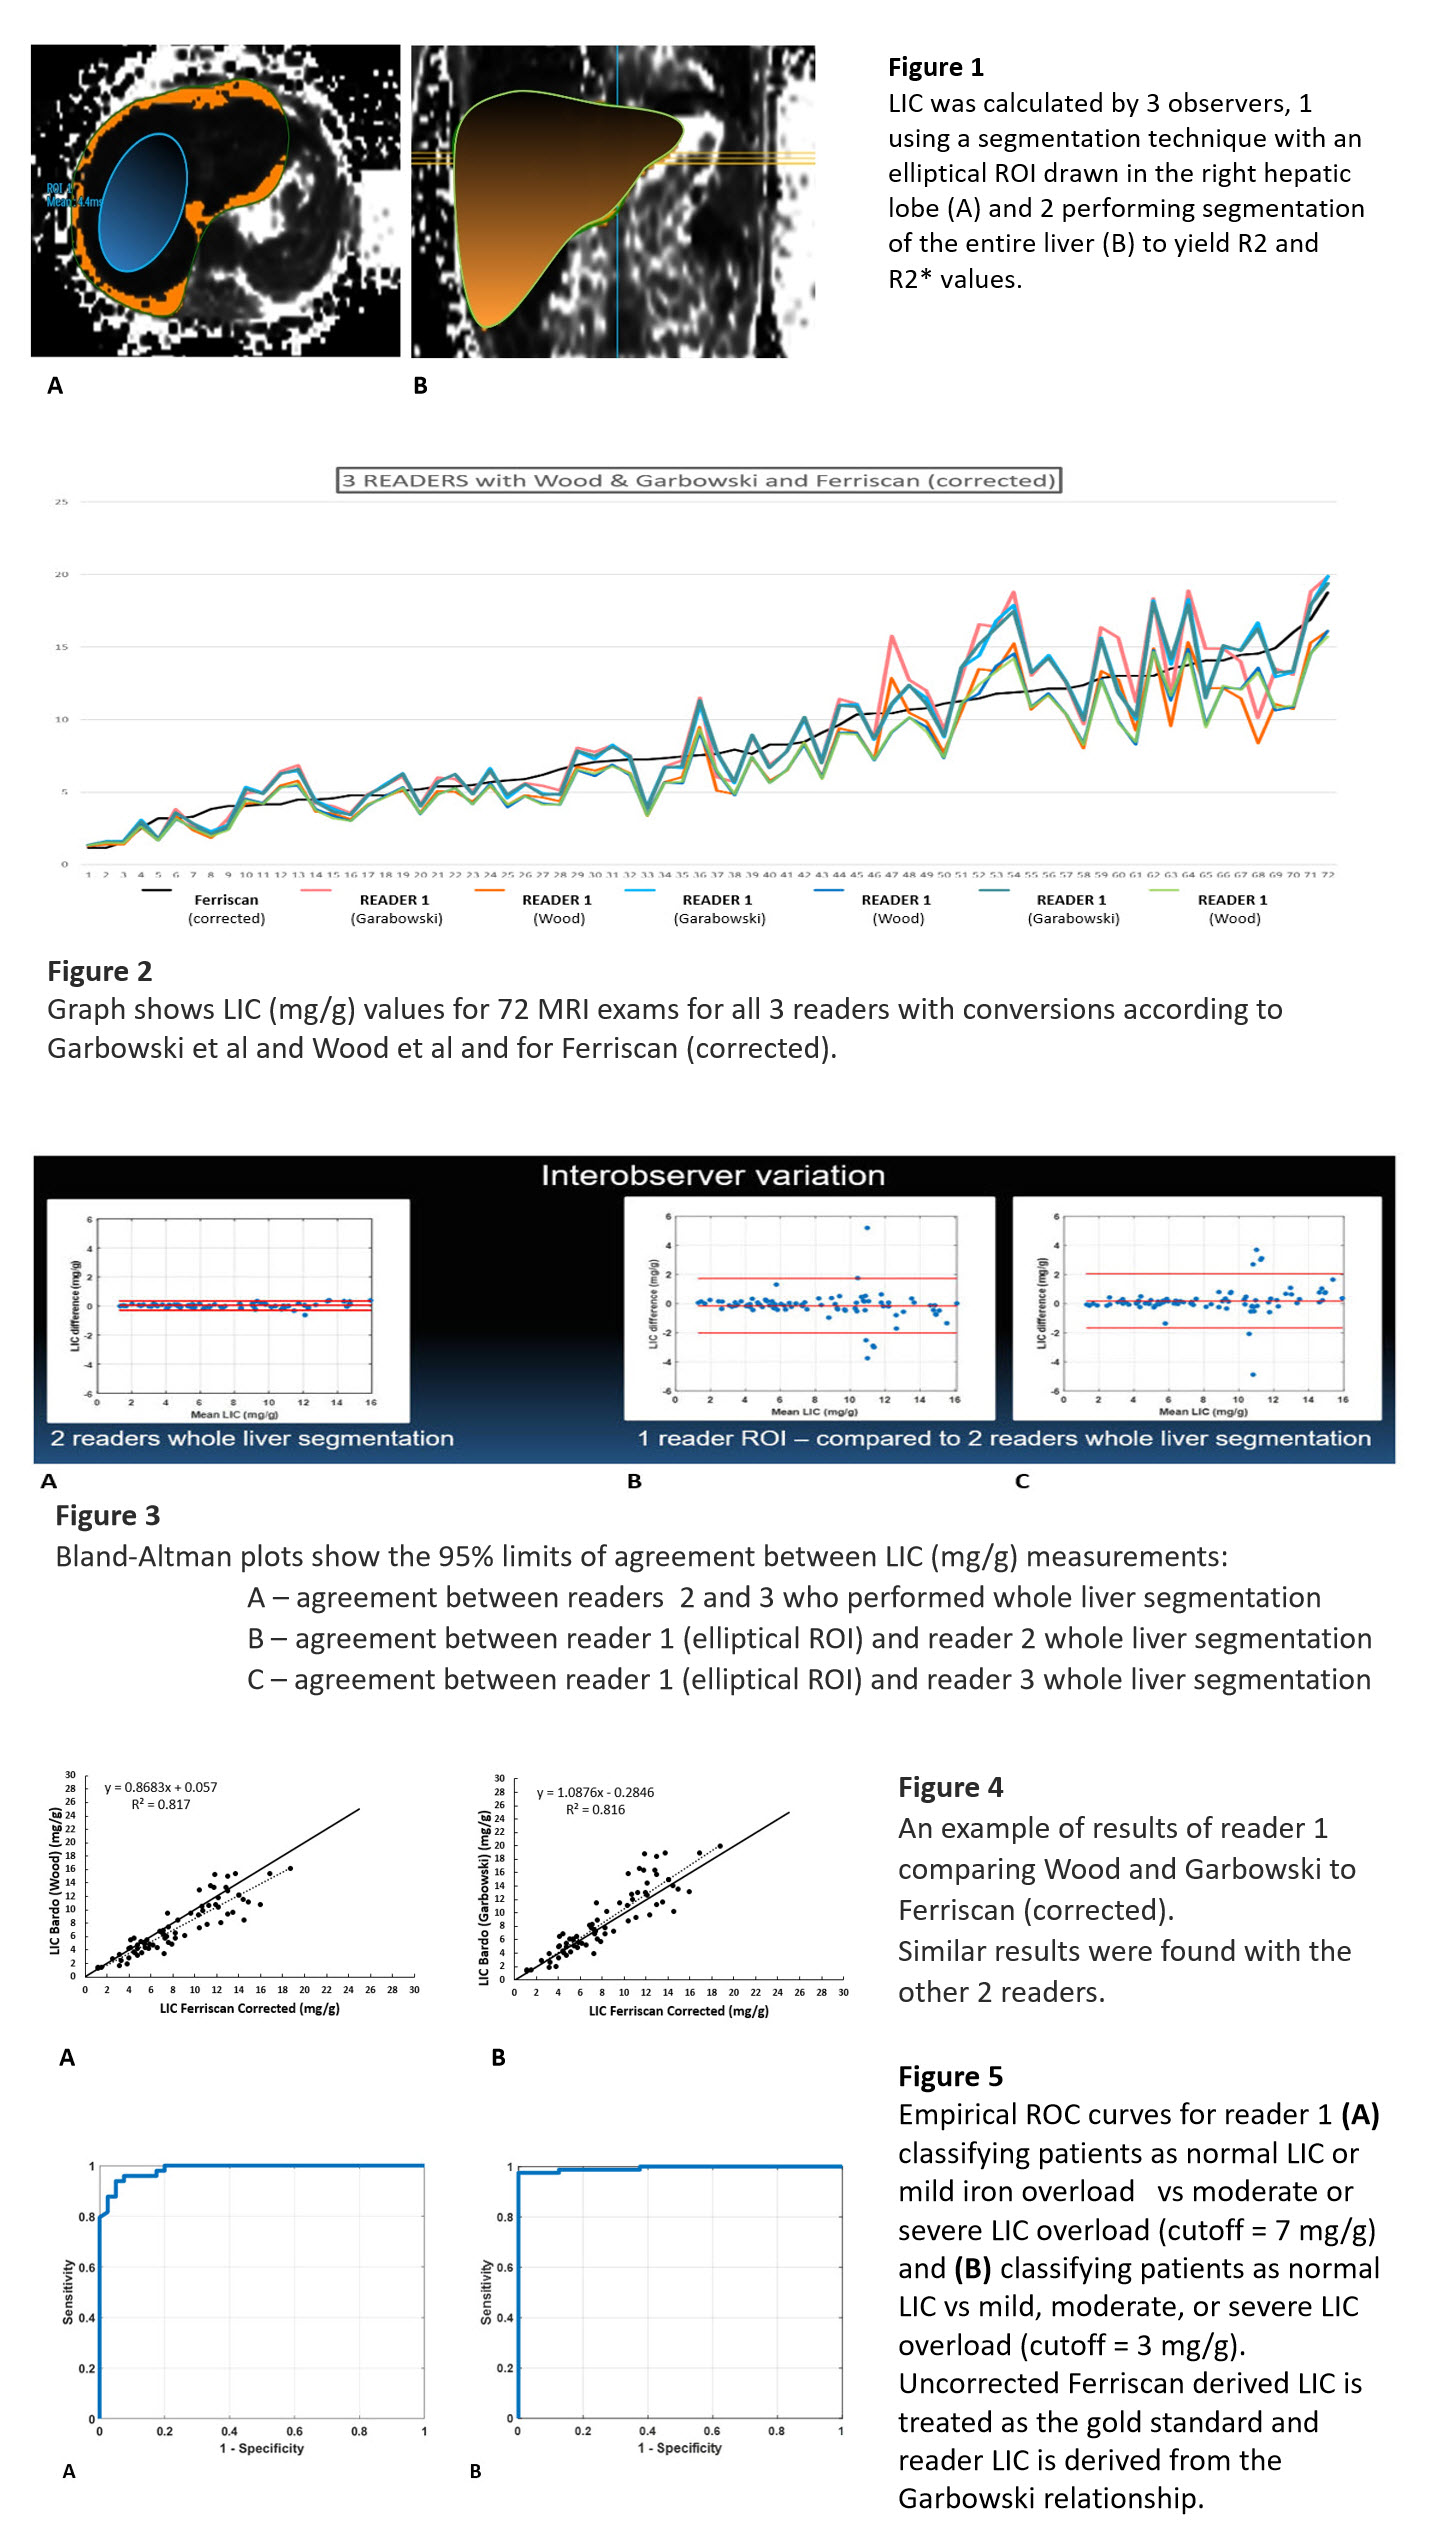
FIG 1 LIC ROIs
FIG 2 Graph comparison of LIC - all results
FIG 3 Bland-Altman plots
FIG 4 Sample individual results
FIG 5 ROC curves