2261
Artificial neural network derived myelin water fraction map with multi-echo gradient echo signal: brain development from infants to adults.1Radiology, The Catholic University of Korea, Seoul, Korea, Republic of, 2Yonsei University, Seoul, Korea, Republic of, 3Siemens Healthcare, Seoul, Korea, Republic of
Synopsis
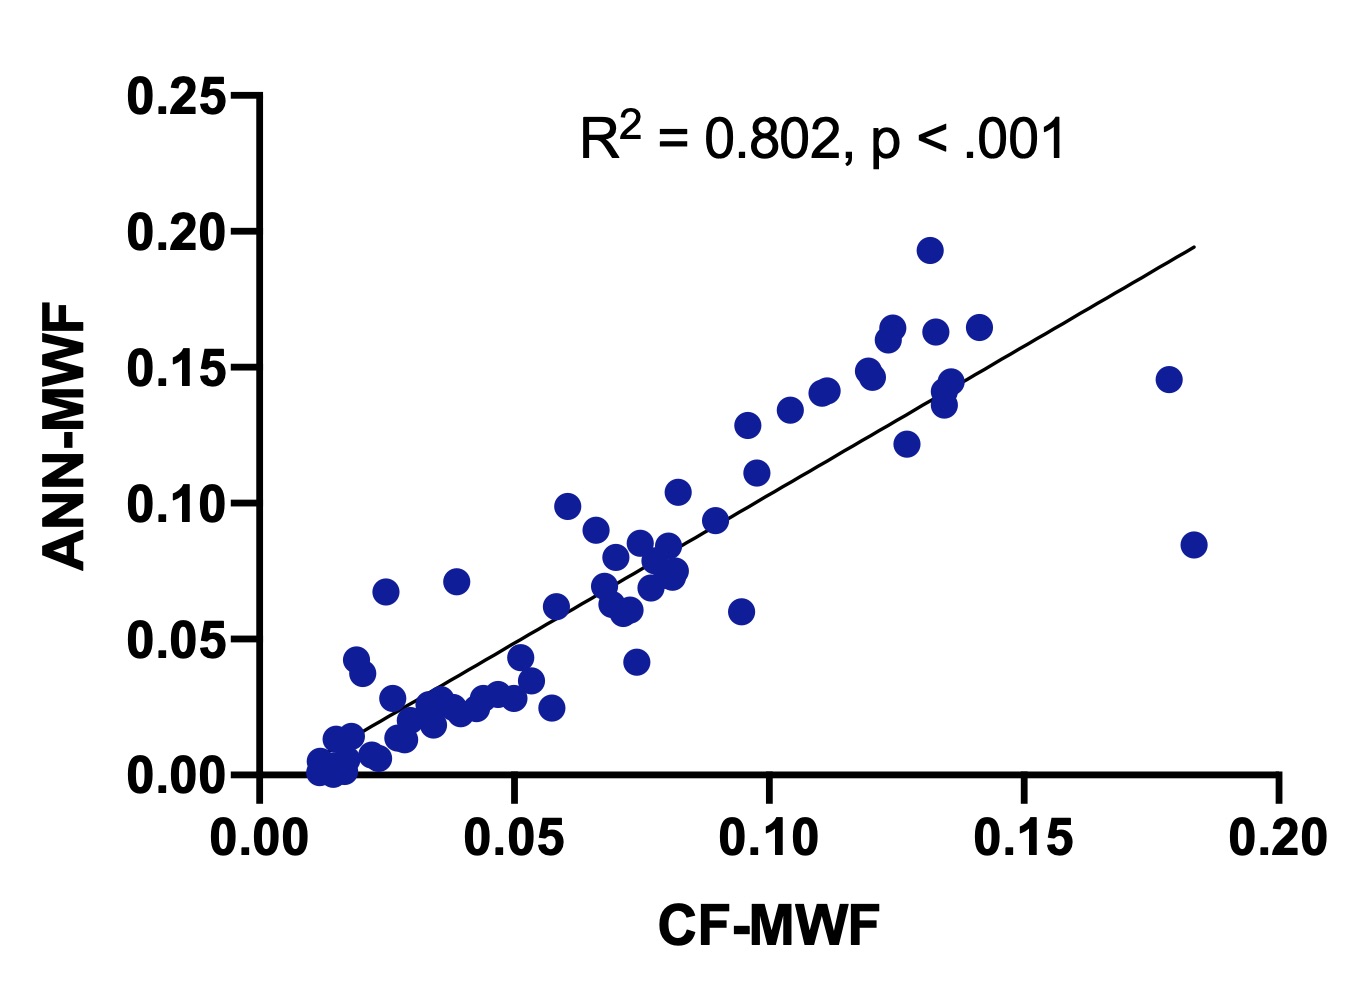
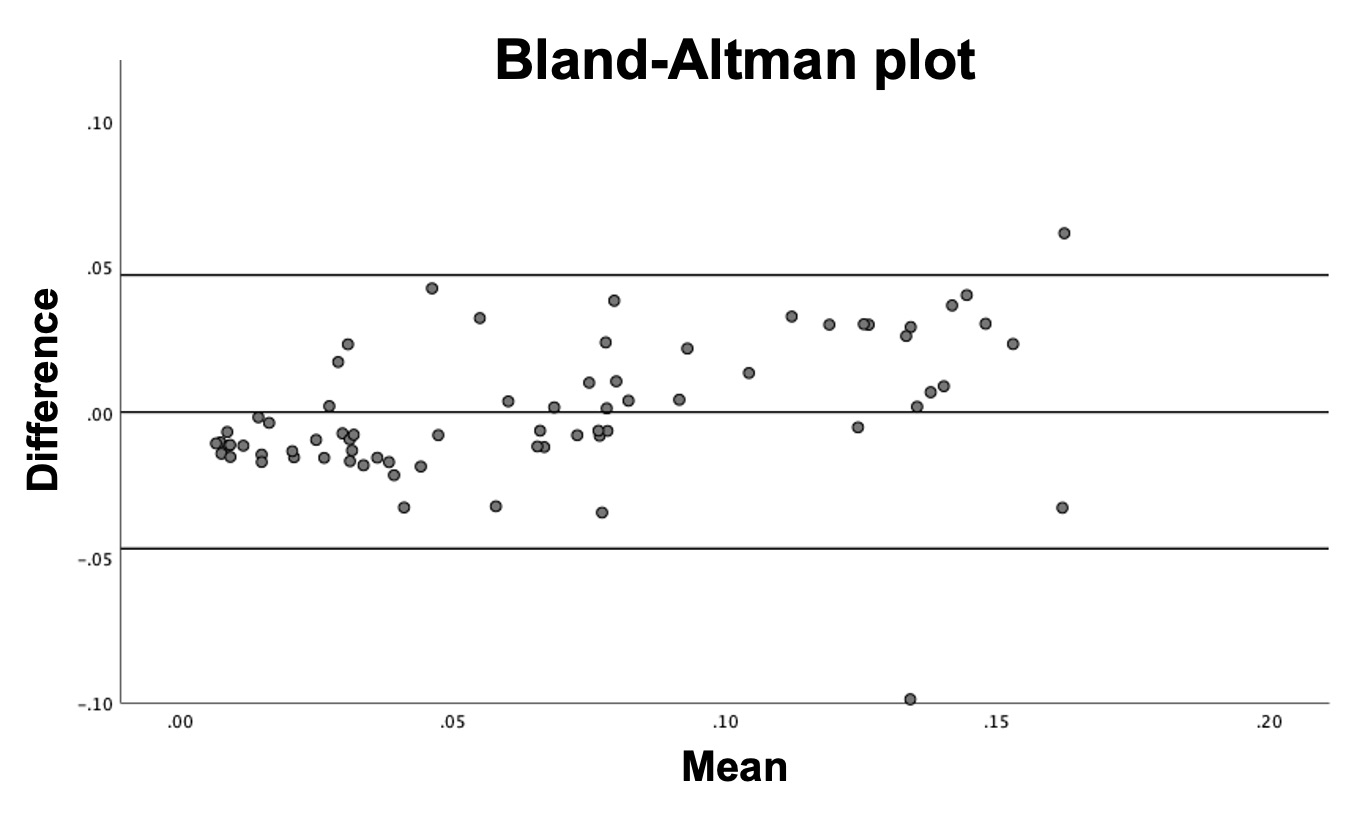
Myelin water fraction (MWF) values were obtained by an artificial neural network (ANN-MWF) and complex model fitting (CF-MWF) with 3D multi-echo gradient-echo (mGRE) signal. Linear regression test showed high correlation between ANN-MWF and CF-MWF values (R2 = 0.802, p < .001). Bland-Altman plot showed higher ANN-MWF values compared to CF-MWF values in the areas with high MWF values. The ANN-MWF values in the white matter showed a high association with age (R2 = 0.821, p =.005).
Introduction
3D multi-echo gradient echo (mGRE) requires a shorter acquisition time than conventionally used multi-echo spin-echo acquisition technique for myelin water fraction (MWF) imaging. 3D mGRE based MWF values can be derived using complex model fitting (CF-MWF).1 Recently, 3D mGRE based artificial neural networks (ANNs) were used for MWF map generation (ANN-MWF).2 The purpose of our study was to compare the ANN-MWF and CF-MWF values in both pediatric and adult subjects and to show regional development changes using the ANN-MWF map.Methods
We quantified MWF with 3D mGRE signal by applying both ANN and CF in seven subjects with wide age range (5 months – 436 months). Scanning parameter of 3D mGRE was as follows: repetition time = 40 ms, first echo time = 3.01 ms, echo spacing = 1.02 ms, number of echoes = 30, field-of-view = 256 × 256 × 80 mm, spatial resolution 2 × 2 × 2 mm (scan time: 3:26 minutes). To generate the training data set for the ANN-MWF, mGRE signals simulated with a three-pool exponential model (myelin water, axonal water and extracellular water) were used.2 For the CF-MWF, a fitting approach that does not require background phase removal was used.1 MWF values in different brain regions (frontal white matter [WM], parietal WM, occipital WM, basal ganglia, genu of corpus callosum, and splenium of corpus callosum) were obtained in both ANN-MWF and CF-MWF map. The relationship between the ANN-MWF and CF-MWF values was analyzed using a linear regression test. Bland-Altman plot was used to assess the comparability of mean MWF values derived from two different methods. The relationships between the regional ANN-MWF values and age were analyzed to show developmental changes in each brain region.Results
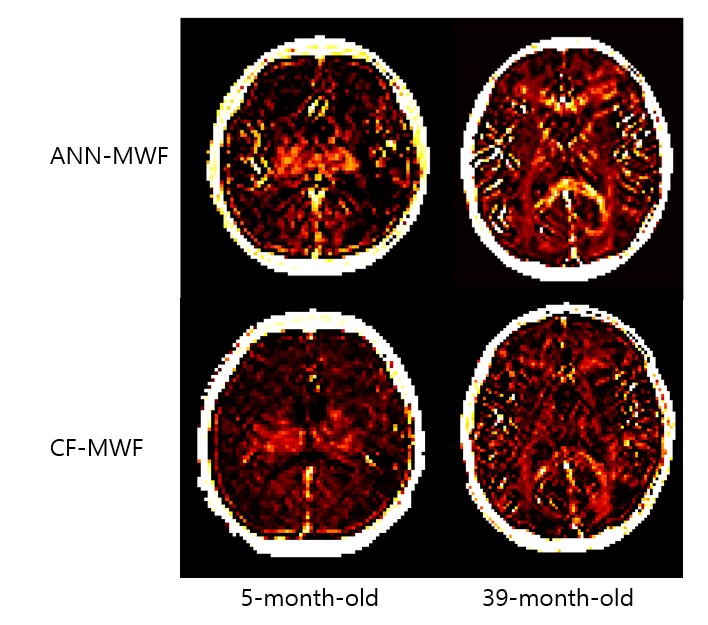
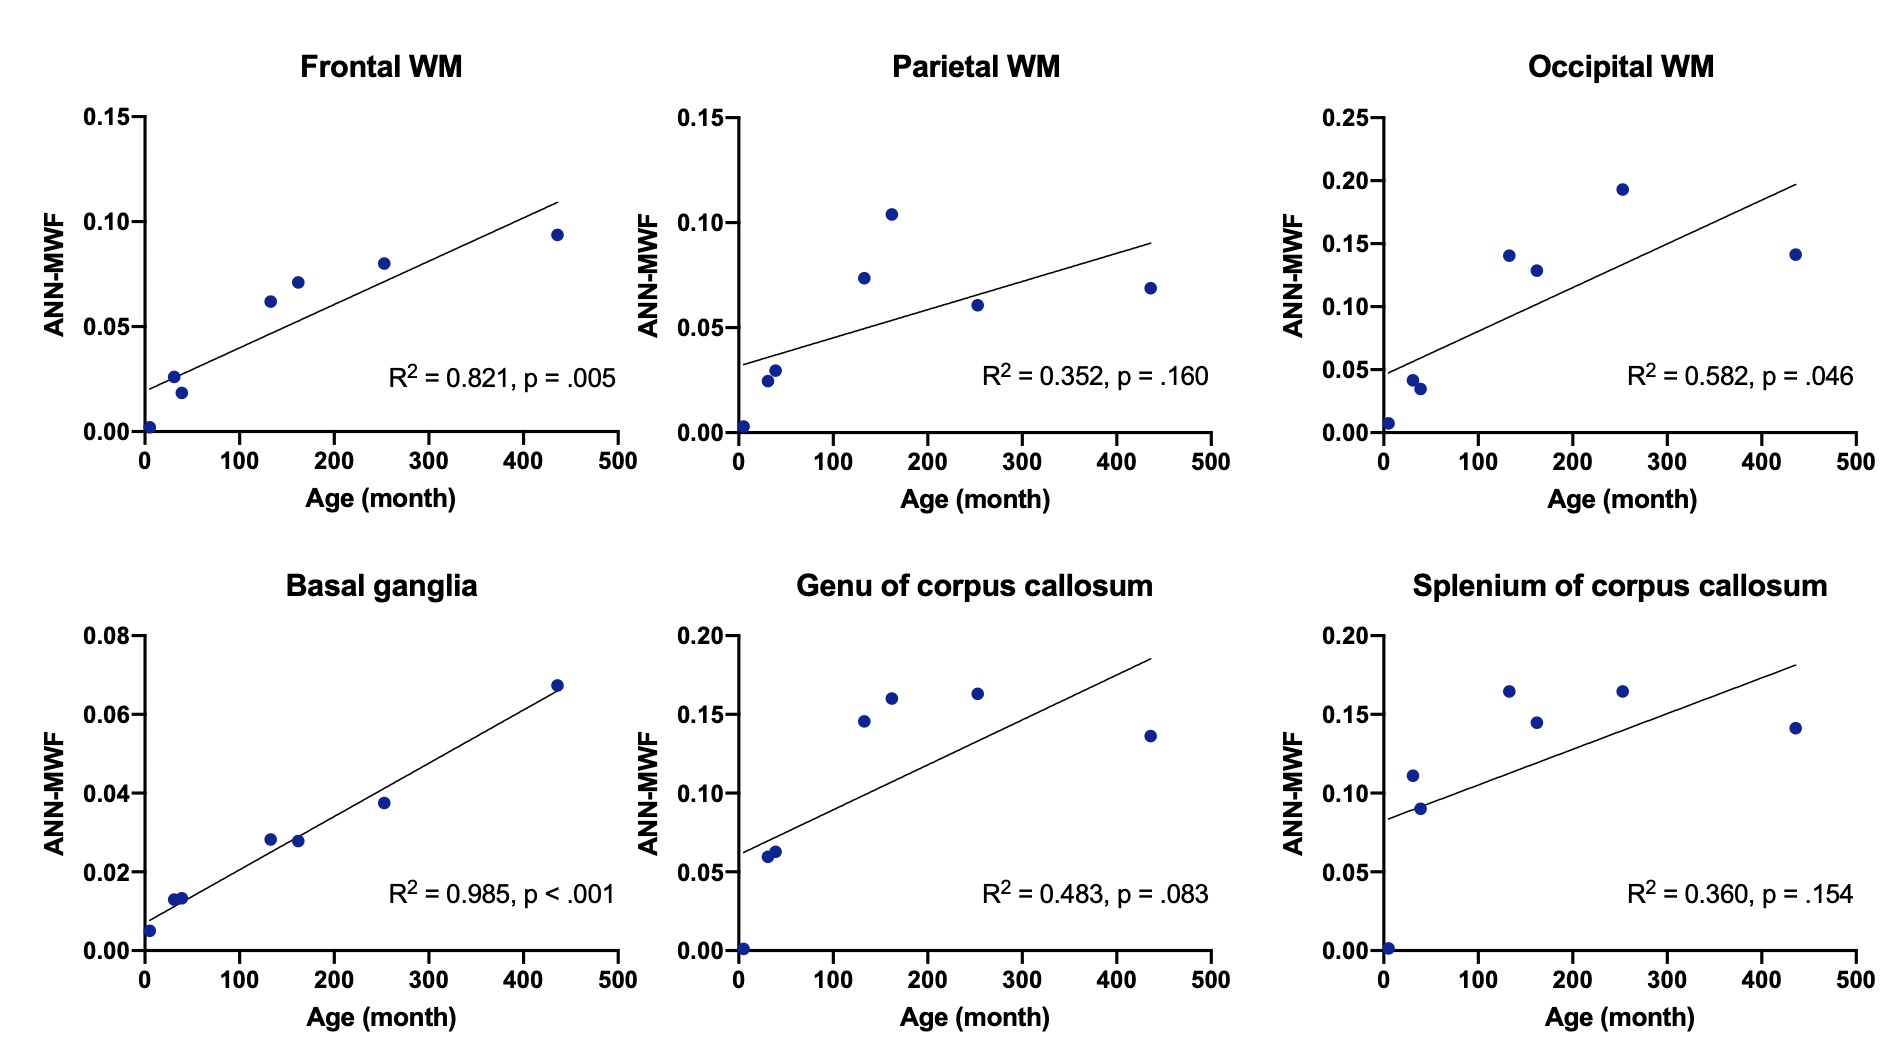
Reconstruction time of the ANN-MWF and CF-MWF maps for one subject were 3 minutes and 960 minutes, respectively (Figure 1). The ANN-MWF values showed a significant positive correlation with the CF-MWF values (R2 = 0.802, p < .001) (Figure 2). Bland-Altman plot showed a high agreement between the ANN-MWF and CF-MWF values, but regions with high MWF values showed relatively larger ANN-MWF values compared to the CF-MWF values (Figure 3). The ANN-MWF values showed positive association with age in frontal WM (R2 = 0.821, p =.005), occipital WM (R2 = 0.582, p = .046), and basal ganglia (R2 = 0.985, p < .001) (Figure 4). The ANN-MWF values in parietal WM (R2 = 0.352, p = .160), genu of corpus callosum (R2 = 0.483, p = .083), and splenium of corpus callosum (R2 = 0.360, p = .154) did not show significant association with age (Figure 4).Discussion
Quantitative myelin water imaging can show developmental changes in the brain and can be used for neurodevelopmental biomarkers. Among various myelin water imaging techniques, 3D mGRE is a promising sequence that requires relatively short scanning time. In our study, the 3D mGRE sequence was modified and it required less than 4 minutes for scanning. Using conventional complex modeling and fitting, however, MWF map generation required a long reconstruction time (960 minutes = 16 hours). On the contrary, our ANN base method required a much shorter and reasonable reconstruction time (3 minutes). We showed high agreement between the ANN derived MWF values and the CF derived MWF values. Using the ANN-MWF map, we could investigate regional MWF changes according to age, which was in line with the previous studies in children.3Conclusion
The ANN-MWF values showed good agreement with the CF-MWF values. We found age-related myelin changes in different brain regions using ANN-MWF maps. ANN derived MWF maps can be a useful tool for the assessment of brain development.Acknowledgements
We would like to thank Dr. Moon Hyung Choi, The Catholic University of Korea, for conversations and helpful feedback on this study.
References
1. Nam Y, Lee J, Hwang D, Kim DH. Improved estimation of myelin water fraction using complex model fitting. Neuroimage. 2015;116:214-221.
2. Jung S, Lee H, Ryu K, et al. Artificial neural network for multi-echo gradient echo-based myelin water fraction estimation. Magn Reson Med. 2021;85(1):380-389.
3. Kim HG, Moon WJ, Han J, Choi JW. Quantification of myelin in children using multiparametric quantitative MRI: a pilot study. Neuroradiology. 2017;59(10):1043-1051.
Figures