2251
Multivariate Associations Among Symptoms, Cognition, Behavior, and White Matter across ADHD and typically developing children1Radiology Department, Sichuan University, Chengdu, China, 2The Russell H. Morgan Department of Radiology and Radiological Science, Johns Hopkins University School of Medicine, Baltimore, MD, United States, 3Psychiatry Department, Sichuan University, Chengdu, China
Synopsis
In current study, we discovered several multivariate patterns of white matter properties linked to clinical symptoms, cognition and behavior across children with and without ADHD. Each dimension of phenotype was linked to a specific pattern of white matter microstructure alterations. Furthermore, these associations captured deviations between children with and without ADHD and displayed developmental effects. Together, these results suggest that complex ADHD phenotypes are associated with specific patterns of abnormal white matter microstructure during brain development.
Background
Attention-deficit hyperactivity disorder (ADHD) is a clinically heterogeneous neurodevelopmental disorder with the involvement of the alteration of white matter. The relationships of specific phenotypes to specific white matter property across ADHD is not well understood. Hence, we quantify the association between white matter and symptoms, cognitive and behavioral variables in ADHD using an integrated multivariate approach.Methods
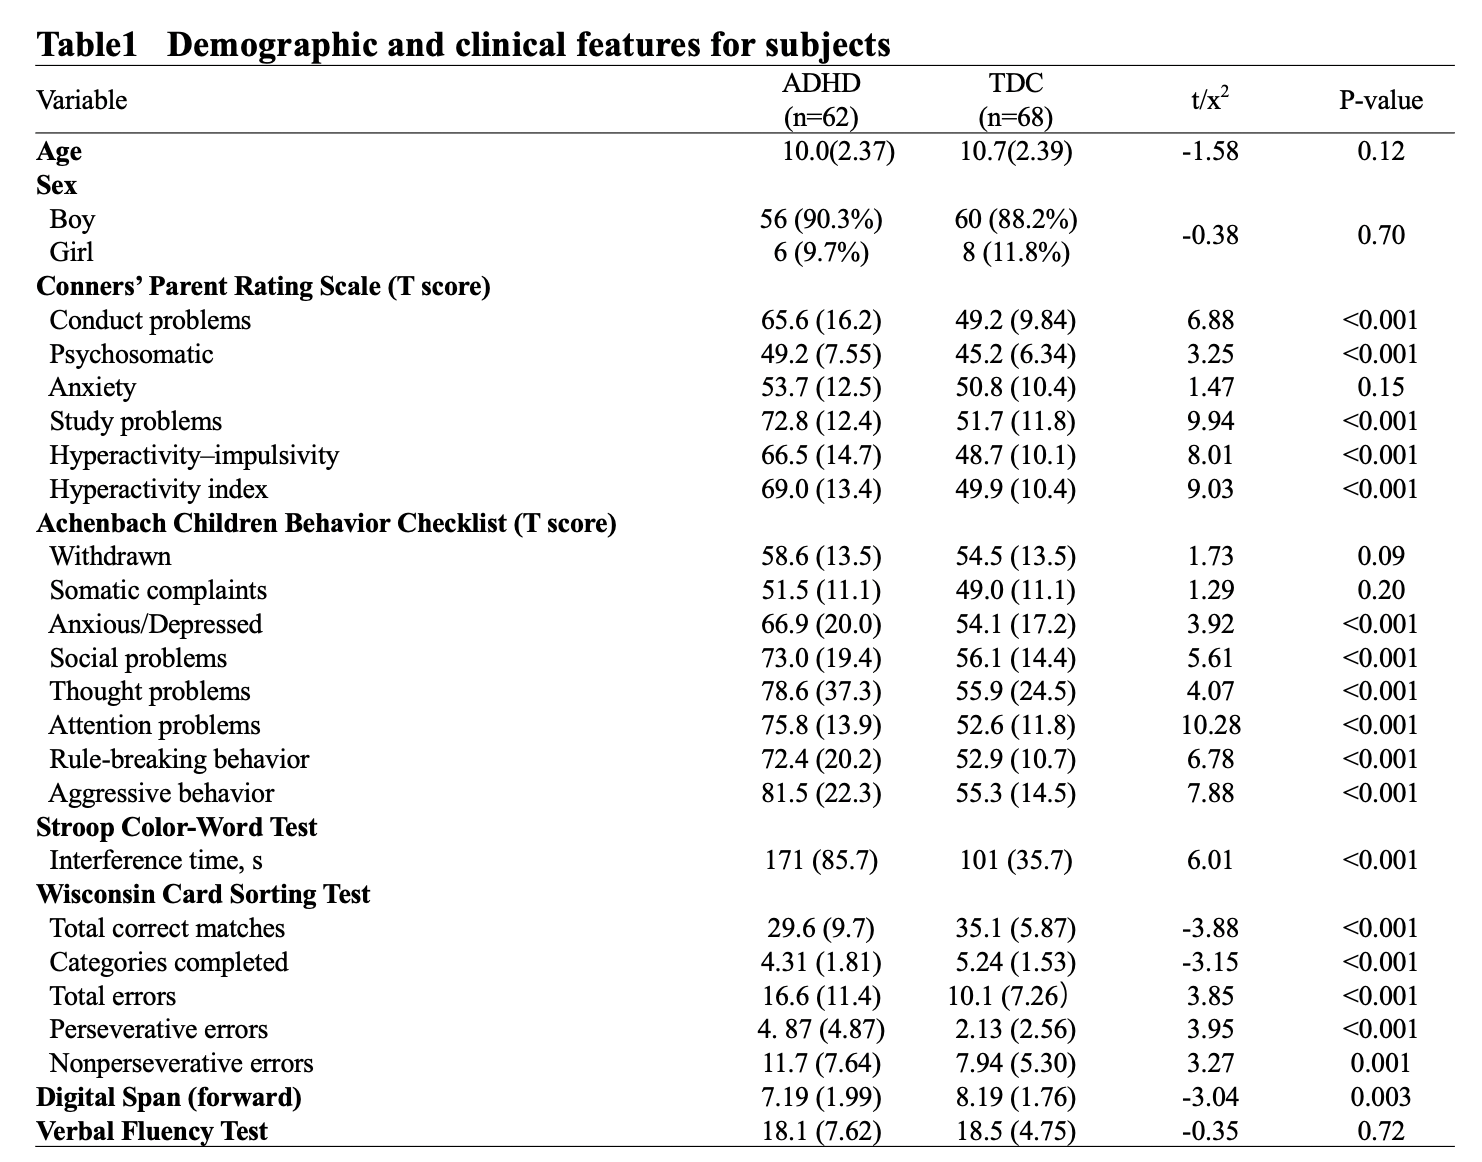
A total of 130 children with ADHD and typical developing children (TDC) were recruited (Table1). Phenotype measures pertaining to symptoms, cognition and behavior were evaluated using Conners' Parent Rating Scale (CPRS), a set of neuropsychological tests (Stroop color–word test, Wisconsin Card Sorting Test, Digit Span, Verbal Fluency Test) and Child Behavior Checklist. The MR data were acquired by Siemens Trio 3.0 T with an 8-channel head coil. The MR date for each subject include a T1- weighted anatomical scan and a DTI scan (20 directions, b values = 1000 s/mm2).The images were preprocessed and segmented using tools available in www.mricloud.org (Johns Hopkins University) 1. The whole brain was segmented into 276 structures for T1 image and 156 structures for DTI image, which could be grouped at five levels of granularity based on ontological relationships 2. In this study, we chose a median level of granularity, which led to 40 white matter structures for T1-weighted images and 19 white matter structures for DTI images. White matter volumes were obtained based on the T1 segmentation while FA, MD, RD and AD values were extracted from the DTI segmentation.
The multivariate associations between phenotype measures and white matter measures (FA, MD, RD, AD and volume) were modeled across ADHD and TDC using Regularized Generalized Canonical Correlation Analysis (RGCCA) with robust reliability testing. There were three types of phenotype measures (symptoms, cognition and behavior); we conducted a separate RGCCA for each type. After capturing the associations, we used linear discriminant analysis(LDA) with the significant CCA constructs as predictors and diagnose as dependent variables to determine which of the constructs most efficiently captured deviations between ADHD and TDC. LDA creates a linear combination of the predictors and returns discriminant functions (DF). The group differences can be evaluated by calculating the scores of DF. We further examined whether DF and symptom change with age using linear regression.
Results
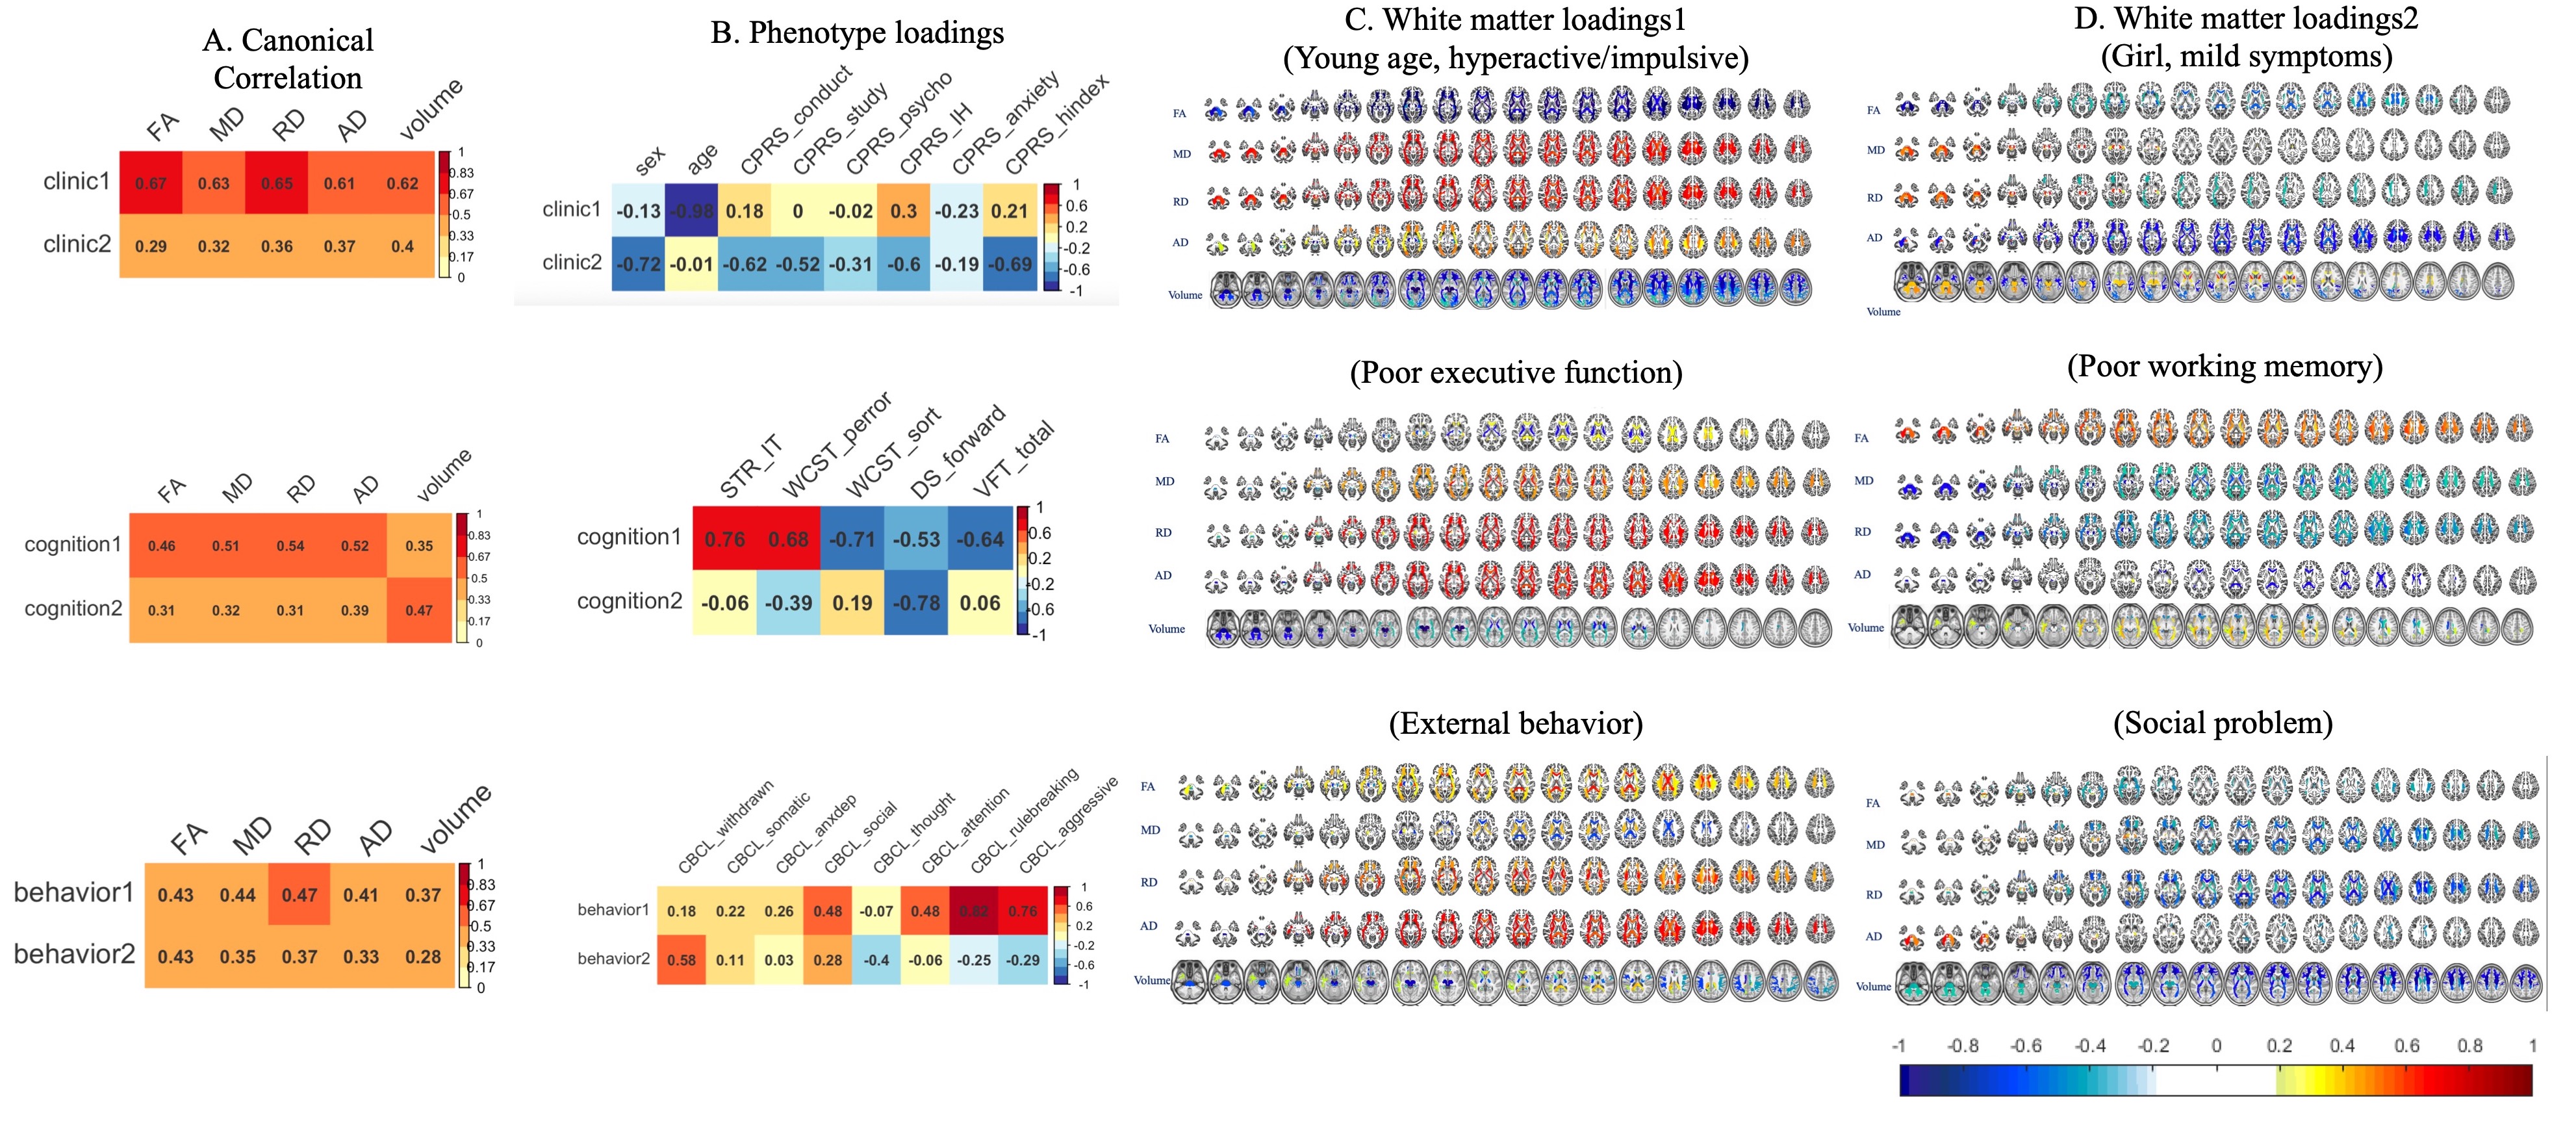
RGCCA latent variate pairs were retained if their correlation was significant (p <0.05/3) This criterion was met for the first and second canonical correlation pairs for all three analyses. The canonical correlations ranged from r = 0.28 to r = 0.67.For clinical analysis, the first CCA construct related young age and impulsivity-hyperactivity to lower FA , higher RD, and decreased volume across all white matter; the second CCA construct related girl and mild symptom to lower FA, higher AD, and increased volume.
For cognitive and behavioral analysis, poor executive function and external behavior associated with similar white matter pattern: higher FA, MD, RD, AD in association tracts , cingulum bundle and corona radiation; higher FA, AD, lower MD, RD in corpus collosum, and fornix lower FA, higher MD, RD, AD in internal capsule and corticofugal higher FA, lower MD, RD, AD in cerebellum white matter lower FA, MD, RD, AD in CST at brainstem portion. Poor working memory associated with higher FA and lower MD, RD in most white matter. Social problem associated with lower FA, MD, RD, AD in long-range fibers. The overall results of RGCCA were provided in Figure1.
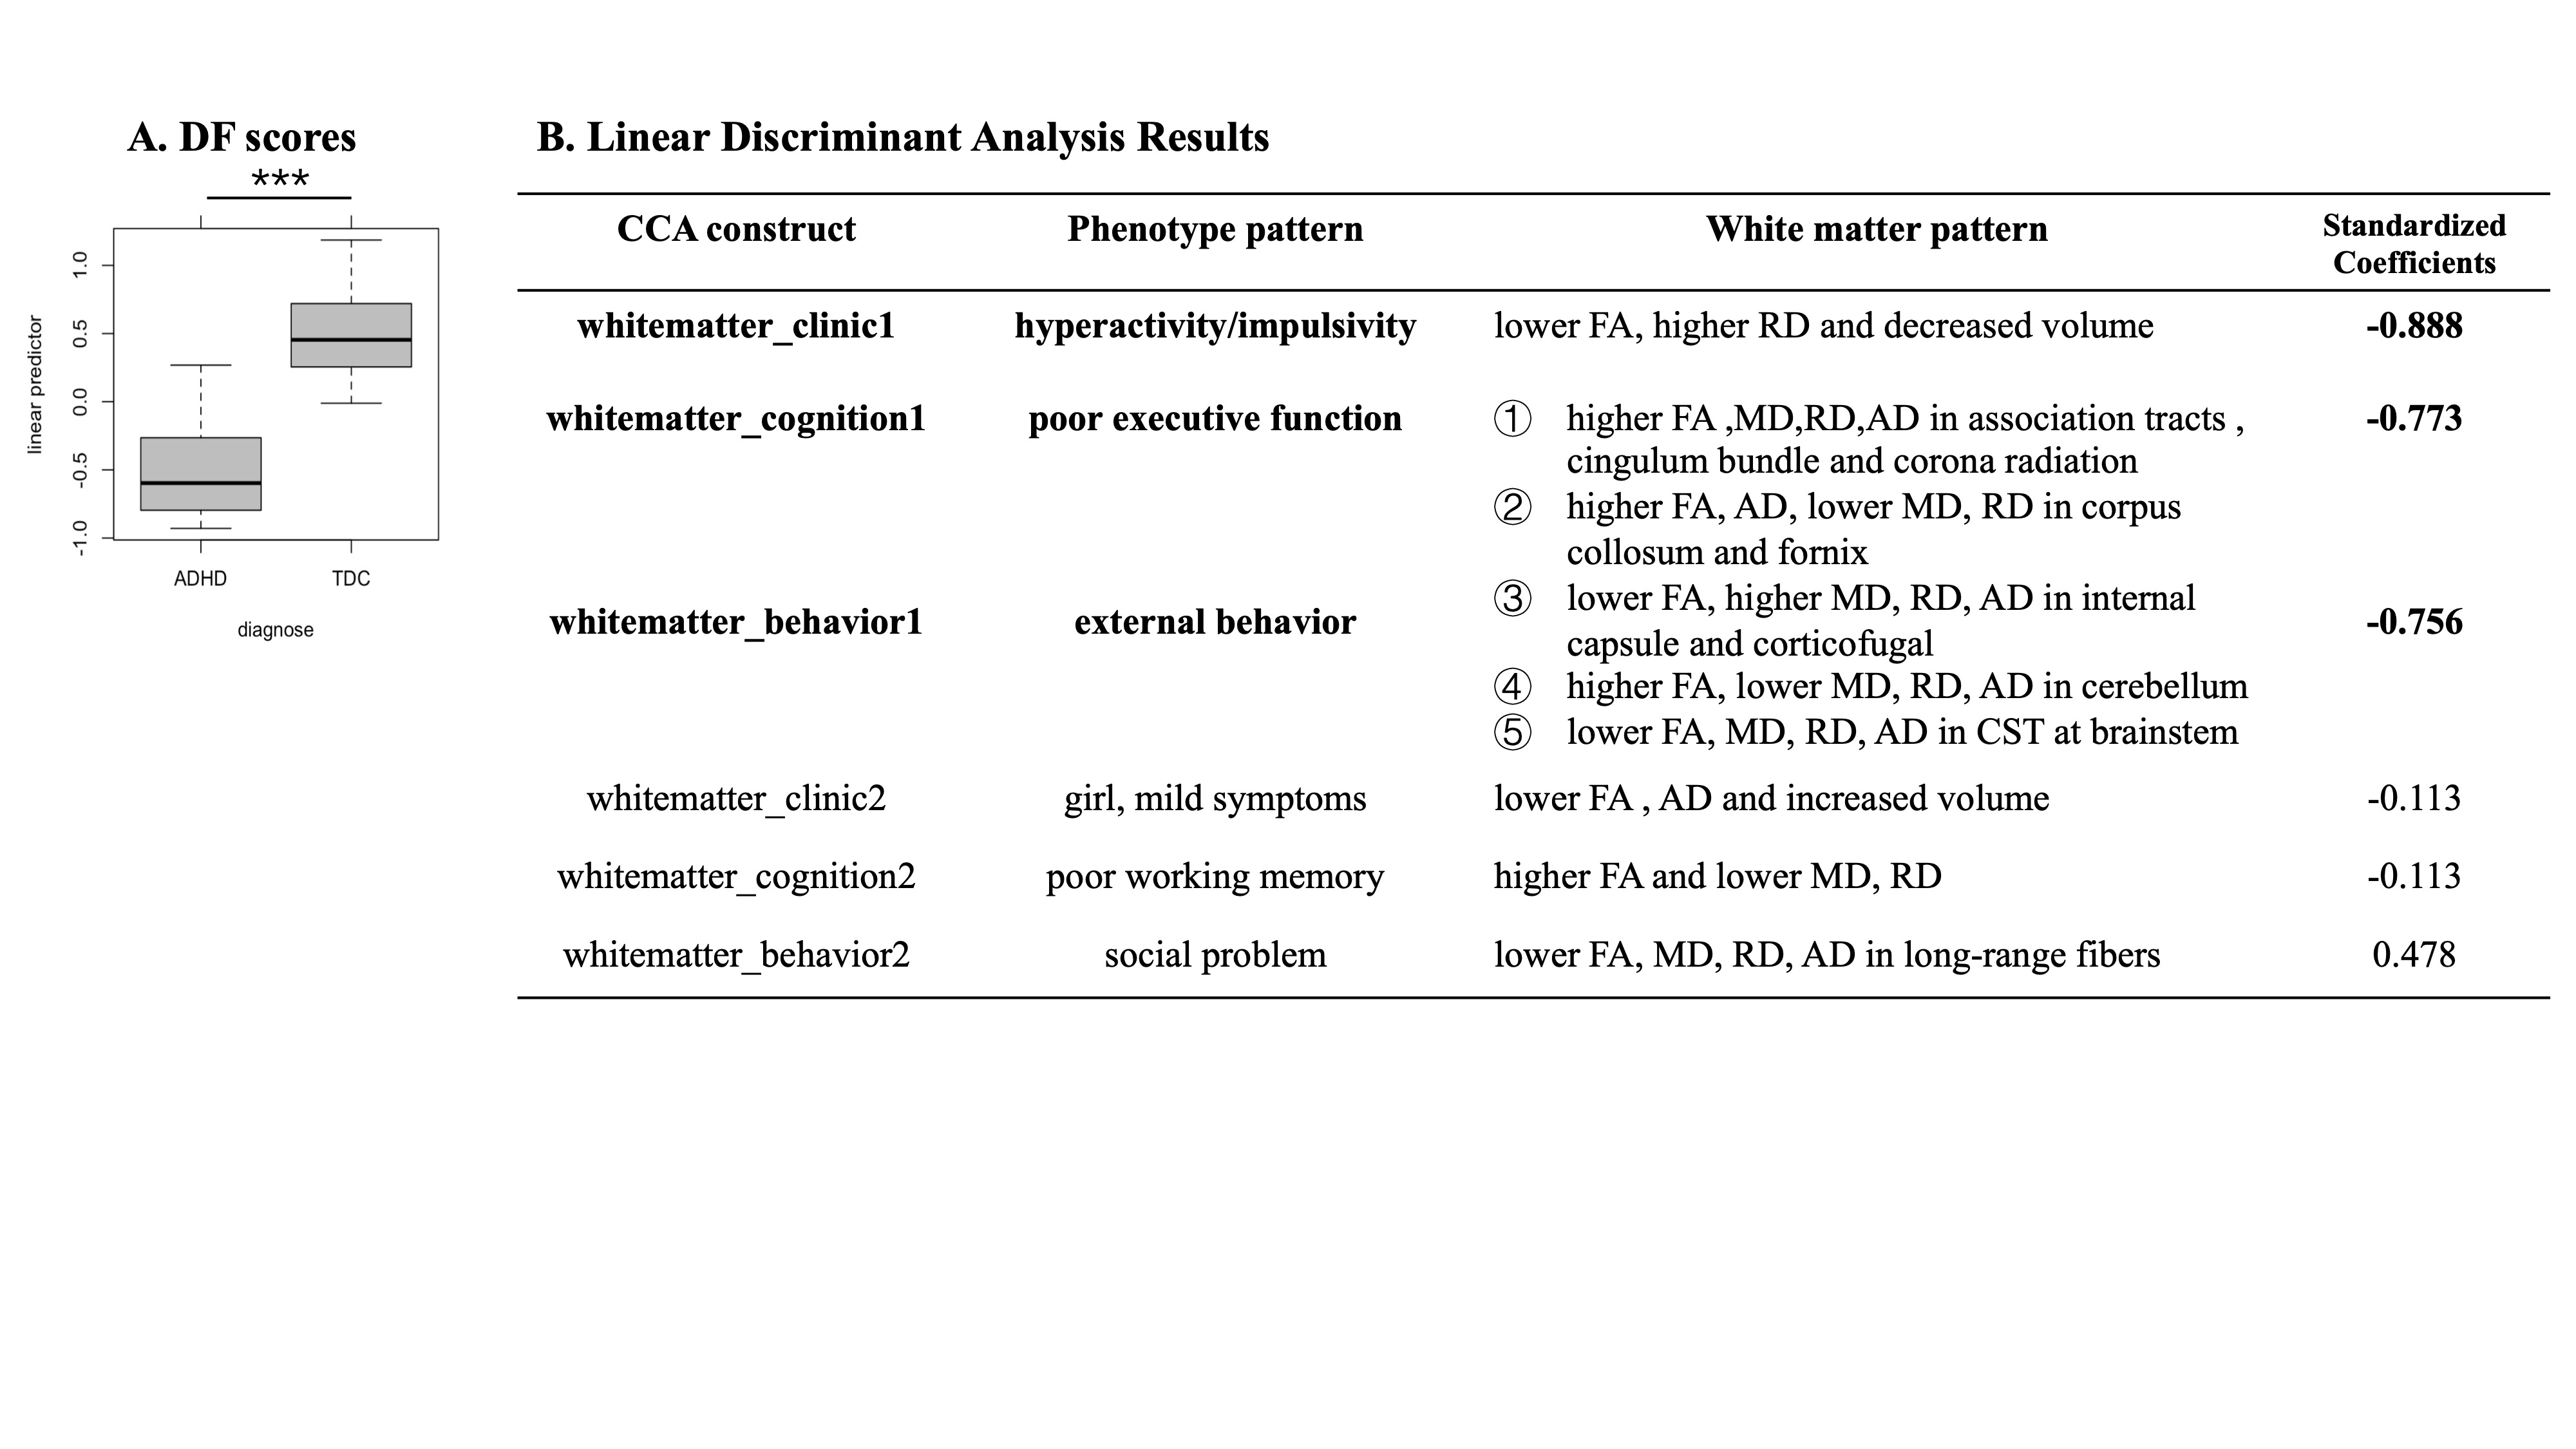
The DF resulted from the LDA captured significant difference between ADHD and TDC showing ADHD children had higher DF scores than TDC did (Figure 2A). This DF was negatively associated with the first CCA constructs of the three RGCCA analysis, namely hyperactivity/impulsivity, executive function and external behavior and their relation to specific white matter variation pattern (Figure 2B).
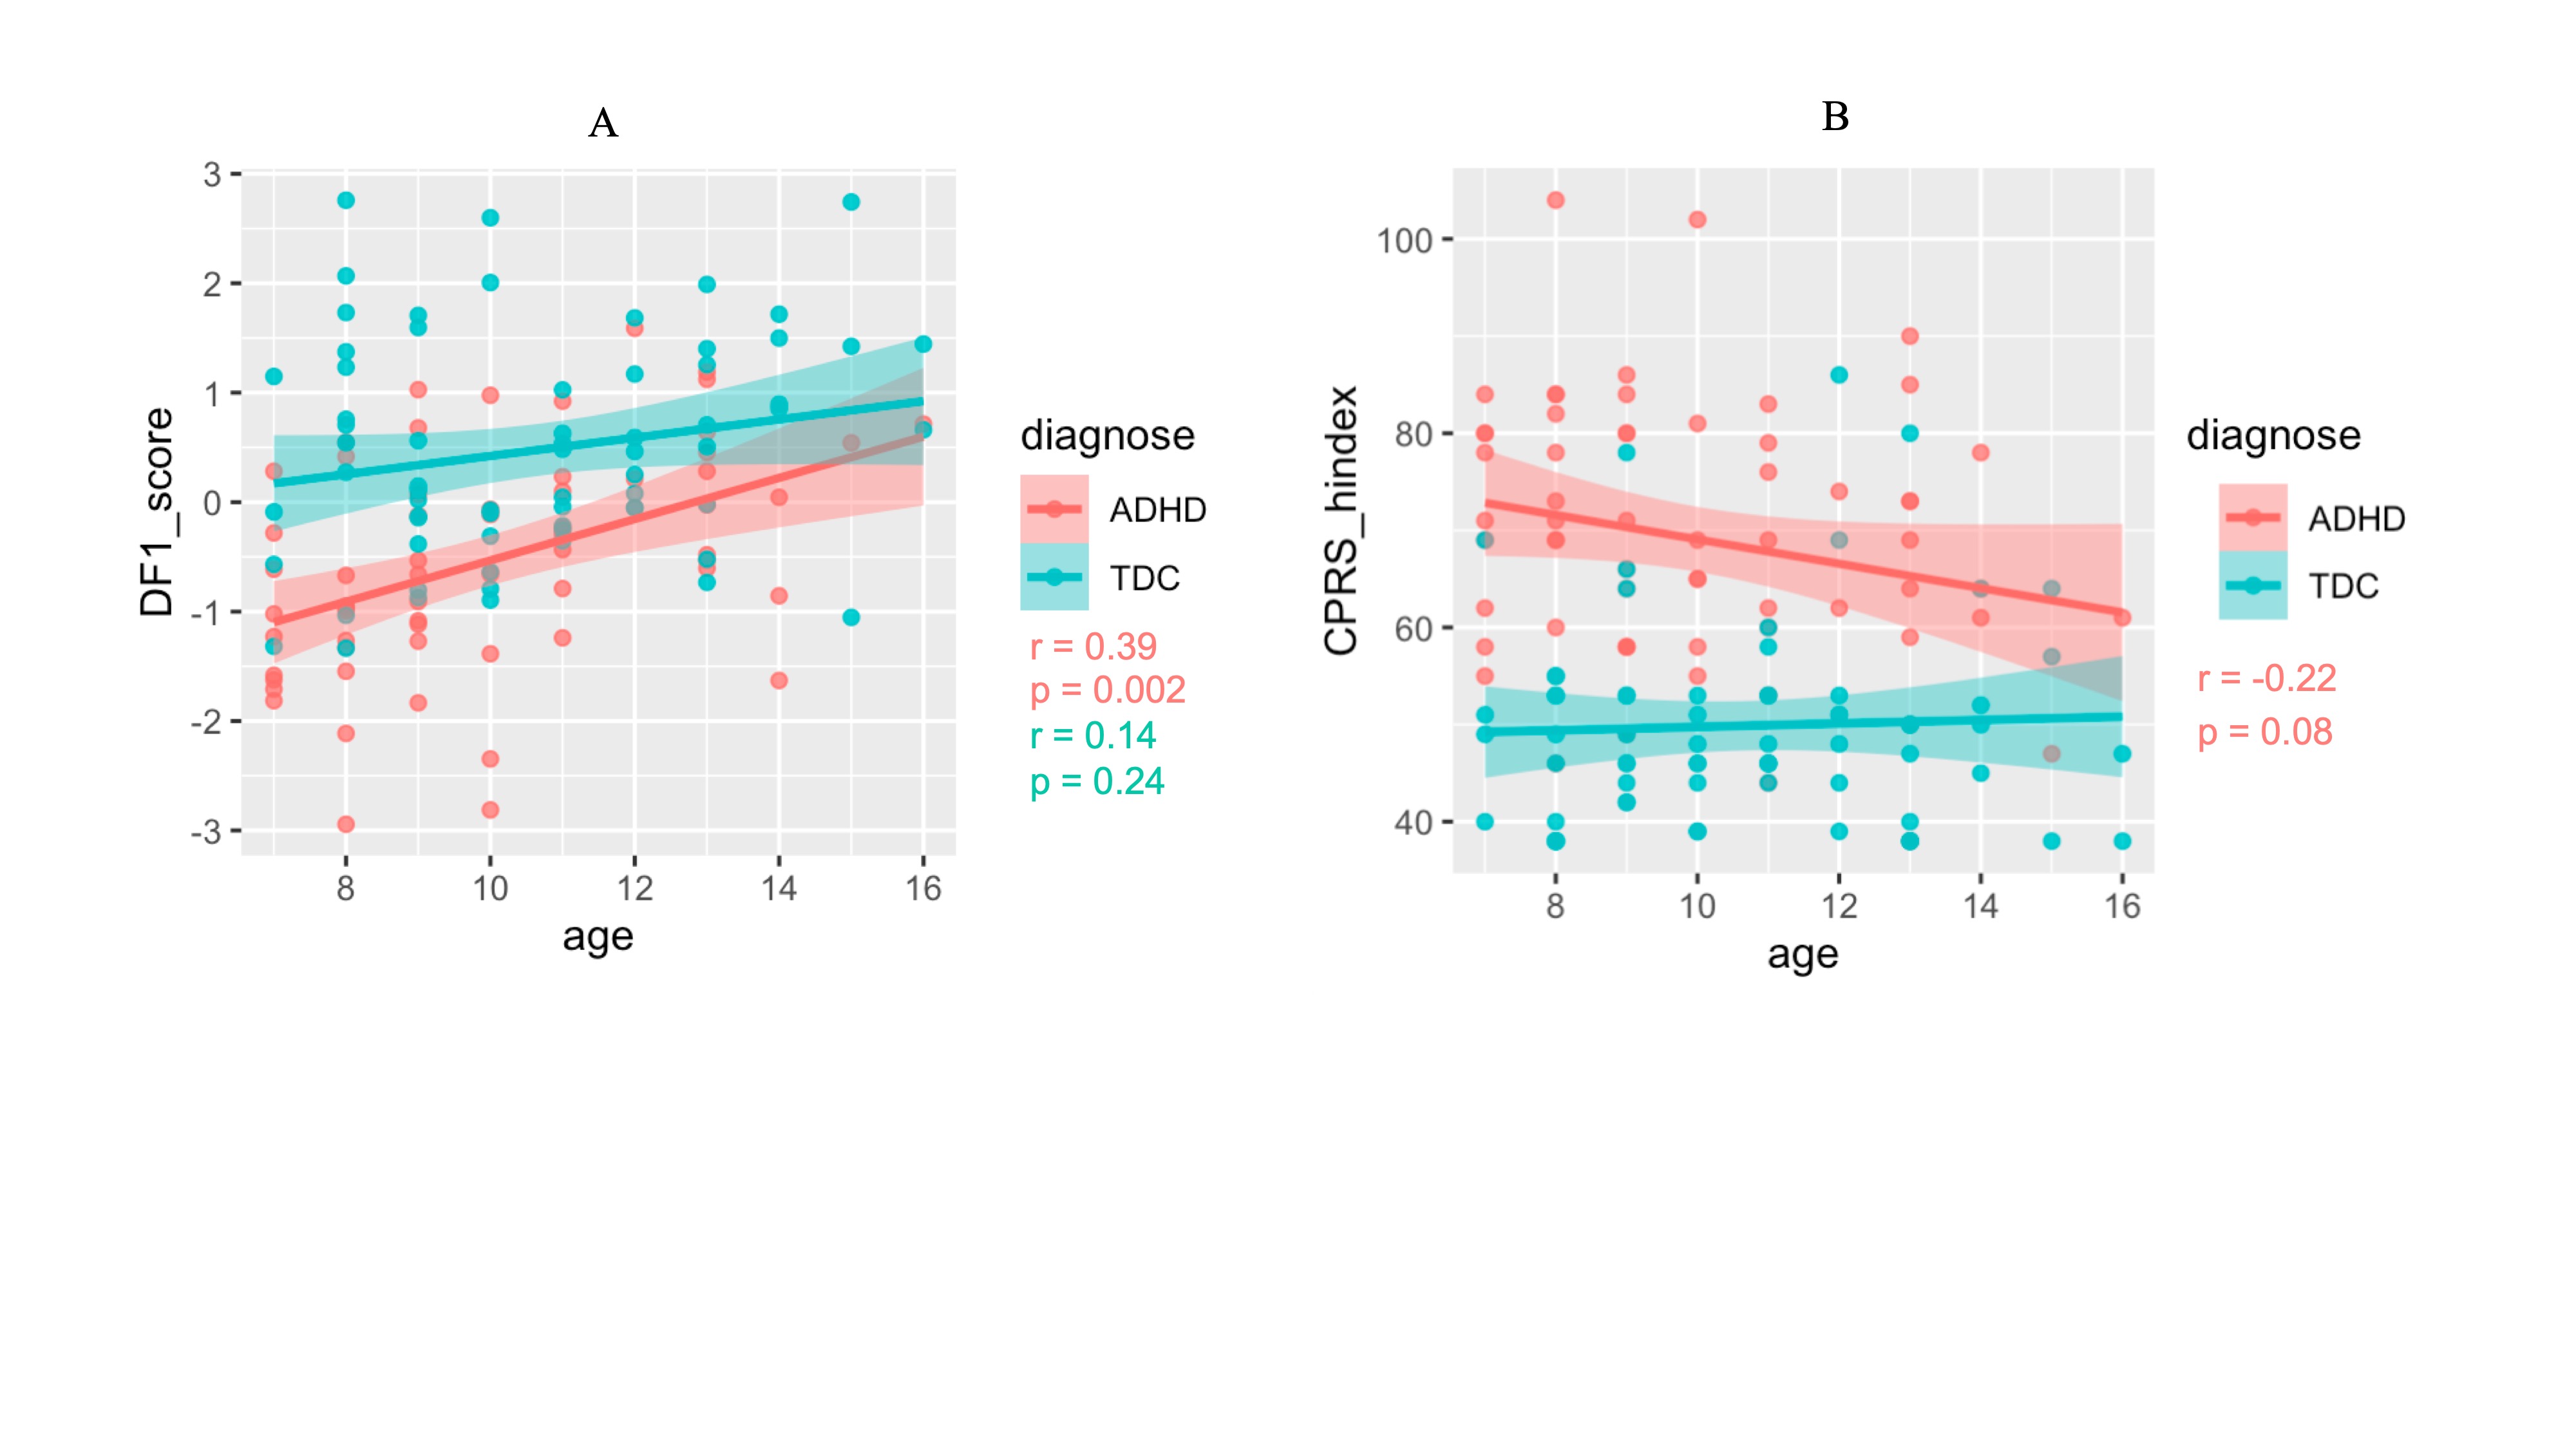
The regression analysis indicated that discriminant scores increased with age in both ADHD children and typical children, whereas ADHD children started at a lower level and increased towards typical level with development (Figure 3A). Hyperactivity symptom relieved with development among ADHD children while remains stable at low level in TDC (Figure 3B).
Discussion & Conclusion
As far as we know, current study is the first to demonstrate the multivariate association between white matter alterations and various phenotypes of ADHD. We revealed specific white matter abnormalities in the different brain circuits which may give rise to ADHD heterogenous. Discriminant analysis based on these associations further suggests that the brain-phenotype deviations among children with and without ADHD have diagnostic consequences and developmental effect, suggesting ADHD symptom improvement and the convergence of brain-phenotype deviations from an atypical childhood baseline toward more typical level.Acknowledgements
This study was supported by National Nature Science Foundation (Grant NO. 81671669)References
1. Mori, S., D. Wu, C. Ceritoglu, Y. Li, A. Kolasny, M. A. Valliant, A. V. Faria, K. Oishi and M. I. Miller (2016). "MRICloud: Delivering High-Throughput MRI Neuroinformatics as Cloud-Based Software as a Service." Comput. Sci. Eng 18: 21-35.
2. Djamanakova A, Tang X, Li X, Faria AV, Ceritoglu C, Oishi K, Hillis AE, Albert M, Lyketsos C, Miller MI, Mori S (2014): Tools for multiple granularity analysis of brain MRI data for individualized image analysis. NeuroImage 101:168–176.
Figures