2250
Disentangling neurite and soma contributions to cortical microstructural development in vivo1Cardiff University Brain Research Imaging Centre (CUBRIC), Cardiff University, Cardiff, United Kingdom, 2Developmental Imaging, Murdoch Children's Research Institute, Parkville, Australia, 3Centre for Medical Image Computing and Department of Computer Science, University College London, London, United Kingdom
Synopsis
MRI studies of cortical development have revealed macroscopic changes in morphology, with thickness/volume decreasing over childhood and adolescence. Recent microstructural modelling advances hold promise for quantifying the cellular changes driving these observations. We characterised cortical neurite and soma microstructure in 88 participants aged 8-18 years.
Key findings:
- a positive age-relationship for neurite fraction and orientation dispersion, suggesting that axons/processes increase in density and branch/elongate with age;
- a lower apparent soma radius with age, which may indicate selective neuronal soma loss and/or glial infiltration.
Overall, our study provides in vivo evidence of distinct developmental patterns of cortical neurite and soma microstructure.
Introduction
MRI studies of cortical development over childhood and adolescence[1] consistently show that grey matter volume, cortical thickness and surface area decrease with age[2,3]. Whilst conventional structural MRI is sensitive to brain macrostructure, it is relatively non-specific to microstructural properties.Cortical cytoarchitecture is broadly categorised into neurites (e.g., axons, dendrites and glial processes) and soma (e.g., neuronal and glial cell bodies). Synaptic pruning was initially thought to drive developmental changes in cortical morphology[4], but recent evidence suggests that myelin encroachment into the grey/white matter boundary may also drive the apparent shift in MR image contrast[5]. Little is known about soma contributions to these distinct morphological changes. Recent progress in acquisition[6] and microstructural modelling approaches[7,8] provide promise in disentangling biologically meaningful cellular components in vivo using diffusion MRI[9].
In a sample of children and adolescents aged 8-18 years, we characterise neurite and soma properties to uncover developmental patterns of cortical microstructure.
Methods
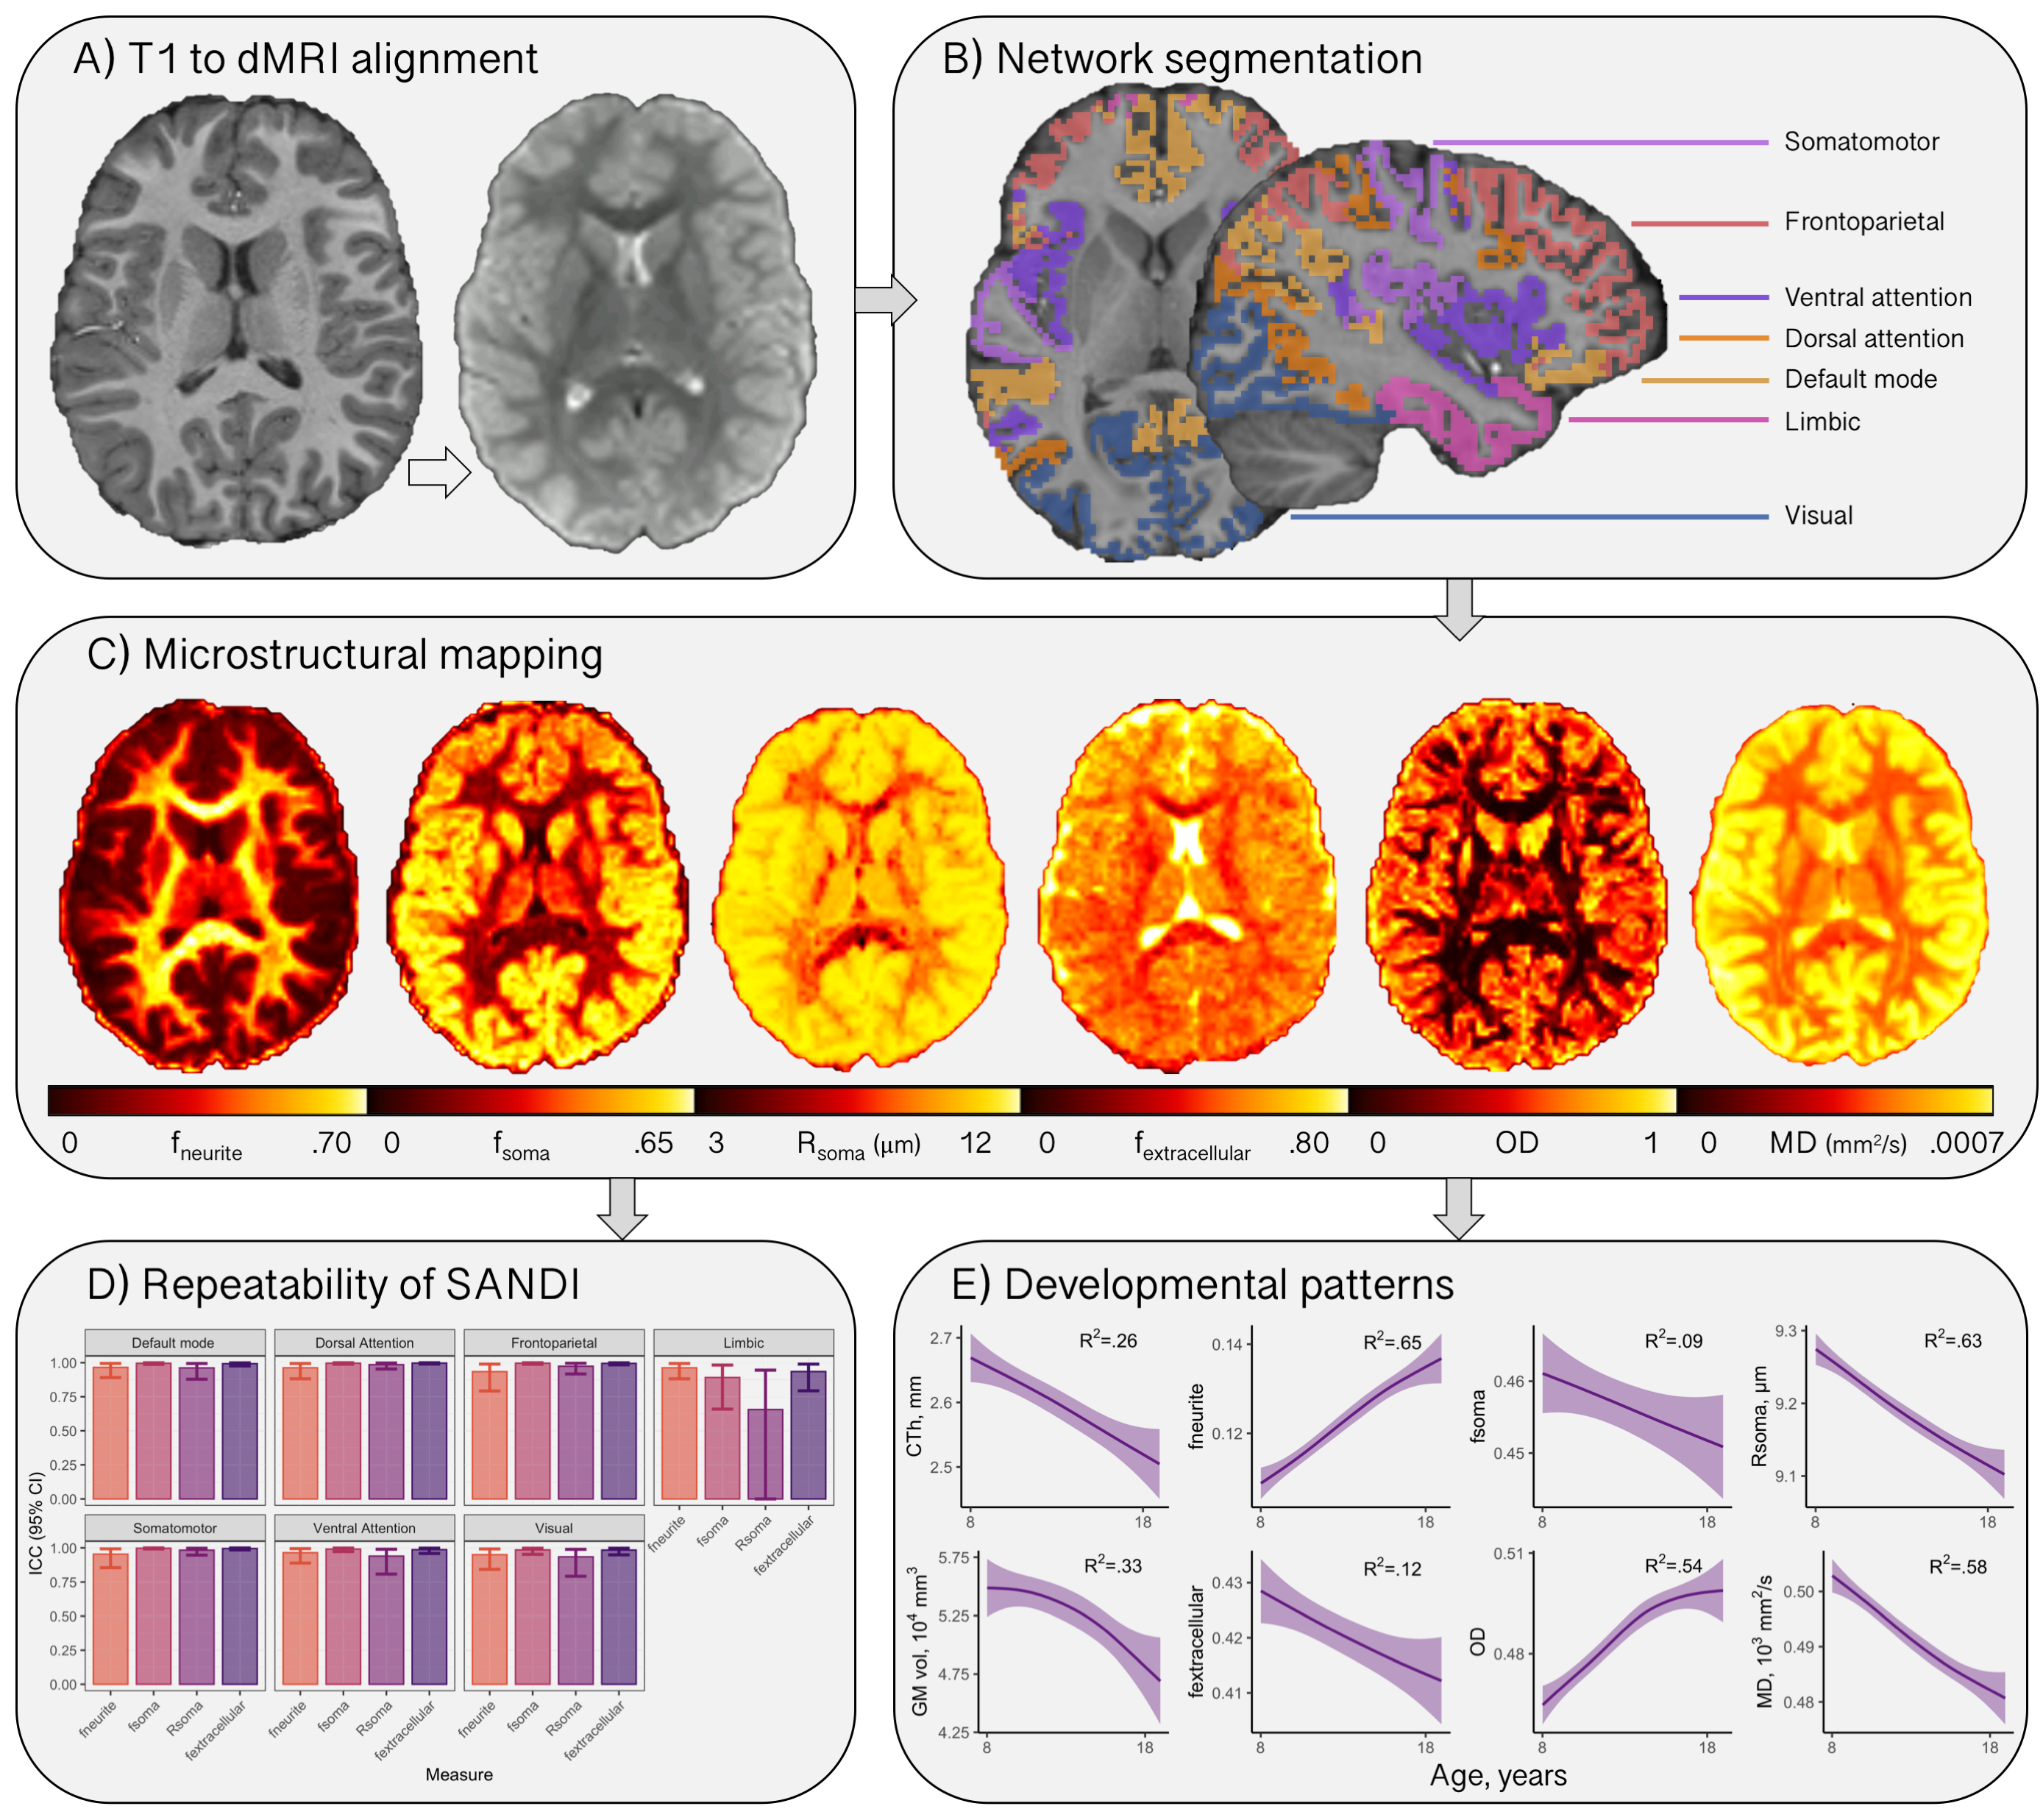
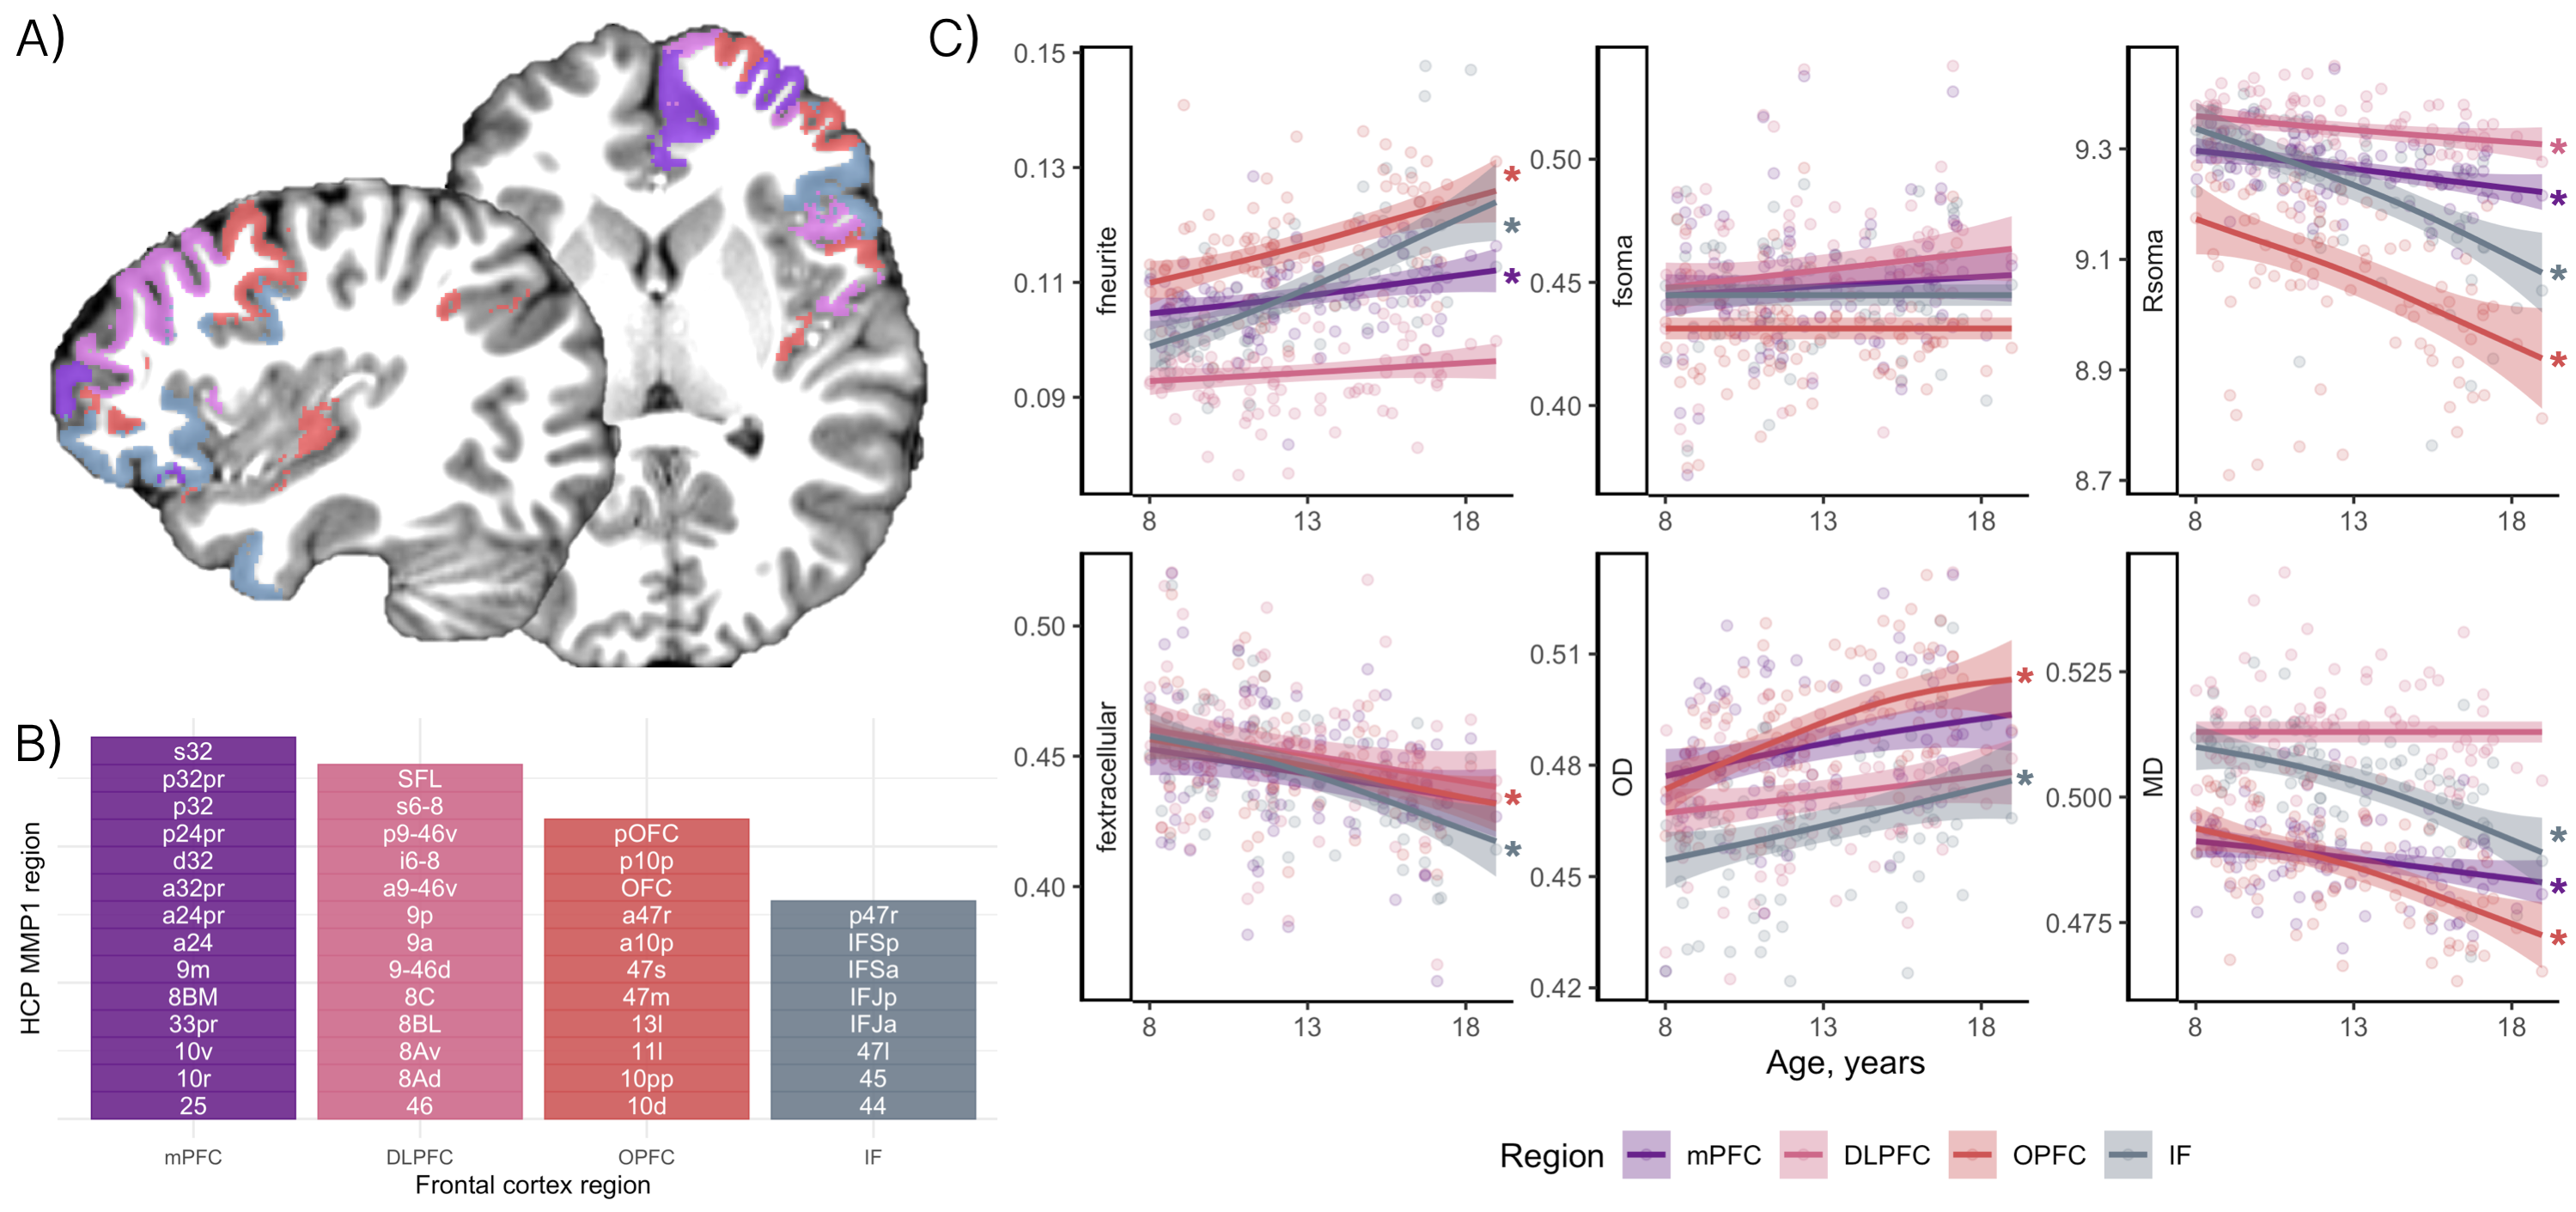
Participants aged 8-18 years (N=88, mean age=12.6 years, 46 female) underwent MRI on a 3T Siemens Connectom system with ultra-strong (300 mT/m) gradients. Structural T1-weighted (voxel-size=1x1x1mm; TE/TR=2/2300 ms) and multi-shell dMRI (TE/TR=59/3000 ms; voxel-size=2x2x2 mm; b-values=0 (14 vols), 500,1200(30 dirs), 2400,4000,6000(60 dirs) s/mm2) data were acquired. Pubertal stage was determined using the Pubertal Development Scale (PDS;[10]).Pre-processing of dMRI data followed steps reported previously[11]. T1 and dMRI data were processed to obtain cortical network[12,13] labels (Fig 1) and morphometric properties. Segmentations were further parcellated using the HCP-MMP1 atlas[14] for regional analyses in visual and frontal cortices based on apriori hypotheses[5,15].
For each subject, the soma and neurite density imaging (SANDI) compartment model was fitted[7] to all b-values to compute total intraneurite (fneurite), intrasoma (fsoma), and extracellular (fextracellular) signal fractions, and apparent soma radius (Rsoma). The neurite orientation dispersion and density imaging (NODDI) model[16] was fitted to all b-values to estimate the intra-cellular signal fraction (vic) and orientation dispersion (OD). Mean diffusivity was estimated using b=0,6000 s/mm2 to improve sensitisation to cortical microarchitecture[17].
Linear regression was performed to study main effects of age and sex, and sex by puberty interactions. Regional analyses for feature importance were performed using a random forest regressor (5-fold cross-validation) for age prediction.
Results
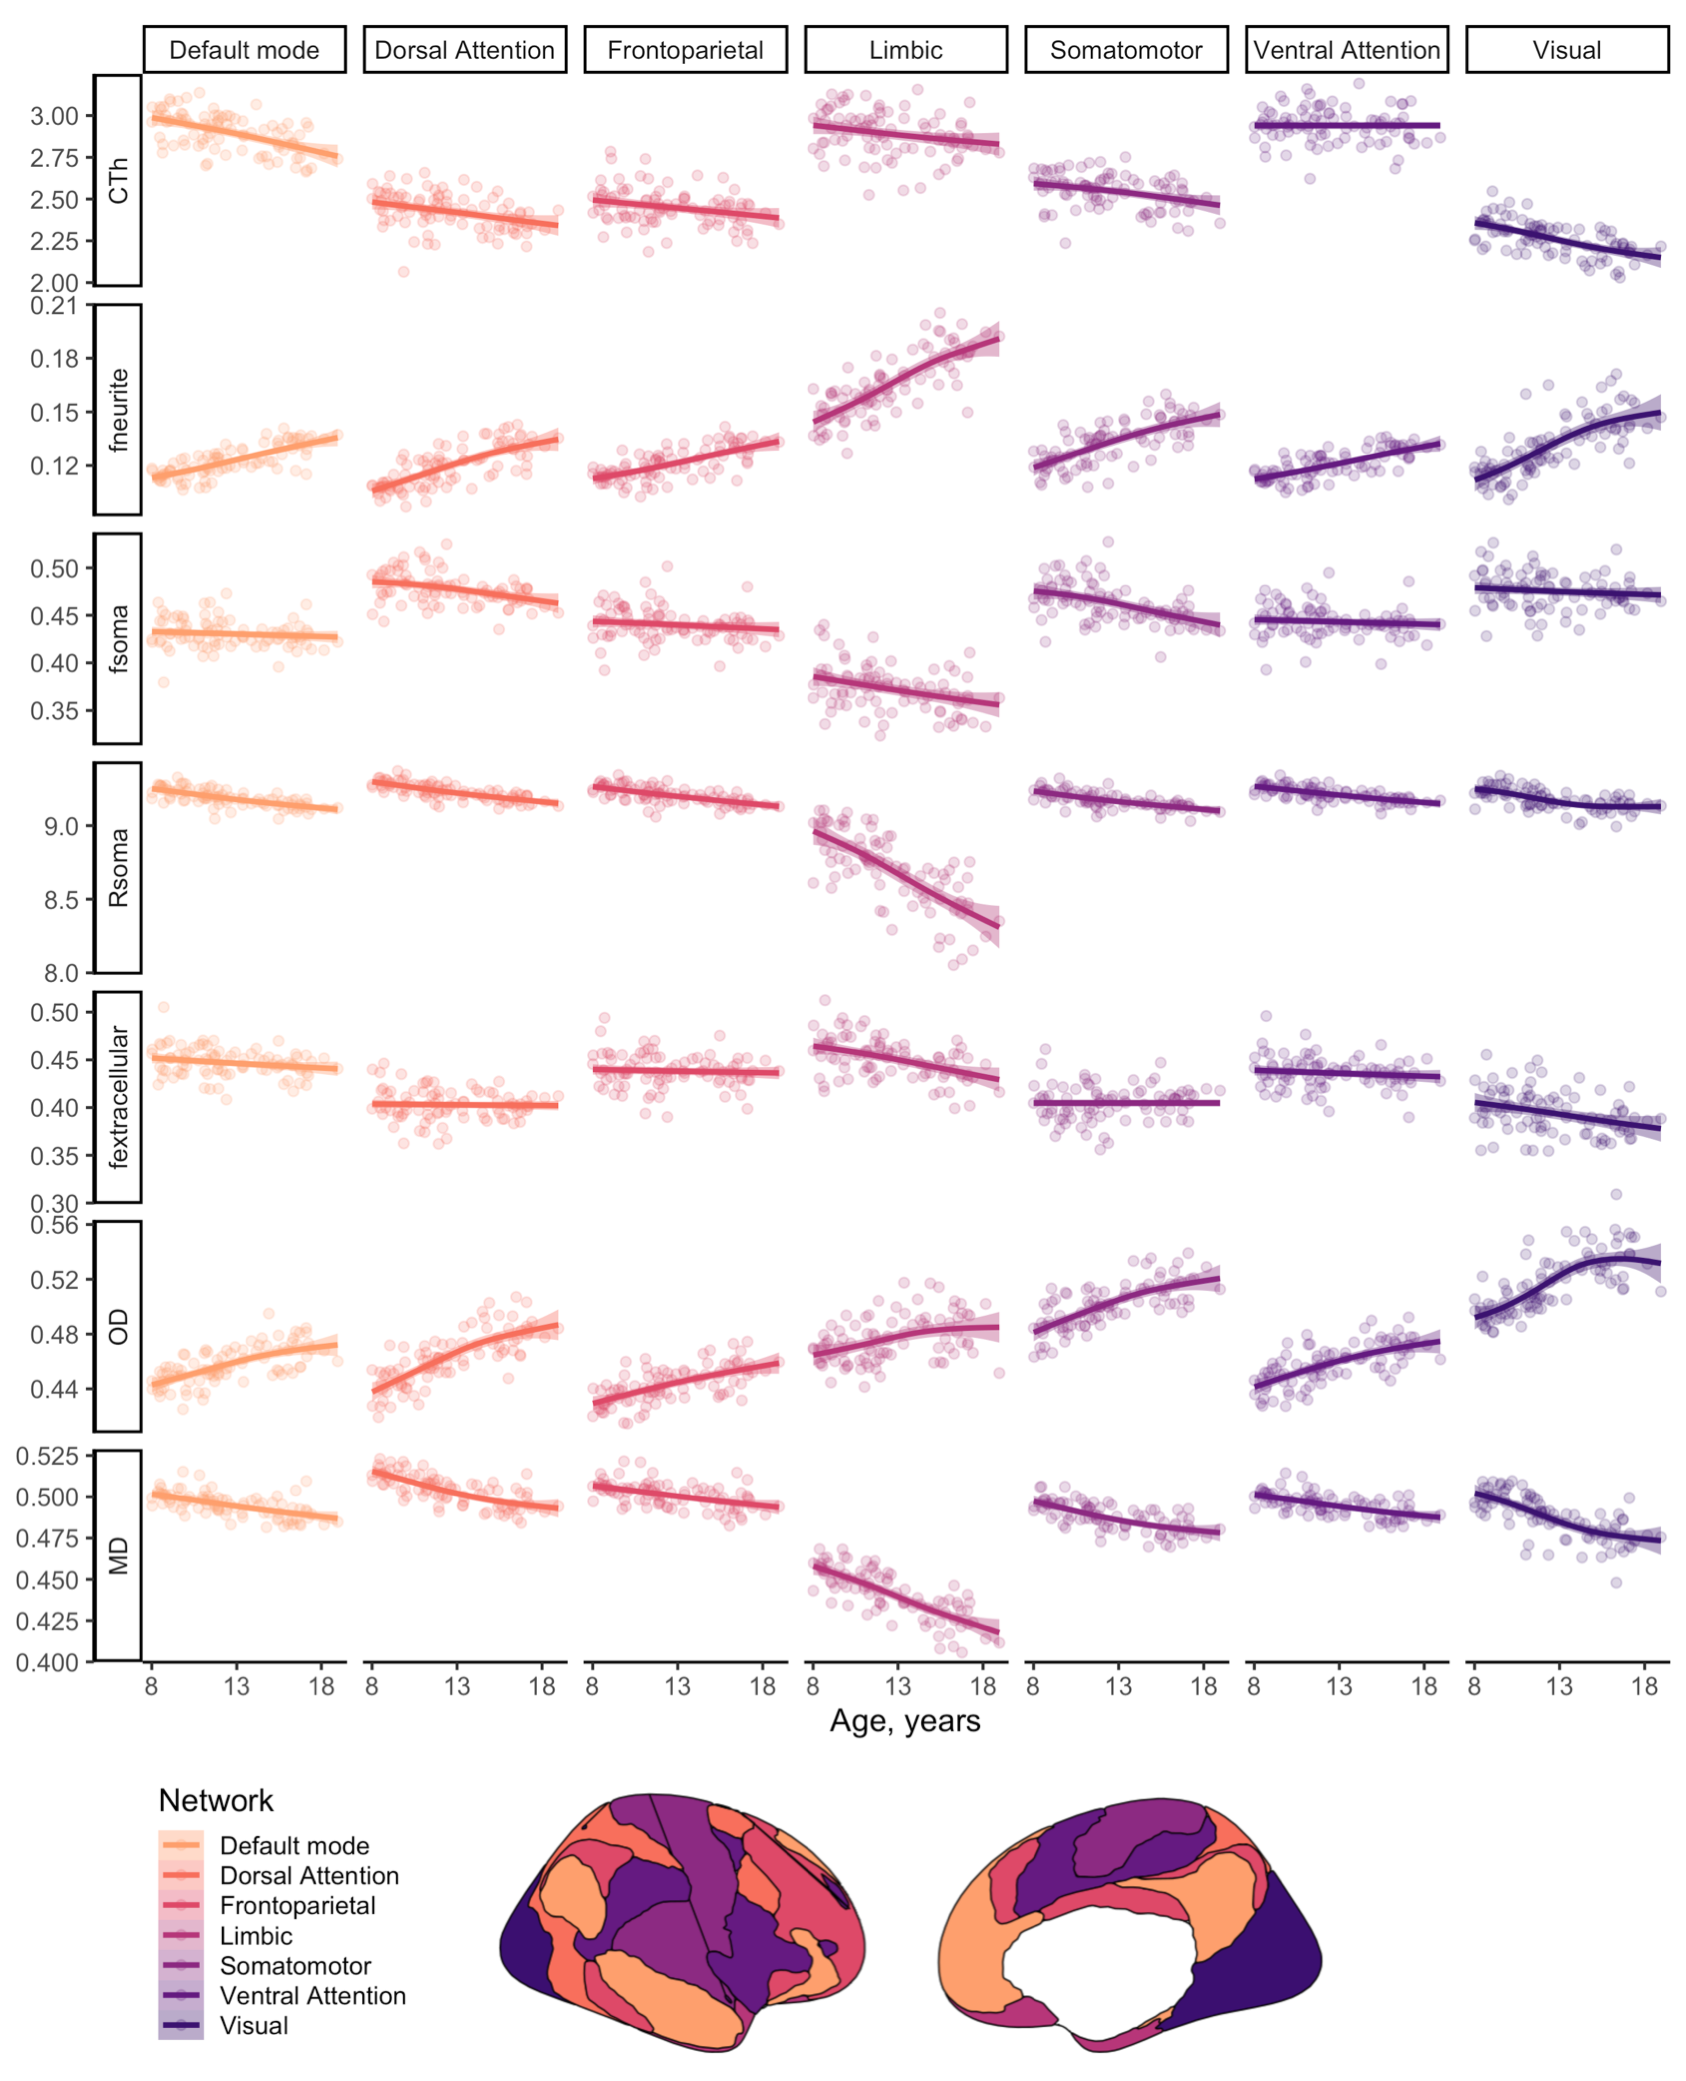
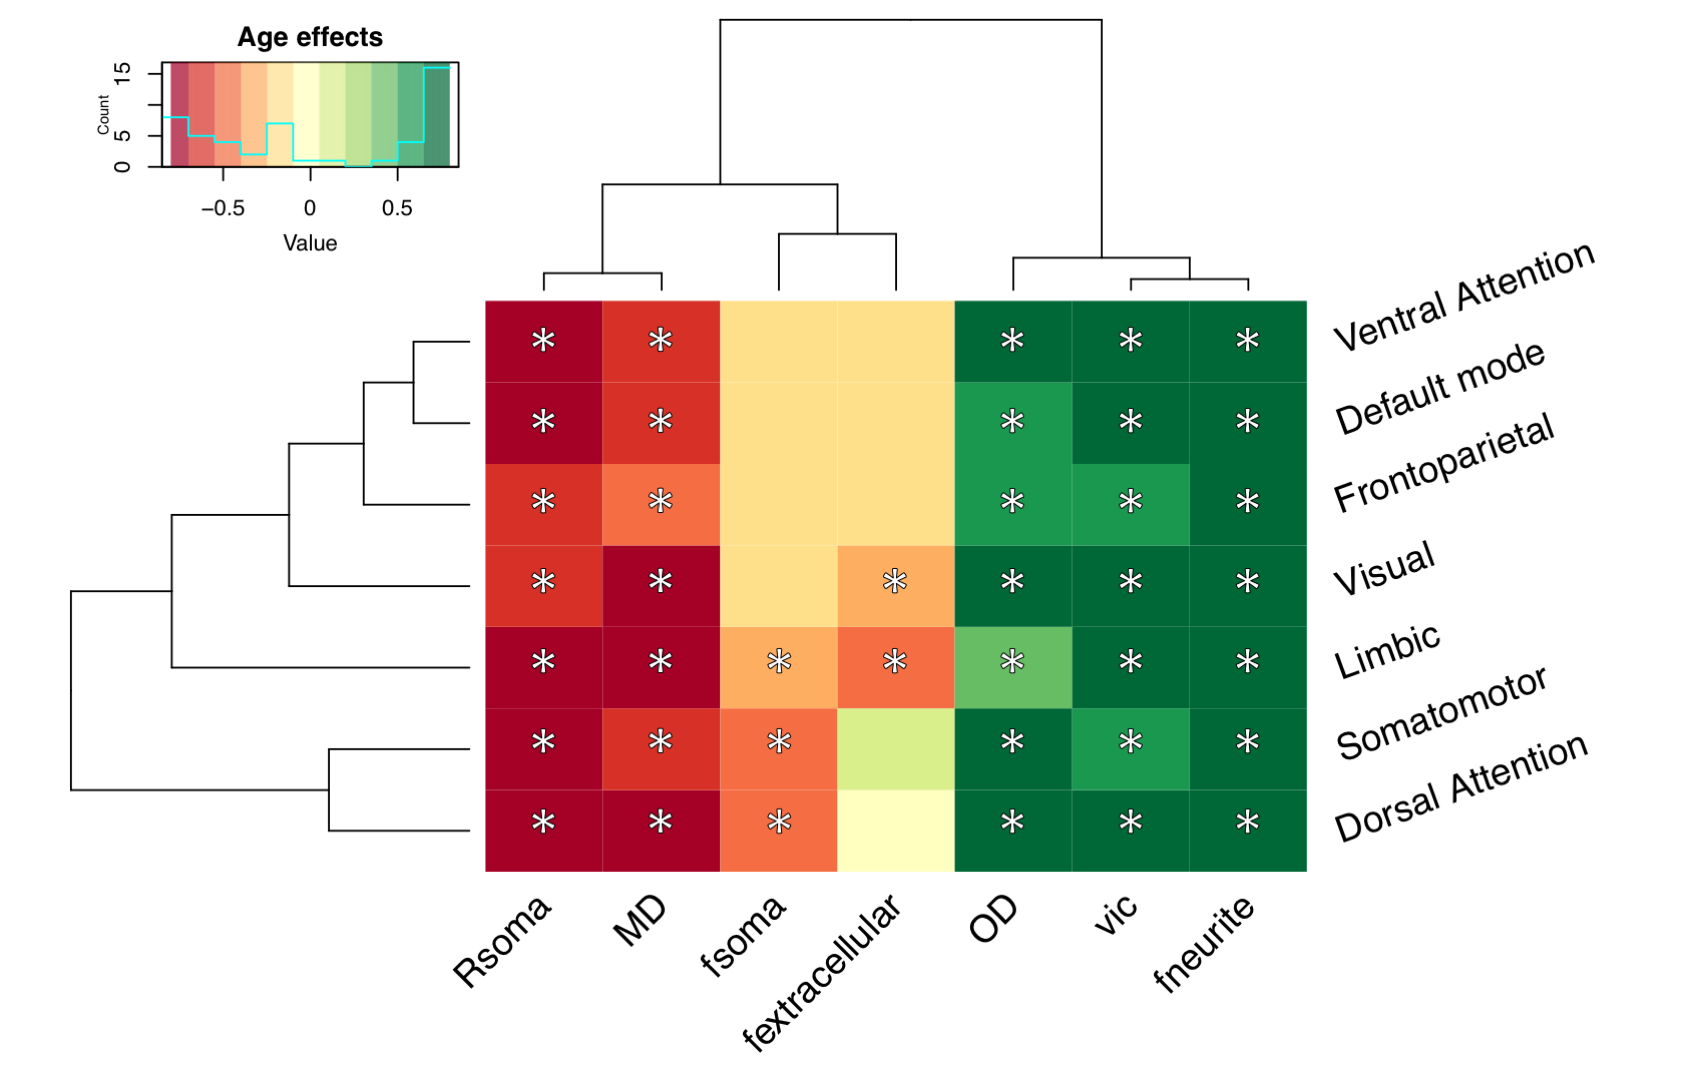
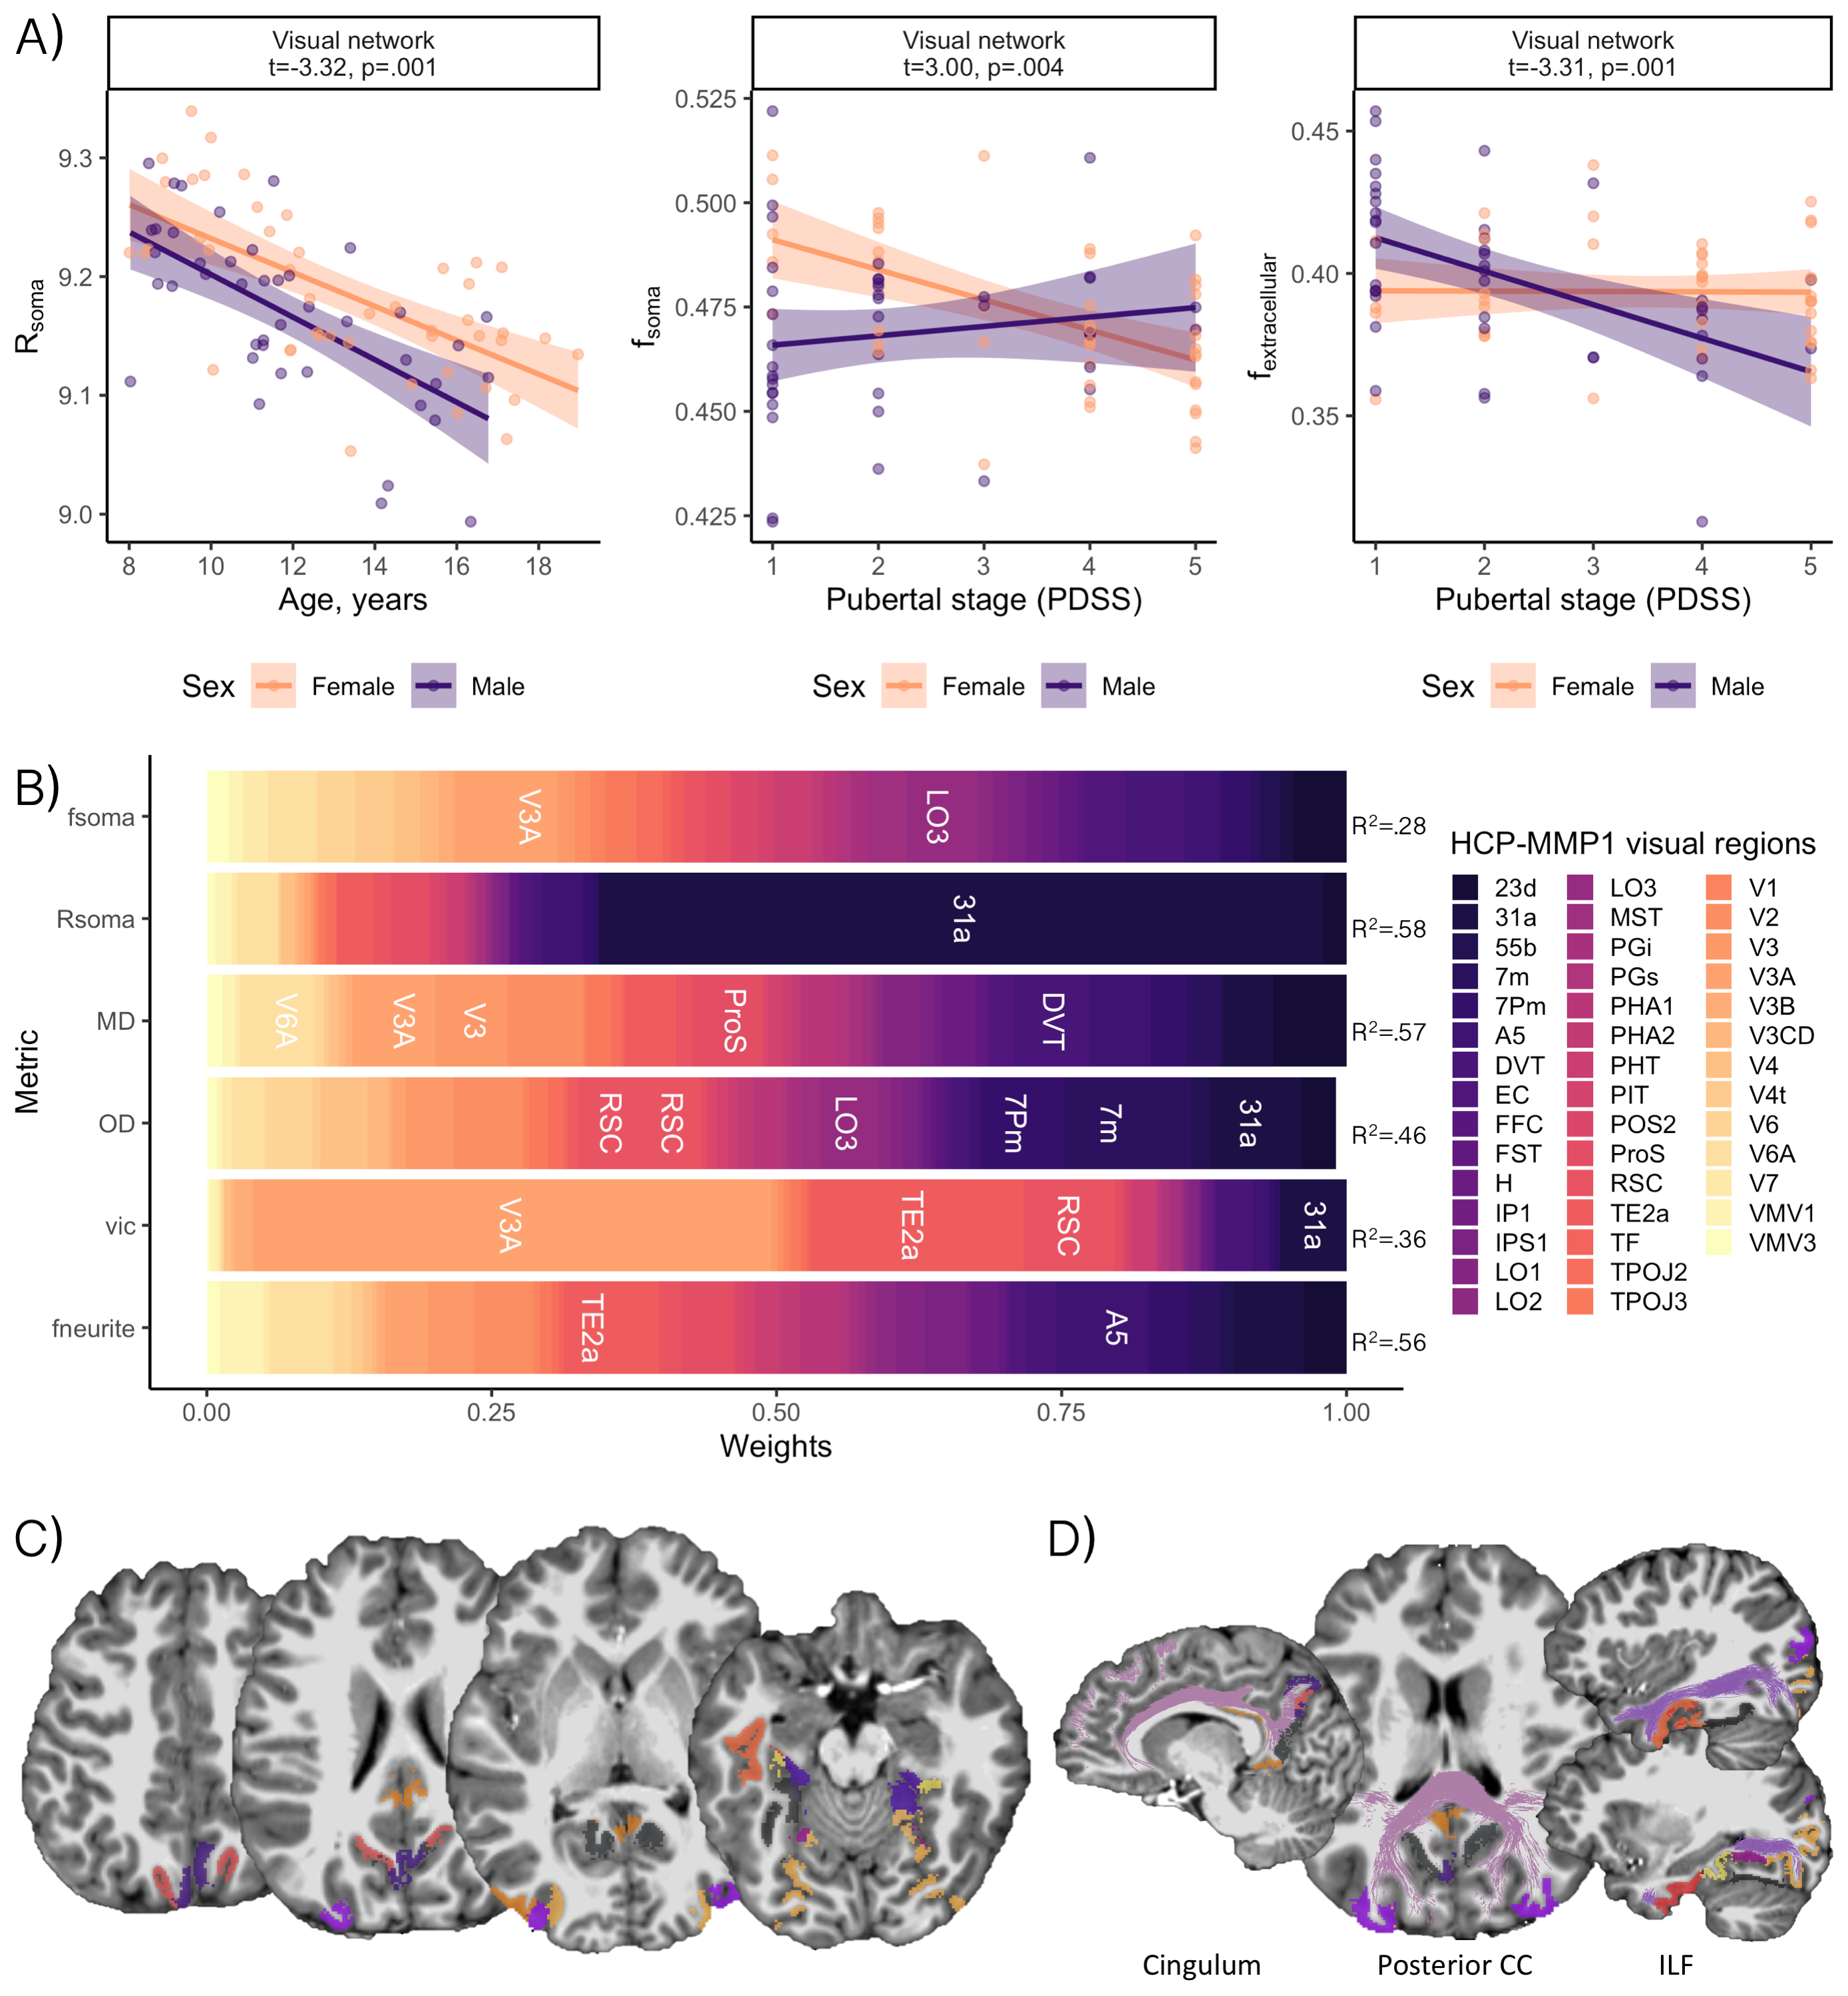
Distinct patterns of age-related development (Fig 2) were observed in two clusters (Fig 3). The first revealed a positive relationship between age and neurite microstructure, for fneurite (mean R2=.53), vic (mean R2=.46) and OD (mean R2=.42). The second revealed a negative relationship between extra-neurite architecture and age, for Rsoma (mean R2=.48) and MD (mean R2=.43). With increasing age, we observed lower fsoma for the somatomotor, dorsal attention and limbic networks (mean R2=.19), and lower fextracellular for the visual and limbic networks (mean R2=.16).Significant sex differences and interactions with puberty (Fig 4a) were only apparent in the visual network. Females had greater Rsoma than males (p=.001), whereas males had lower fsoma in early puberty (p=.004) and lower fextracellular in late puberty (p=.001). Feature importance of visual regions to brain age estimation implicated cortical endpoints of developmentally sensitive tracts, such as the posterior corpus callosum, cingulum, and inferior longitudinal fasciculus (Fig 4b,c).
In the frontal cortex (Fig 5), age-related microstructural patterns were similar to the limbic network, with no apparent main effect of sex, or sex by puberty interactions.
Discussion
We present a novel application of cortical microstructural development using dMRI. Firstly, we observed positive age-related patterns of fneurite and OD. In vivo white matter studies using NODDI have revealed that neurite density, but not orientation dispersion, increases with age[18, 19]. Our observations in the grey matter suggest that cellular projections (e.g., axons, spines, dendrites) increase in density and orientation dispersion with age, in agreement with ex vivo evidence of developmental branching and lengthening of cortical astrocytic processes[15].Our analysis also suggests smaller soma in older adolescents (.02 µm/year), with some networks exhibiting lower fsoma with age. Ex vivo evidence indicates no developmental differences in astrocytic and microglial density in the pre-frontal cortex[15], however, selective neuronal cell death with unchanged glial cell number can occur during puberty in the medial pre-frontal cortex[20,21]. Pubertal hormones can stimulate apoptosis (seen in female rat visual cortex[22]), which may explain our observations of lower fsoma in the visual cortex as puberty progresses in females.
Finally, lower MD across all subnetworks and lower fextracellular with advancing age in the default mode, limbic and visual networks may indicate myelin encroachment towards the cortical grey matter[5,17]. Future work should specifically quantify myelin content to comprehensively assess microstructural contributions to cortical morphology.
Microstructural associations with sex and pubertal stage were only observed in the visual network. Using a fine-grained multi-modal parcellation[14] we observed that developmental patterns were localised to endpoints of white matter fibre pathways such as the posterior corpus callosum, cingulum, and inferior longitudinal fasciculus. These pathways mature rapidly in the earlier stages of puberty[23], suggesting a temporal relationship between the development of white matter tissue properties and their cortical endpoints.
In summary, we provide novel in vivo evidence of distinct developmental patterns of neurite and soma architecture. Future work incorporating histopathological validation and gene expression profiles in human developmental samples is required to confirm age-related changes in neurite and soma cortical microarchitecture.
Acknowledgements
The authors would like to thank John Evans and Umesh Rudrapatna for study support.References
1. Mills, K.L., et al., Structural brain development between childhood and adulthood: Convergence across four longitudinal samples. Neuroimage, 2016. 141: p. 273-281.
2. Gogtay, N., et al., Dynamic mapping of human cortical development during childhood through early adulthood. Proc Natl Acad Sci U S A, 2004. 101(21): p. 8174-9.
3. Giedd, J.N., et al., Brain development during childhood and adolescence: a longitudinal MRI study. Nat Neurosci, 1999. 2(10): p. 861-3.
4. Huttenlocher, P.R., Synaptic density in human frontal cortex - developmental changes and effects of aging. Brain Res, 1979. 163(2): p. 195-205.
5. Natu, V.S., et al., Apparent thinning of human visual cortex during childhood is associated with myelination. Proceedings of the National Academy of Sciences, 2019. 116(41): p. 20750.
6. Jones, D.K., et al., Microstructural imaging of the human brain with a 'super-scanner': 10 key advantages of ultra-strong gradients for diffusion MRI. Neuroimage, 2018. 182: p. 8-38.
7. Palombo, M., et al., SANDI: A compartment-based model for non-invasive apparent soma and neurite imaging by diffusion MRI. NeuroImage, 2020. 215: p. 116835.
8. Tax, C.M.W., et al., The dot-compartment revealed? Diffusion MRI with ultra-strong gradients and spherical tensor encoding in the living human brain. NeuroImage, 2020. 210: p. 116534.
9. Genc, S., et al., Repeatability of soma and neurite metrics in cortical and subcortical grey matter. bioRxiv, 2020: p. 2020.10.08.331595.
10. Petersen, A.C., et al., A self-report measure of pubertal status: Reliability, validity, and initial norms. J Youth Adolesc, 1988. 17(2): p. 117-33.
11. Genc, S., et al., Impact of b-value on estimates of apparent fibre density. Human Brain Mapping, 2020. 41(10): p. 2583-2595.
12. Yeo, B.T., et al., The organization of the human cerebral cortex estimated by intrinsic functional connectivity. J Neurophysiol, 2011. 106(3): p. 1125-65.
13. Destrieux, C., et al., Automatic parcellation of human cortical gyri and sulci using standard anatomical nomenclature. NeuroImage, 2010. 53(1): p. 1-15.
14. Glasser, M.F., et al., A multi-modal parcellation of human cerebral cortex. Nature, 2016. 536(7615): p. 171-178.
15. Robillard, K.N., et al., Glial cell morphological and density changes through the lifespan of rhesus macaques. Brain, behavior, and immunity, 2016. 55: p. 60-69.
16. Zhang, H., et al., NODDI: practical in vivo neurite orientation dispersion and density imaging of the human brain. Neuroimage, 2012. 61(4): p. 1000-16.
17. Mournet, S., et al., Higher b-values improve the correlation between diffusion MRI and the cortical microarchitecture. Neuroradiology, 2020. 62(11): p. 1411-1419.
18. Lynch, K.M., et al., Magnitude and timing of major white matter tract maturation from infancy through adolescence with NODDI. NeuroImage, 2020. 212: p. 116672.
19. Mah, A., B. Geeraert, and C. Lebel, Detailing neuroanatomical development in late childhood and early adolescence using NODDI. PLoS One, 2017. 12(8): p. e0182340.
20. Willing, J. and J.M. Juraska, The timing of neuronal loss across adolescence in the medial prefrontal cortex of male and female rats. Neuroscience, 2015. 301: p. 268-275.
21. Markham, J.A., J.R. Morris, and J.M. Juraska, Neuron number decreases in the rat ventral, but not dorsal, medial prefrontal cortex between adolescence and adulthood. Neuroscience, 2007. 144(3): p. 961-968.
22. Nunez, J.L., J. Sodhi, and J.M. Juraska, Ovarian hormones after postnatal day 20 reduce neuron number in the rat primary visual cortex. J Neurobiol, 2002. 52(4): p. 312-21.
23. Genc, S., et al., Longitudinal patterns of white matter fibre density and morphology in children are associated with age and pubertal stage. Developmental Cognitive Neuroscience, 2020. 45: p. 100853.
24. Fischl, B., et al., Automatically Parcellating the Human Cerebral Cortex. Cerebral Cortex, 2004. 14(1): p. 11-22.
Figures