2248
Quantitative susceptibility mapping of the brain in neonates and infants1Kyoto University Graduate School of Medicine, Kyoto, Japan
Synopsis
We evaluated magnetic susceptibility of the brain in 202 neonates and infants. We manually placed volumes of interest of the caudate nucleus, globus pallidus, putamen and ventral posterior lateral nucleus of the thalamus in the MNI space. Our study showed that elevation of magnetic susceptibility probably associated with iron deposition of the basal ganglia and thalamus increased with chronological age from birth to 2 years using volume-of-interest analysis.
Introduction
Dynamic brain development is observed from birth until the age of 2 years, when myelination is almost complete. Iron is necessary for development of myelination, and iron deposition in the brain parenchyma changes the appearance of brain MRI during this period.Quantitative susceptibility mapping (QSM) reveals the spatial distribution of magnetic susceptibility within biological tissues. QSM is expected to be a useful imaging technique for a marker of brain development in neonates and infants. We assessed magnetic susceptibility in deep gray matters of neonates and infants using QSM.
Methods
- Subjects This retrospective study was performed in 202 neonates and infants (chronological age [CA], 3-742 days) including both preterm infants and term infants. Preterm infants underwent MR imaging at term equivalent age. Term infants underwent MR imaging when intracranial abnormalities were suspected.
- Image Acquisition Subjects underwent MR imaging at 3T MR scanners (MAGNETOM Prisma or Skyra, Siemens Healthineers, Erlangen, Germany) with a 64-head/neck coil or 32-channel head coil. The imaging protocols of 3D GRE were as follows: TR/TEs 55/10, 20, 30, 40 msec; matrix, 256 × 256; field of view, 240 × 240 mm; flip angle, 15°; slice thickness, 2.0 mm; 48 slices; bandwidth, 240 Hz/Px; acquisition time, 4 min 34 sec. 3D T1-weighted imaging (T1WI) and 2D T2-weighted imaging (T2WI) were also obtained.
- Post-imaging Procedure QSM was created from magnitude and phase images of 3D GRE using STI Suite version 3 (https://people.eecs.berkeley.edu/~chunlei.liu/software.html). Laplacian-based phase unwrapping, variable-kernel sophisticated harmonic artifact reduction for phase data (V-SHARP), and improved sparse linear equation and least‐squares (iLSQR) algorithm were used. T1WI and T2WI were registered to the corresponding to magnitude images of 3D GRE. T2WI was coregistered and segmented to create DARTEL template using SPM12 (https://www.fil.ion.ucl.ac.uk/spm/software/spm12/). This template was used for normalizing QSM to the MNI space and creating average QSM. We manually placed volumes of interest (VOIs) of the caudate nucleus (CN), globus pallidus (GP), putamen (PT) and ventral posterior lateral nucleus (VPL) of the thalamus on averaged T2WI using ITK-SNAP (www.itksnap.org). The VPL is known to be low intensity on T2WI in neonates, therefore, we focused on the VPL. We measured magnetic susceptibility [ppb] of VOIs using REX of SPM toolbox.
- Data Analysis We divided subjects into 3 groups in accordance with ages: CA of 0-150, 151-499, and 500-750 days. The correlations between magnetic susceptibility of VOIs and CA were assessed using Spearman’s rank correlation coefficient (ρ). Linear regression analysis was also performed. All statistical data were analyzed using a software package (JMP Pro 14.0, SAS Institute Inc.).
Results
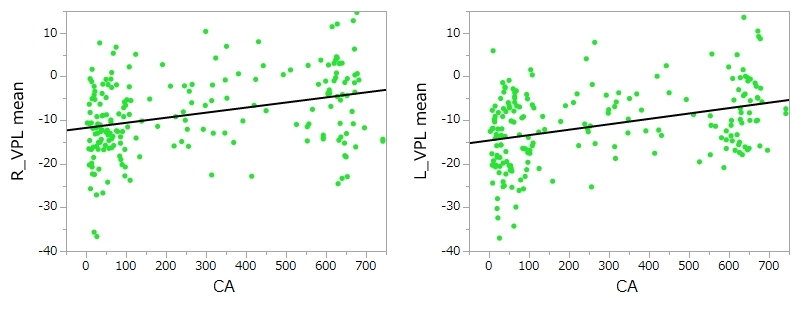
Figure 1 shows average images of QSM in each group. Magnetic susceptibility of the basal ganglia and thalamus increases with age.Susceptibility of the right and left CN correlated with CA (ρ=0.46 and ρ=0.49, respectively) (Figure 2). Susceptibility of the right and left GP correlated with CA (ρ=0.61 and ρ=0.70, respectively) (Figure 2). Susceptibility of the right and left PT correlated with CA (ρ=0.59 and ρ=0.63, respectively) (Figure 2). Susceptibility of the right and left VPL correlated mildly with CA (ρ=0.33 and ρ=0.36, respectively) (Figure 3). GP showed the highest correlation with age.
Linear regression equations between mean susceptibility [ppb] and CA [days] were as follows:
R_CN mean = -2.752331 + 0.0153439 × CA
L_CN mean = -2.871088 + 0.0154634 × CA
R_GP mean = -9.0919 + 0.0235986 × CA
L_GP mean = -9.337484 + 0.0294737 × CA
R_PT mean = -7.220134 + 0.0136584 × CA
L_PT mean = -7.243403 + 0.0139476 × CA
R_VPL mean = -11.75558 + 0.011628 × CA
L_VPL mean = -14.64612 + 0.0123755 × CA
The slope of the regression line of the GP was the highest.
Discussion and Conclusion
We evaluated magnetic susceptibility of a large number of pediatric patients. Our study showed that magnetic susceptibility of the basal ganglia and thalamus increased with CA using VOIs like previous studies in limited subjects (1,2,3). The iron deposition in human brain is known to accumulate rapidly in early age (0-20 years old) (4). The GP showed the highest correlation with age and the slope of the regression line of the GP was the highest. Our results obtained from 202 patients were in accordance with those described in previous study (2). Magnetic susceptibility somewhat varied among each age group. Several factors may be involved in this result because we included low birth weight neonates. This study focused on the short range of ages of the subjects, up to 2 years of age. To obtain better knowledge of developmental evaluation, further examinations including older children are required.Acknowledgements
No acknowledgement found.References
1. Yuyao Zhang, Jingjing Shi, Hongjiang Wei, et al. Neonate and infant brain development from birth to 2 years assessed using MRI-based quantitative susceptibility mapping. Neuroimage. 2019;15;185:349-360
2. Ning Ning, Congcong Liu, Peng Wu, et al. Spatiotemporal Variations of Magnetic Susceptibility in the Deep Gray Matter Nuclei From 1 Month to 6 Years: A Quantitative Susceptibility Mapping Study.J Magn Reson Imaging. 2019;49(6):1600-1609
3. Yuyao Zhang, Hongjiang Wei, Matthew J. Cronin, et al. Longitudinal Atlas for Normative Human Brain Development and Aging over the Lifespan using Quantitative Susceptibility Mapping. Neuroimage. 2018;1;171:176-189
4. B.Hallgren and P Sourander. The effect of age on the non-haemin iron in the human brain. J Neurochem. 1958;3(1):41-51
Figures
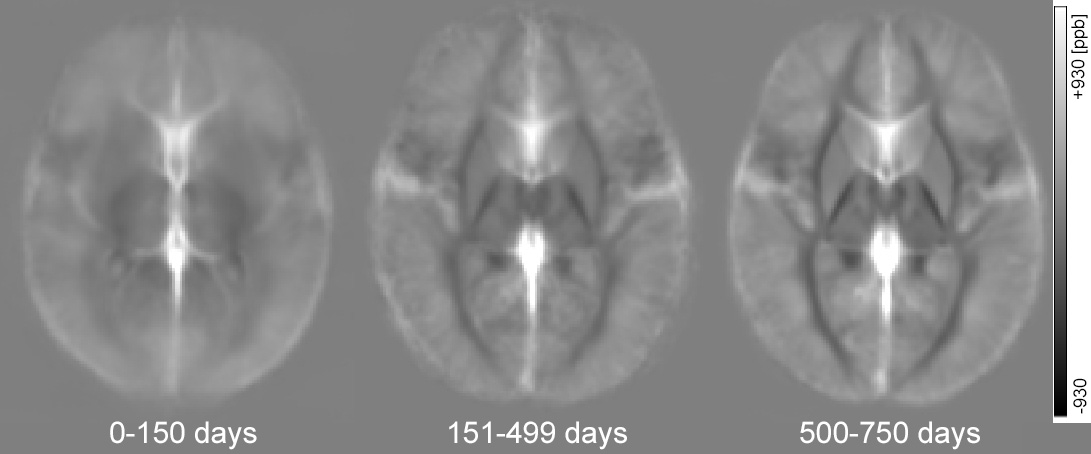
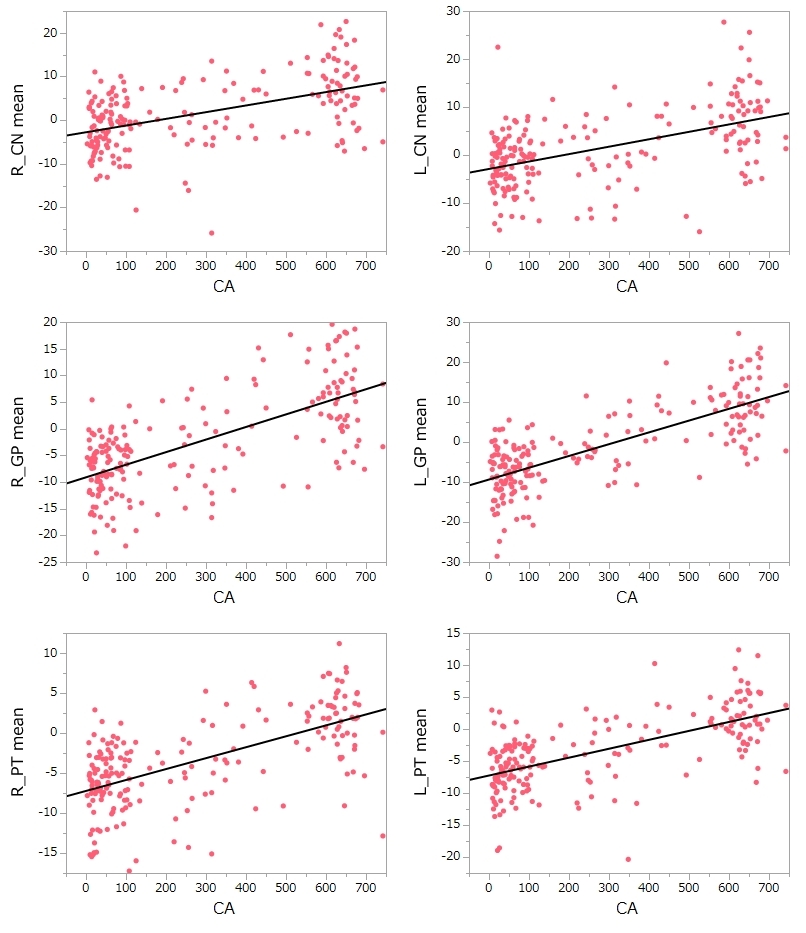
Figure 2. Scattered plots of magnetic susceptibility of the basal ganglia and chronological age. Magnetic susceptibility of the CN, GP and PT correlates with chronological age (CA).