2244
Brain asymmetry and development of healthy preterm infants within half-year-old: a diffusion MRI study based on ROI and fixel methods1ZheJiang University, Hangzhou, China, 2Children's Hospital, ZheJiang University School of Medicine, Hangzhou, China
Synopsis
The present study aimed to investigate brain asymmetry of healthy preterm-born infants within half-year-old using high angular resolution diffusion MRI. ROI-based analysis revealed most brain regions showed significant asymmetry and the asymmetry changed with brain development. The MD-based lateralization index showed an center-versus-peripheral pattern with remarkable lateralization in the posterior cortex. Moreover, in contrast to the adult brain, we found a rightward asymmetry in language processing regions and leftward asymmetry in visuospatial processing regions. Besides, consistent leftward lateralization in white matter was observed at both ROI-based and fixel-based analysis. These findings advanced our understanding of brain asymmetry during early development.
Introduction
The human brain demonstrates anatomical and functional asymmetries of left and right hemispheres with high variability of individual differences, which are associated with functional specialization1-3. Several studies investigated the white matter (WM) asymmetry at the early age of life (1-4 months) using DTI and reported different asymmetric patterns in different brain regions4-6. However, how such asymmetry changes with brain development during infancy remained unexplored; and also the traditional DTI metrics may not provide a comprehensive picture of asymmetry in complex WM structures. In this study, we aimed to study the brain asymmetry of healthy preterm-born infants using high angular resolution diffusion MRI (HARDI) for systemic investigation of spatiotemporal pattern of brain asymmetry from term-equivalent age (TEA) to half-year-old, using both ROI-based and fixel-based analysis (FBA).Methods
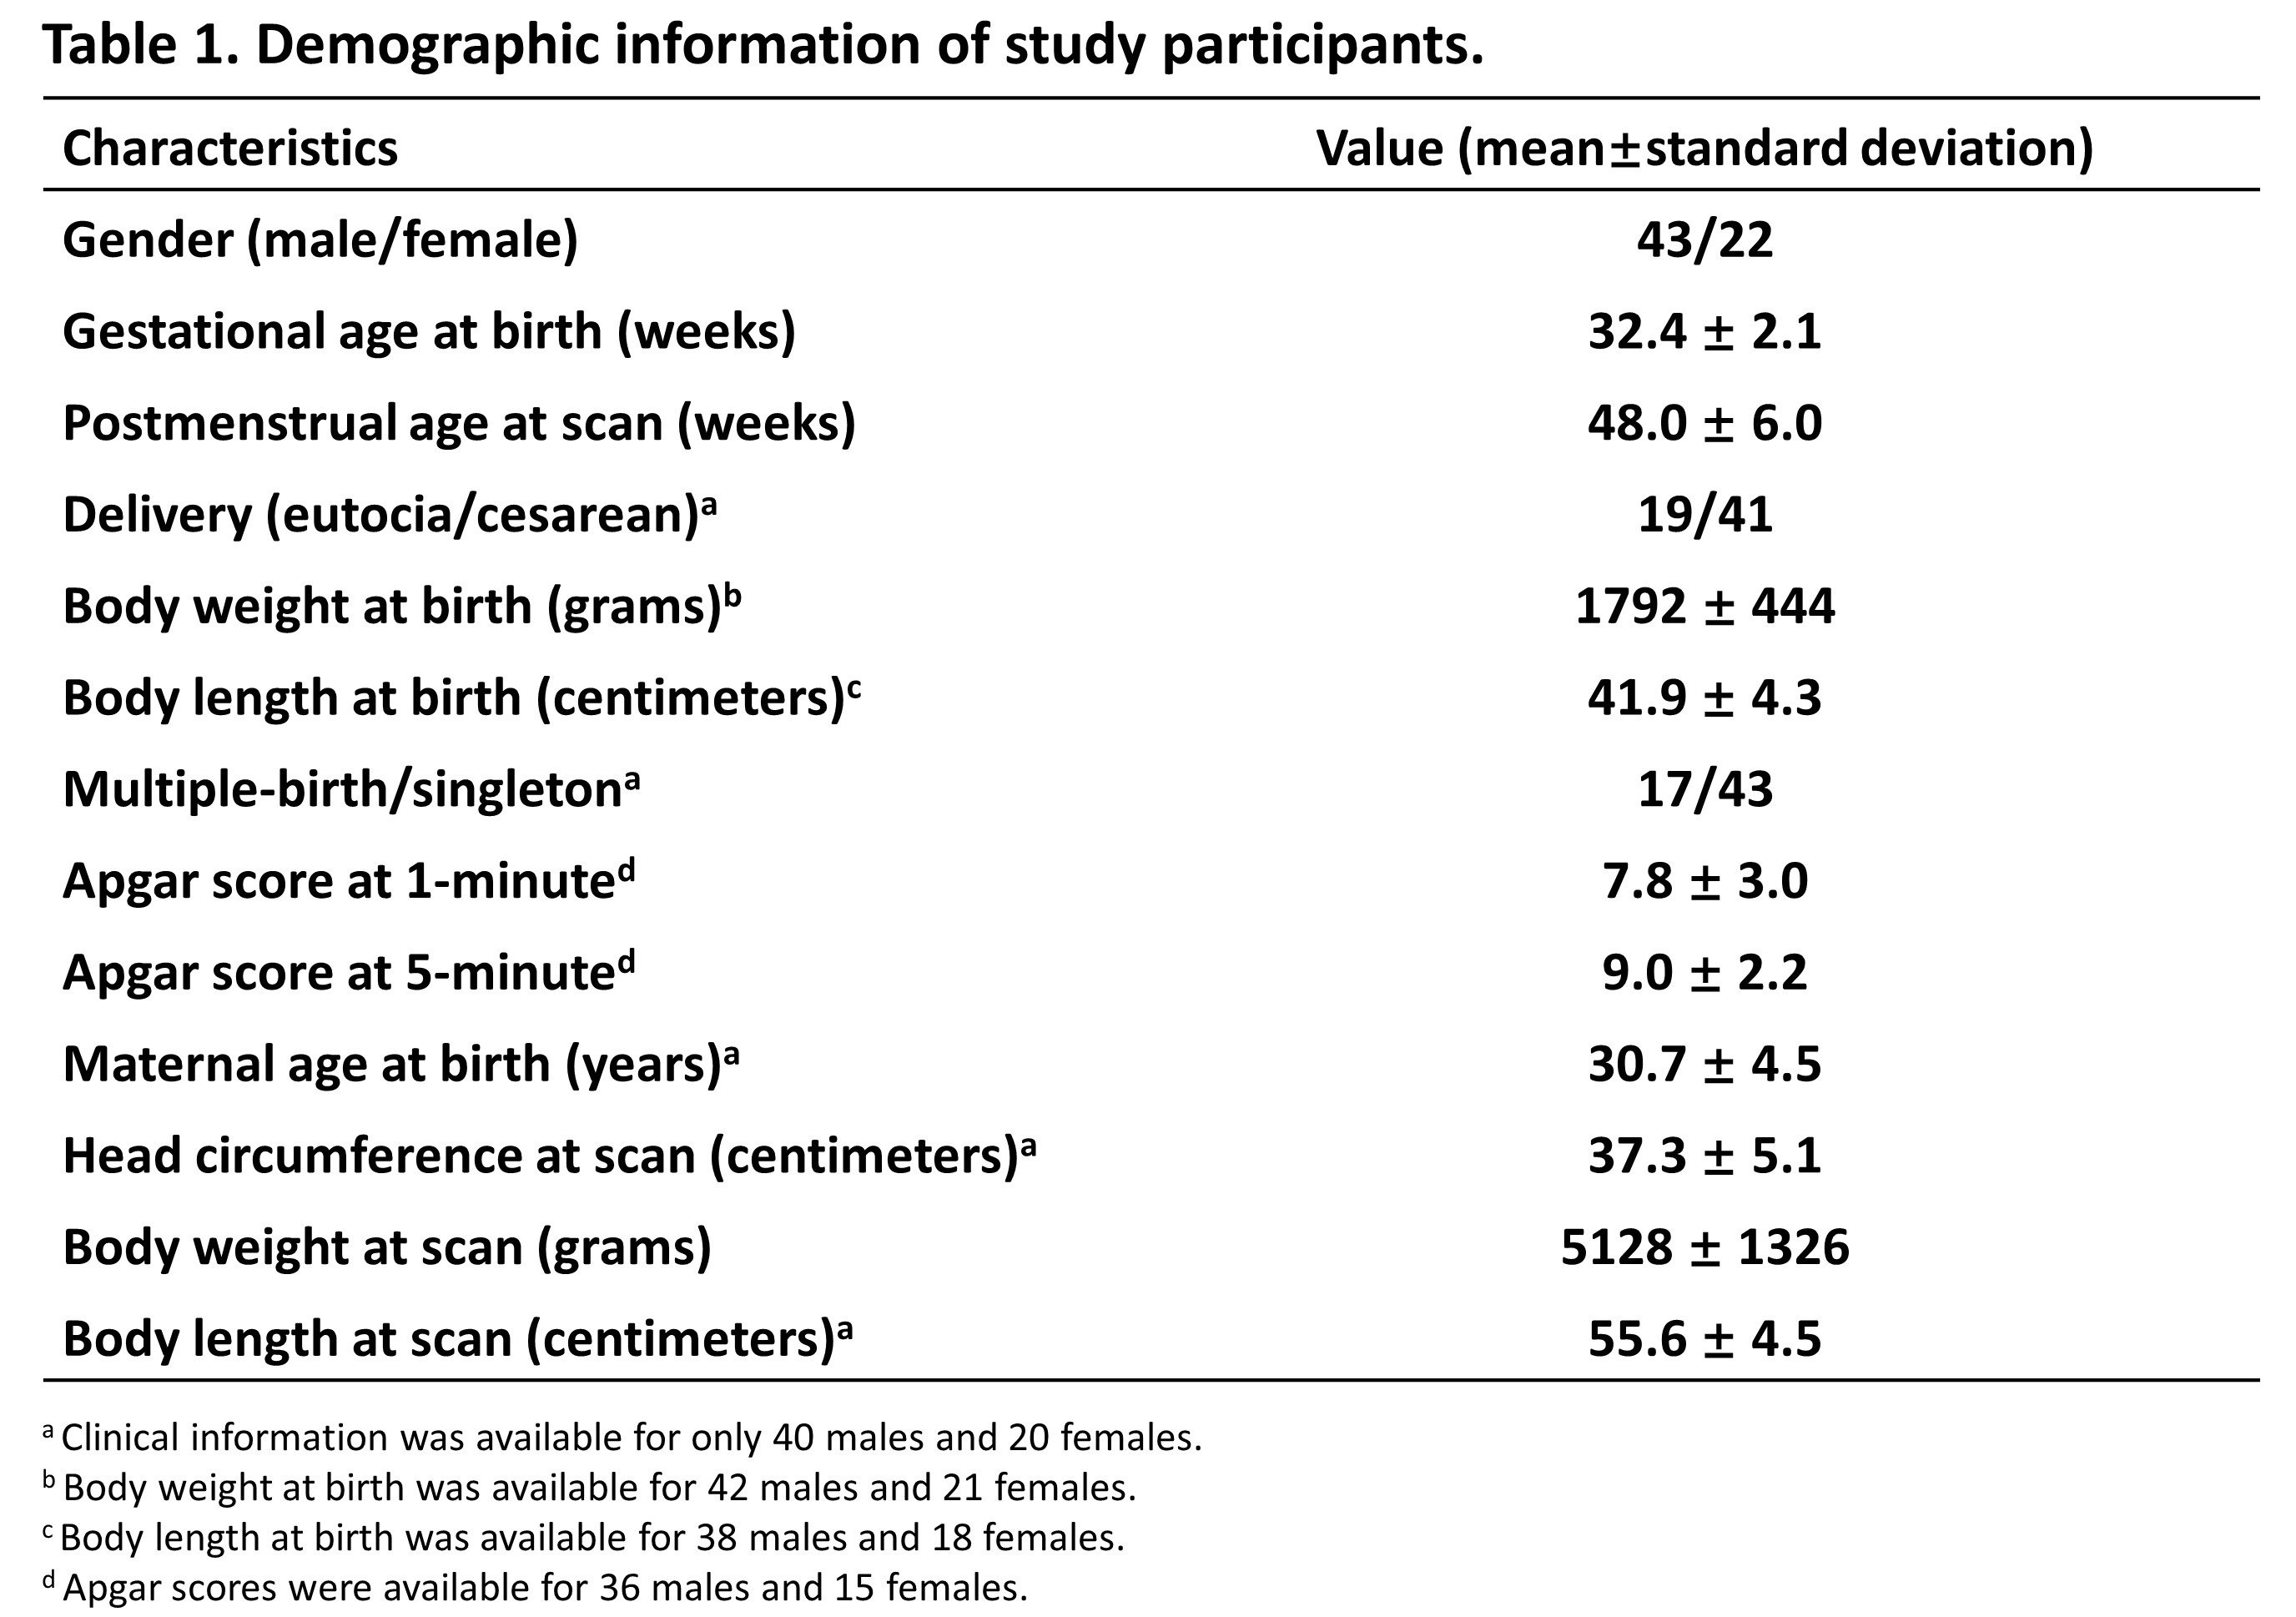
Data acquisition: Sixty-five healthy preterm-born infants (gestational age between 25.3-36.6 weeks) were included in this study under IRB approval and parental consent, with postmenstrual age (PMA) at scan ranging from TEA to 6-months (see clinical information in Table.1). Multi-shell HARDI data acquired on a Philips 3.0T Achieva system using a single-shot spin-echo EPI sequence with 32 noncolinear diffusion directions and two b-values of 800/1500 s/mm2, one pair of b0s with inverse phase-encoding directions, TR/TE=9652/115 ms, in-plane resolution=1.5×1.5 mm2, FOV=180×180 mm2, and 60 slices at a slice thickness of 2 mm.Data processing: All diffusion data underwent intra-subject registration7,8, distortion correction, and eddy current correction9,10. Segmentation of the DTI data was achieved by transforming individual subjects to the JHU-neonate single brain atlas11,12. FA and MD in 63 paired symmetrical ROIs were extracted.
In order to use FBA for asymmetry analysis, the preprocessed diffusion images were left-right flipped, then FBA was performed between the native and flipped data following the MRtrix3 MSMT-CSD pipeline13,14. Participants were categorized into three groups based on PMA: TEA to 1 month, 1-3 months, 3-6 months. For each group, a specific fiber orientation distribution (FOD) template was generated, and fiber density (FD), fiber cross-section (FC), and fiber density and cross-section (FDC) were calculated for each group. Connectivity-based fixel enhancement and non-parametric permutation tests were performed15 to identify the fixels with significant group differences. The max FD and mean FC of each voxel were extracted for ROI-based analysis.
Statistical analysis: Paired test was performed for ROI-based analysis. Laterality index (LI) was calculated for each paired ROI with the formula ((left–right)/(left+right)*100), and positive/negative LI represented leftward/rightward asymmetry. Then ANCOVA was performed for detecting the relationship between the LI and age, with gender, body weight at birth, and gestational age at birth as covariates. The P values of ROI-based analysis were adjusted using the FDR method. The significance level was set to 0.05 for all analyses.
Results
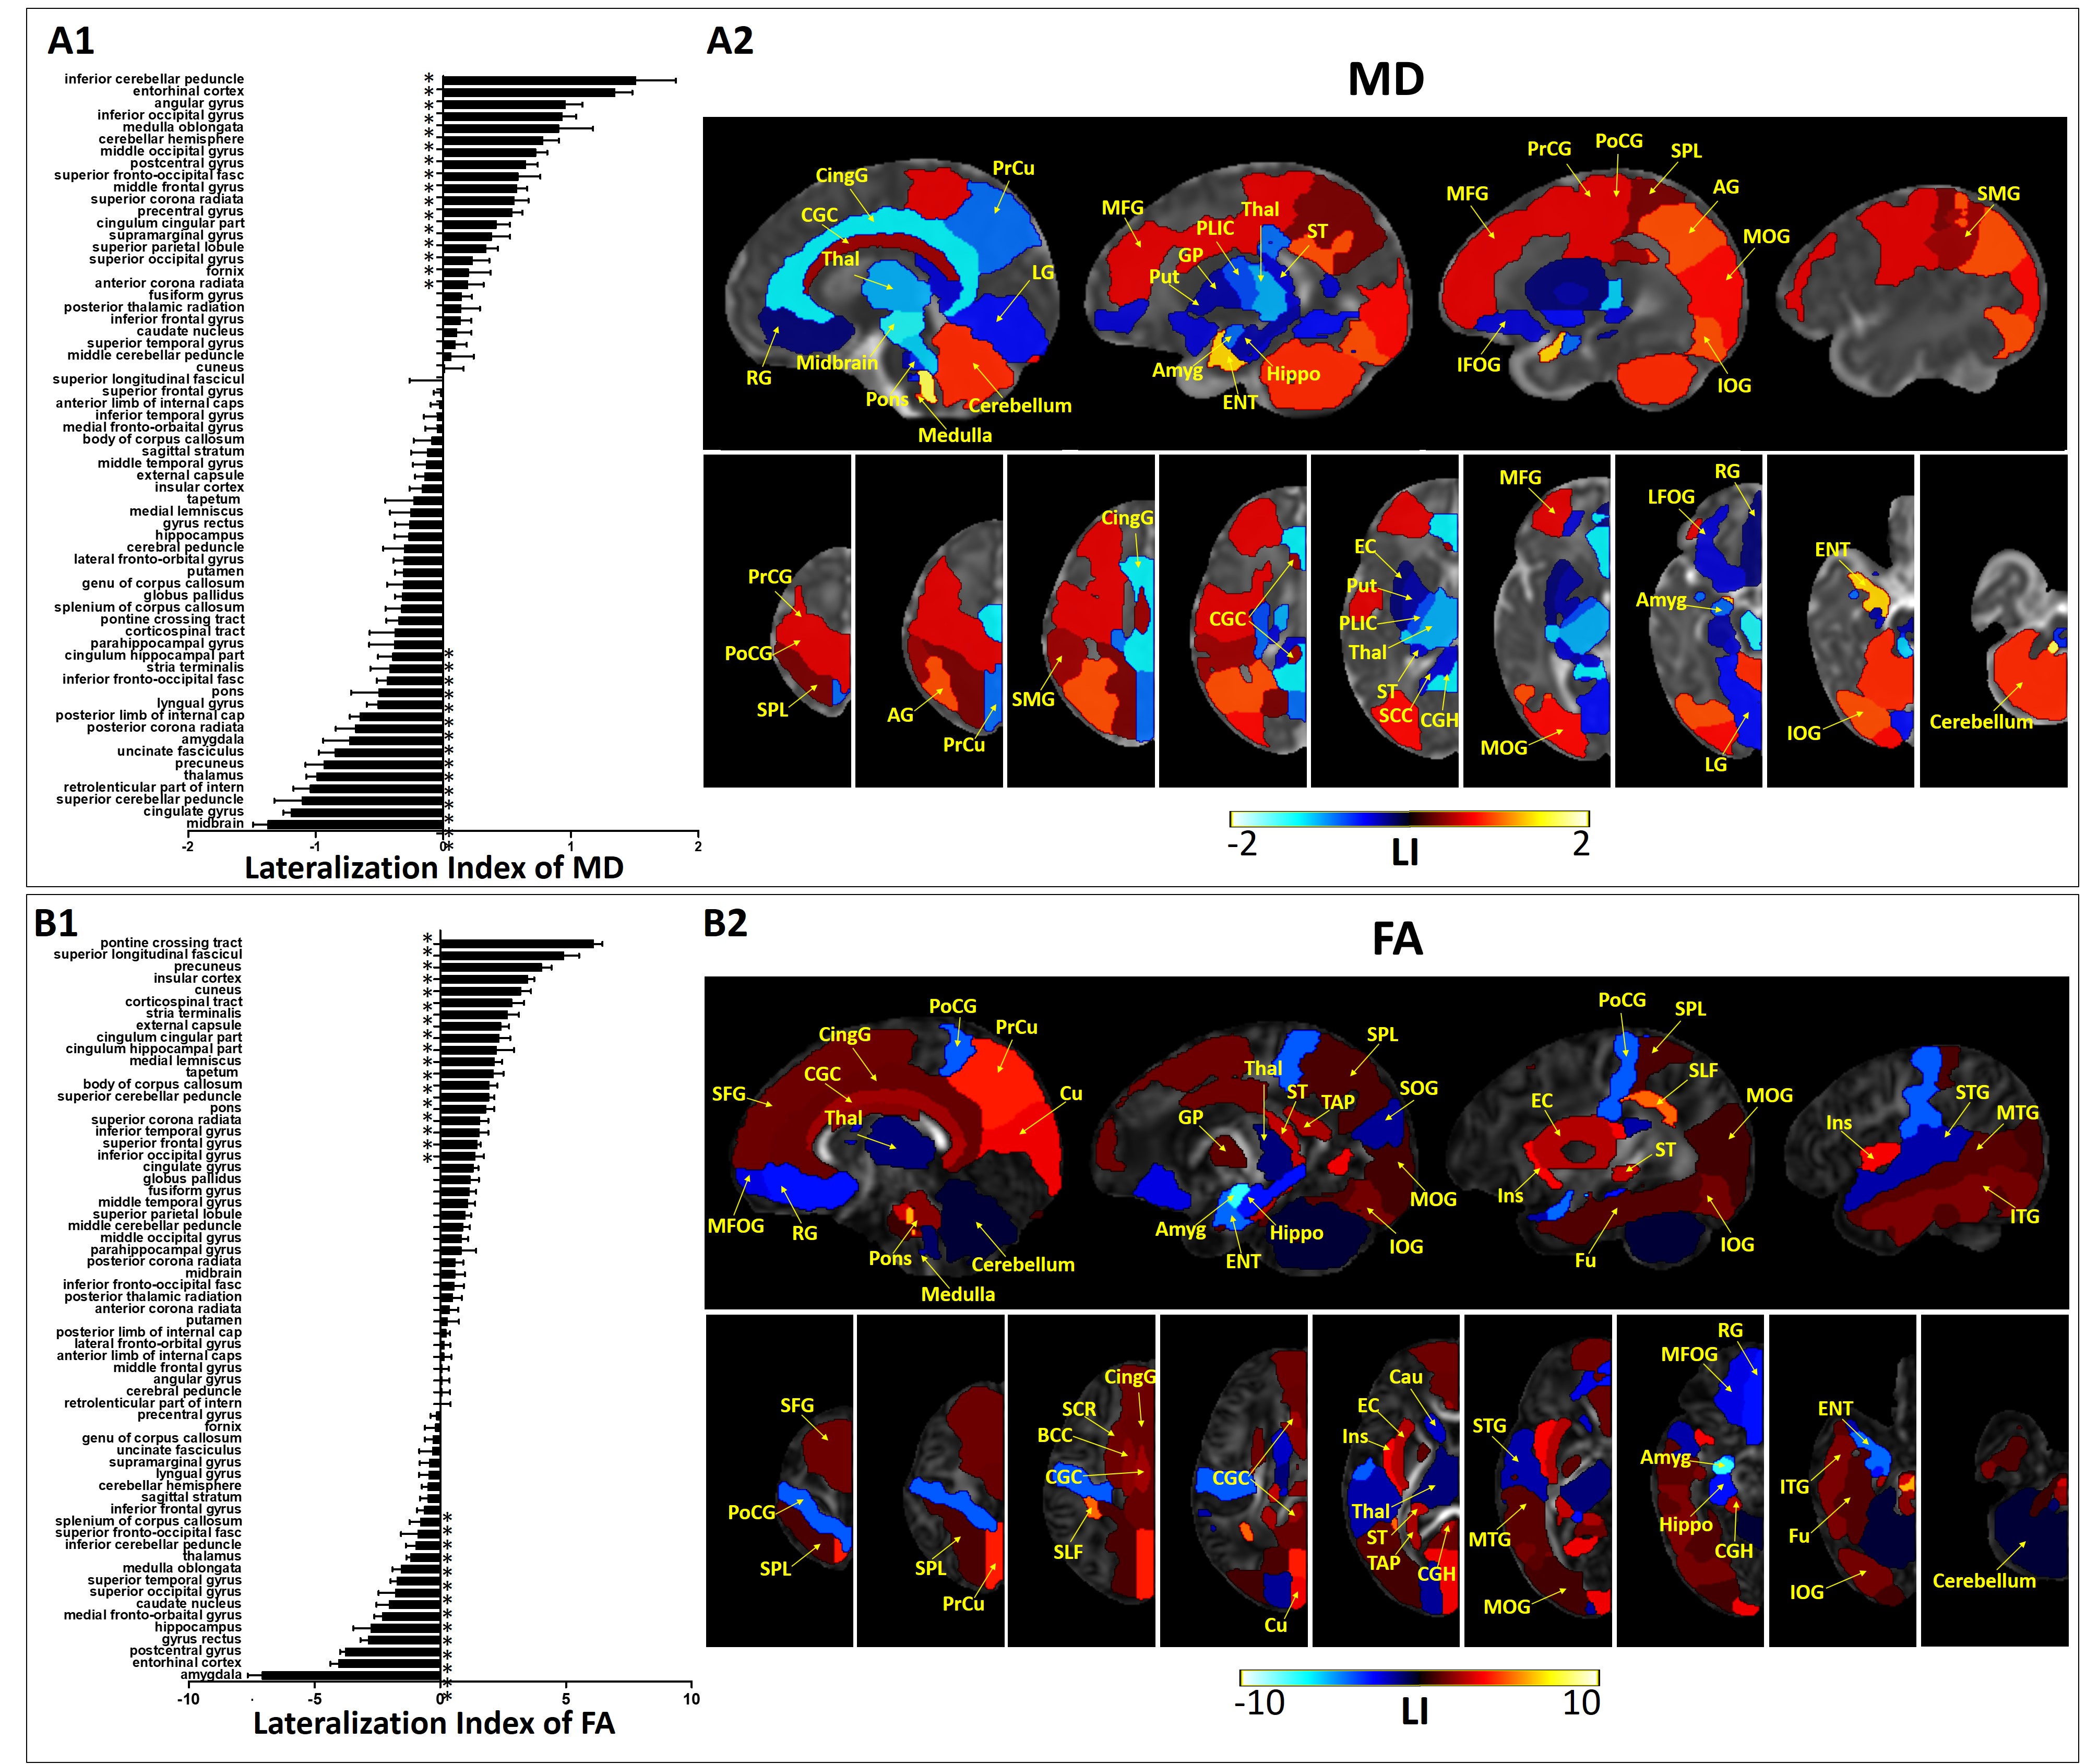
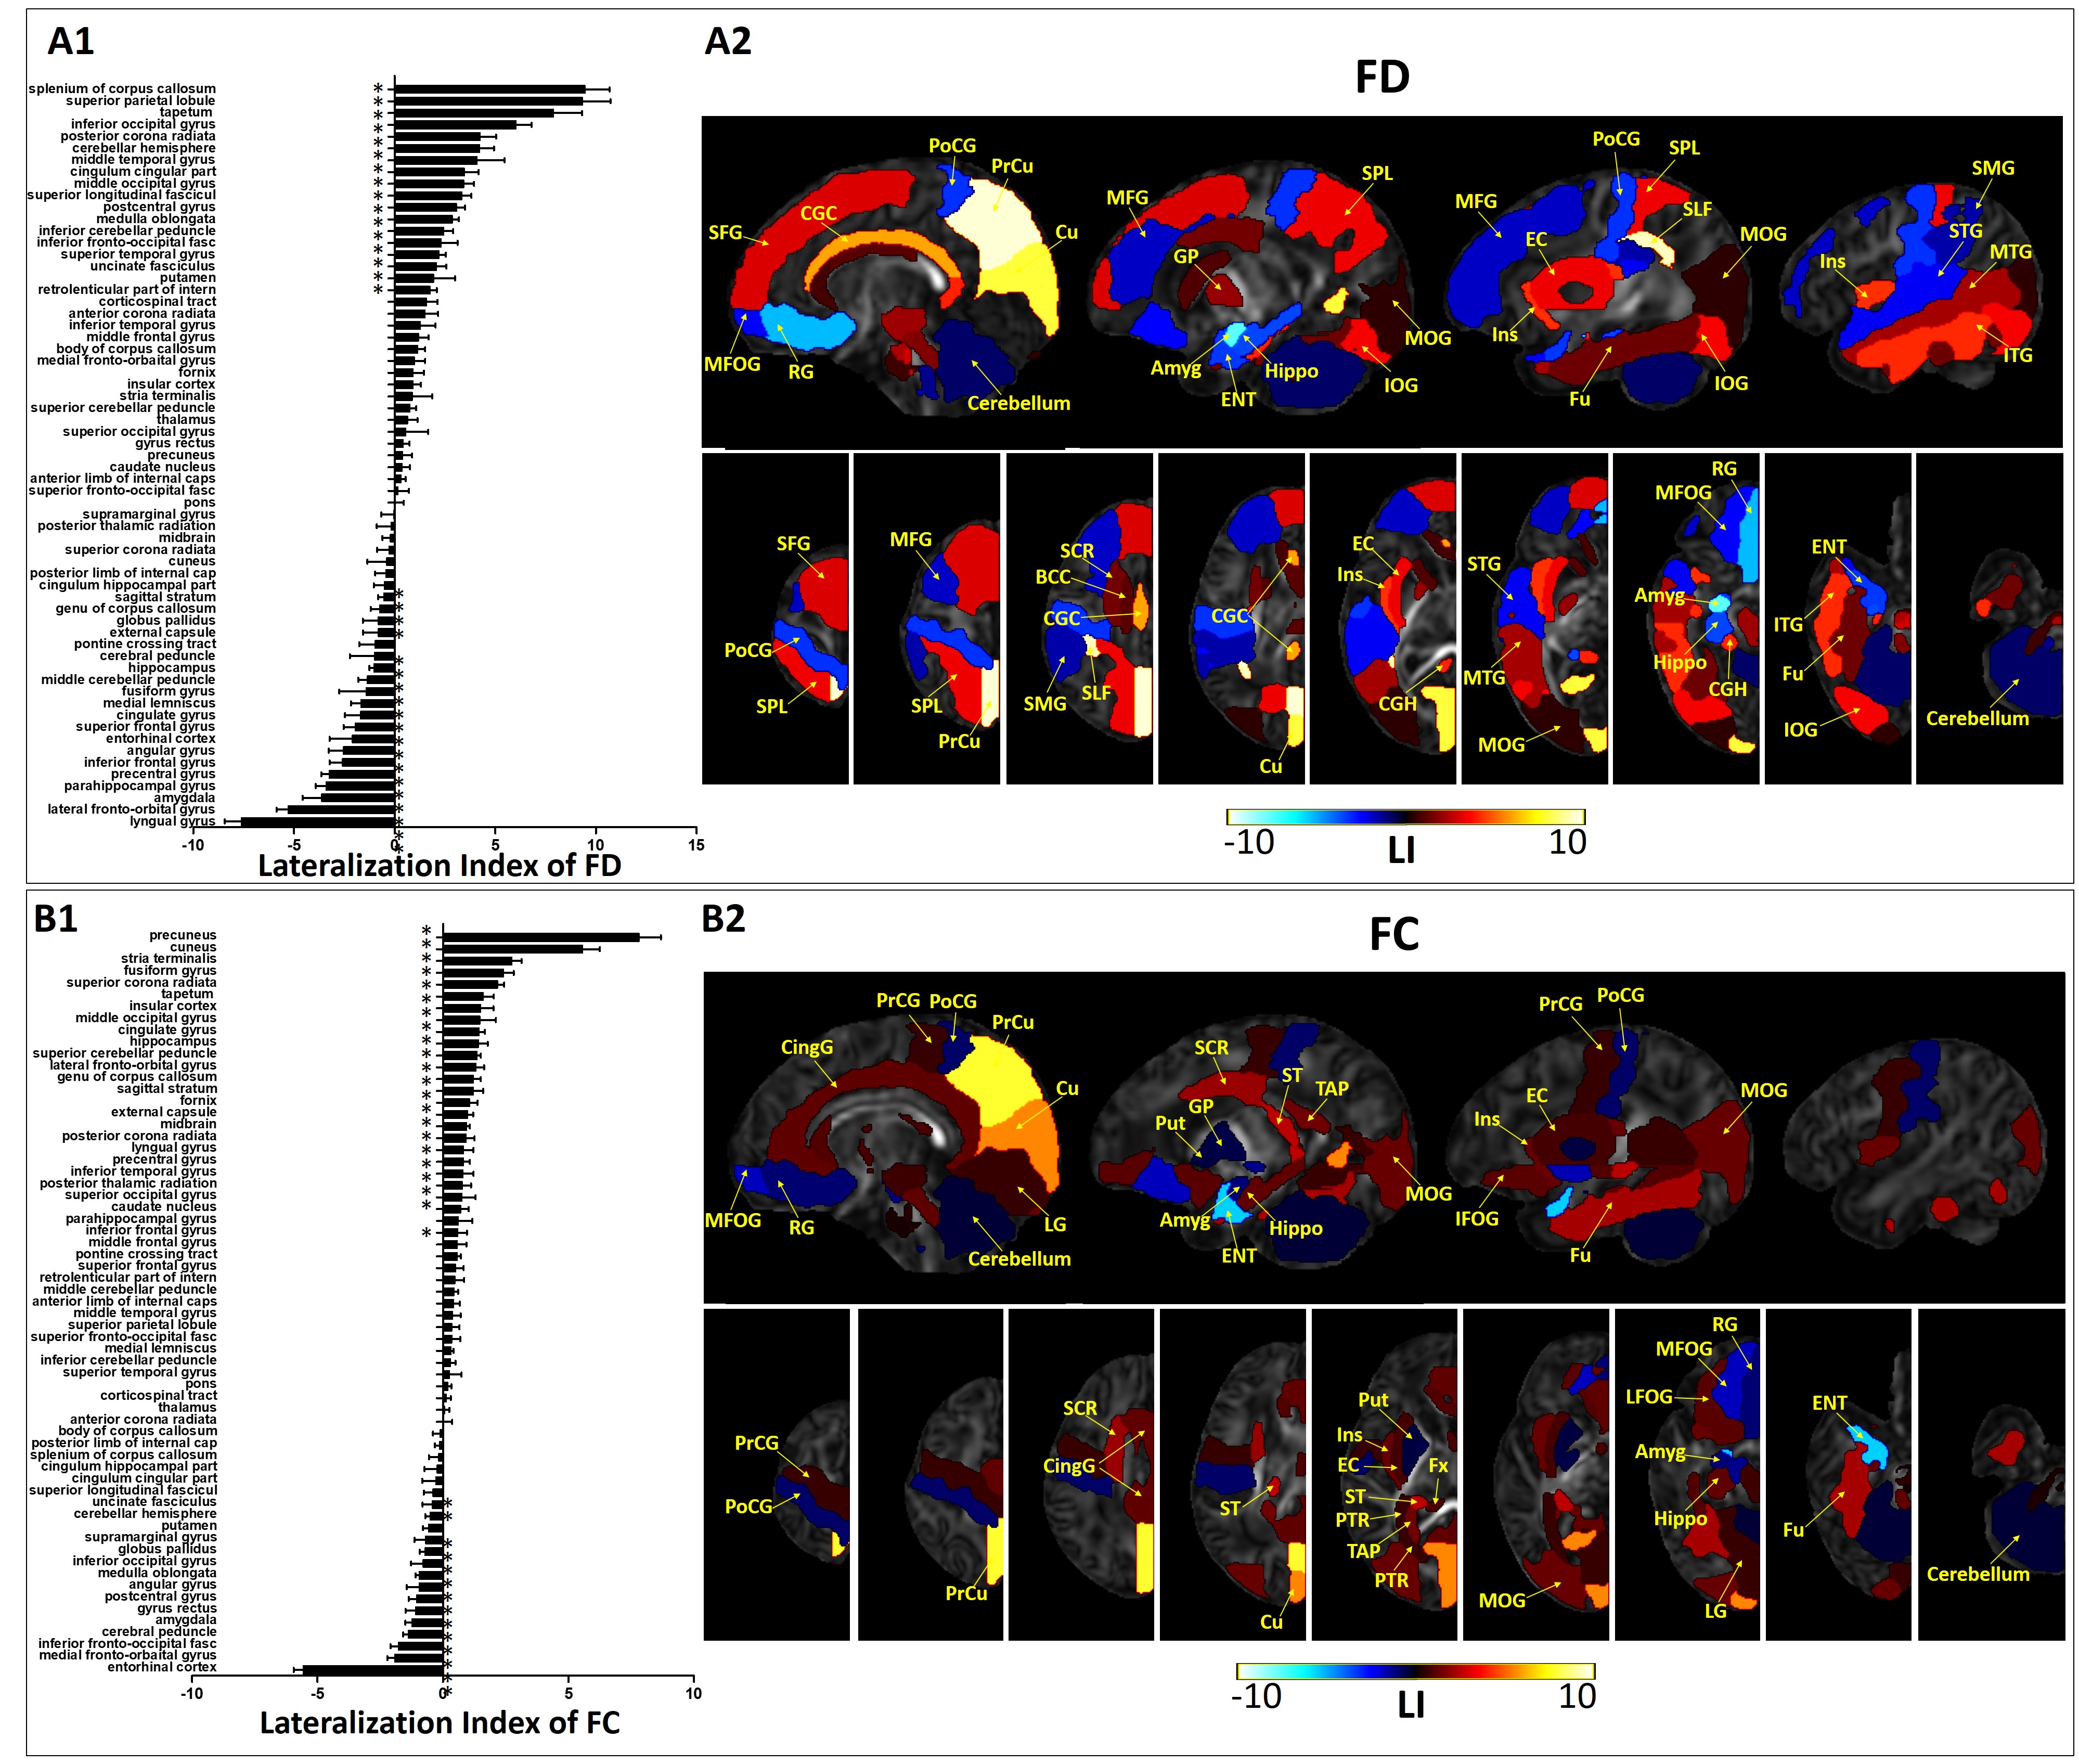
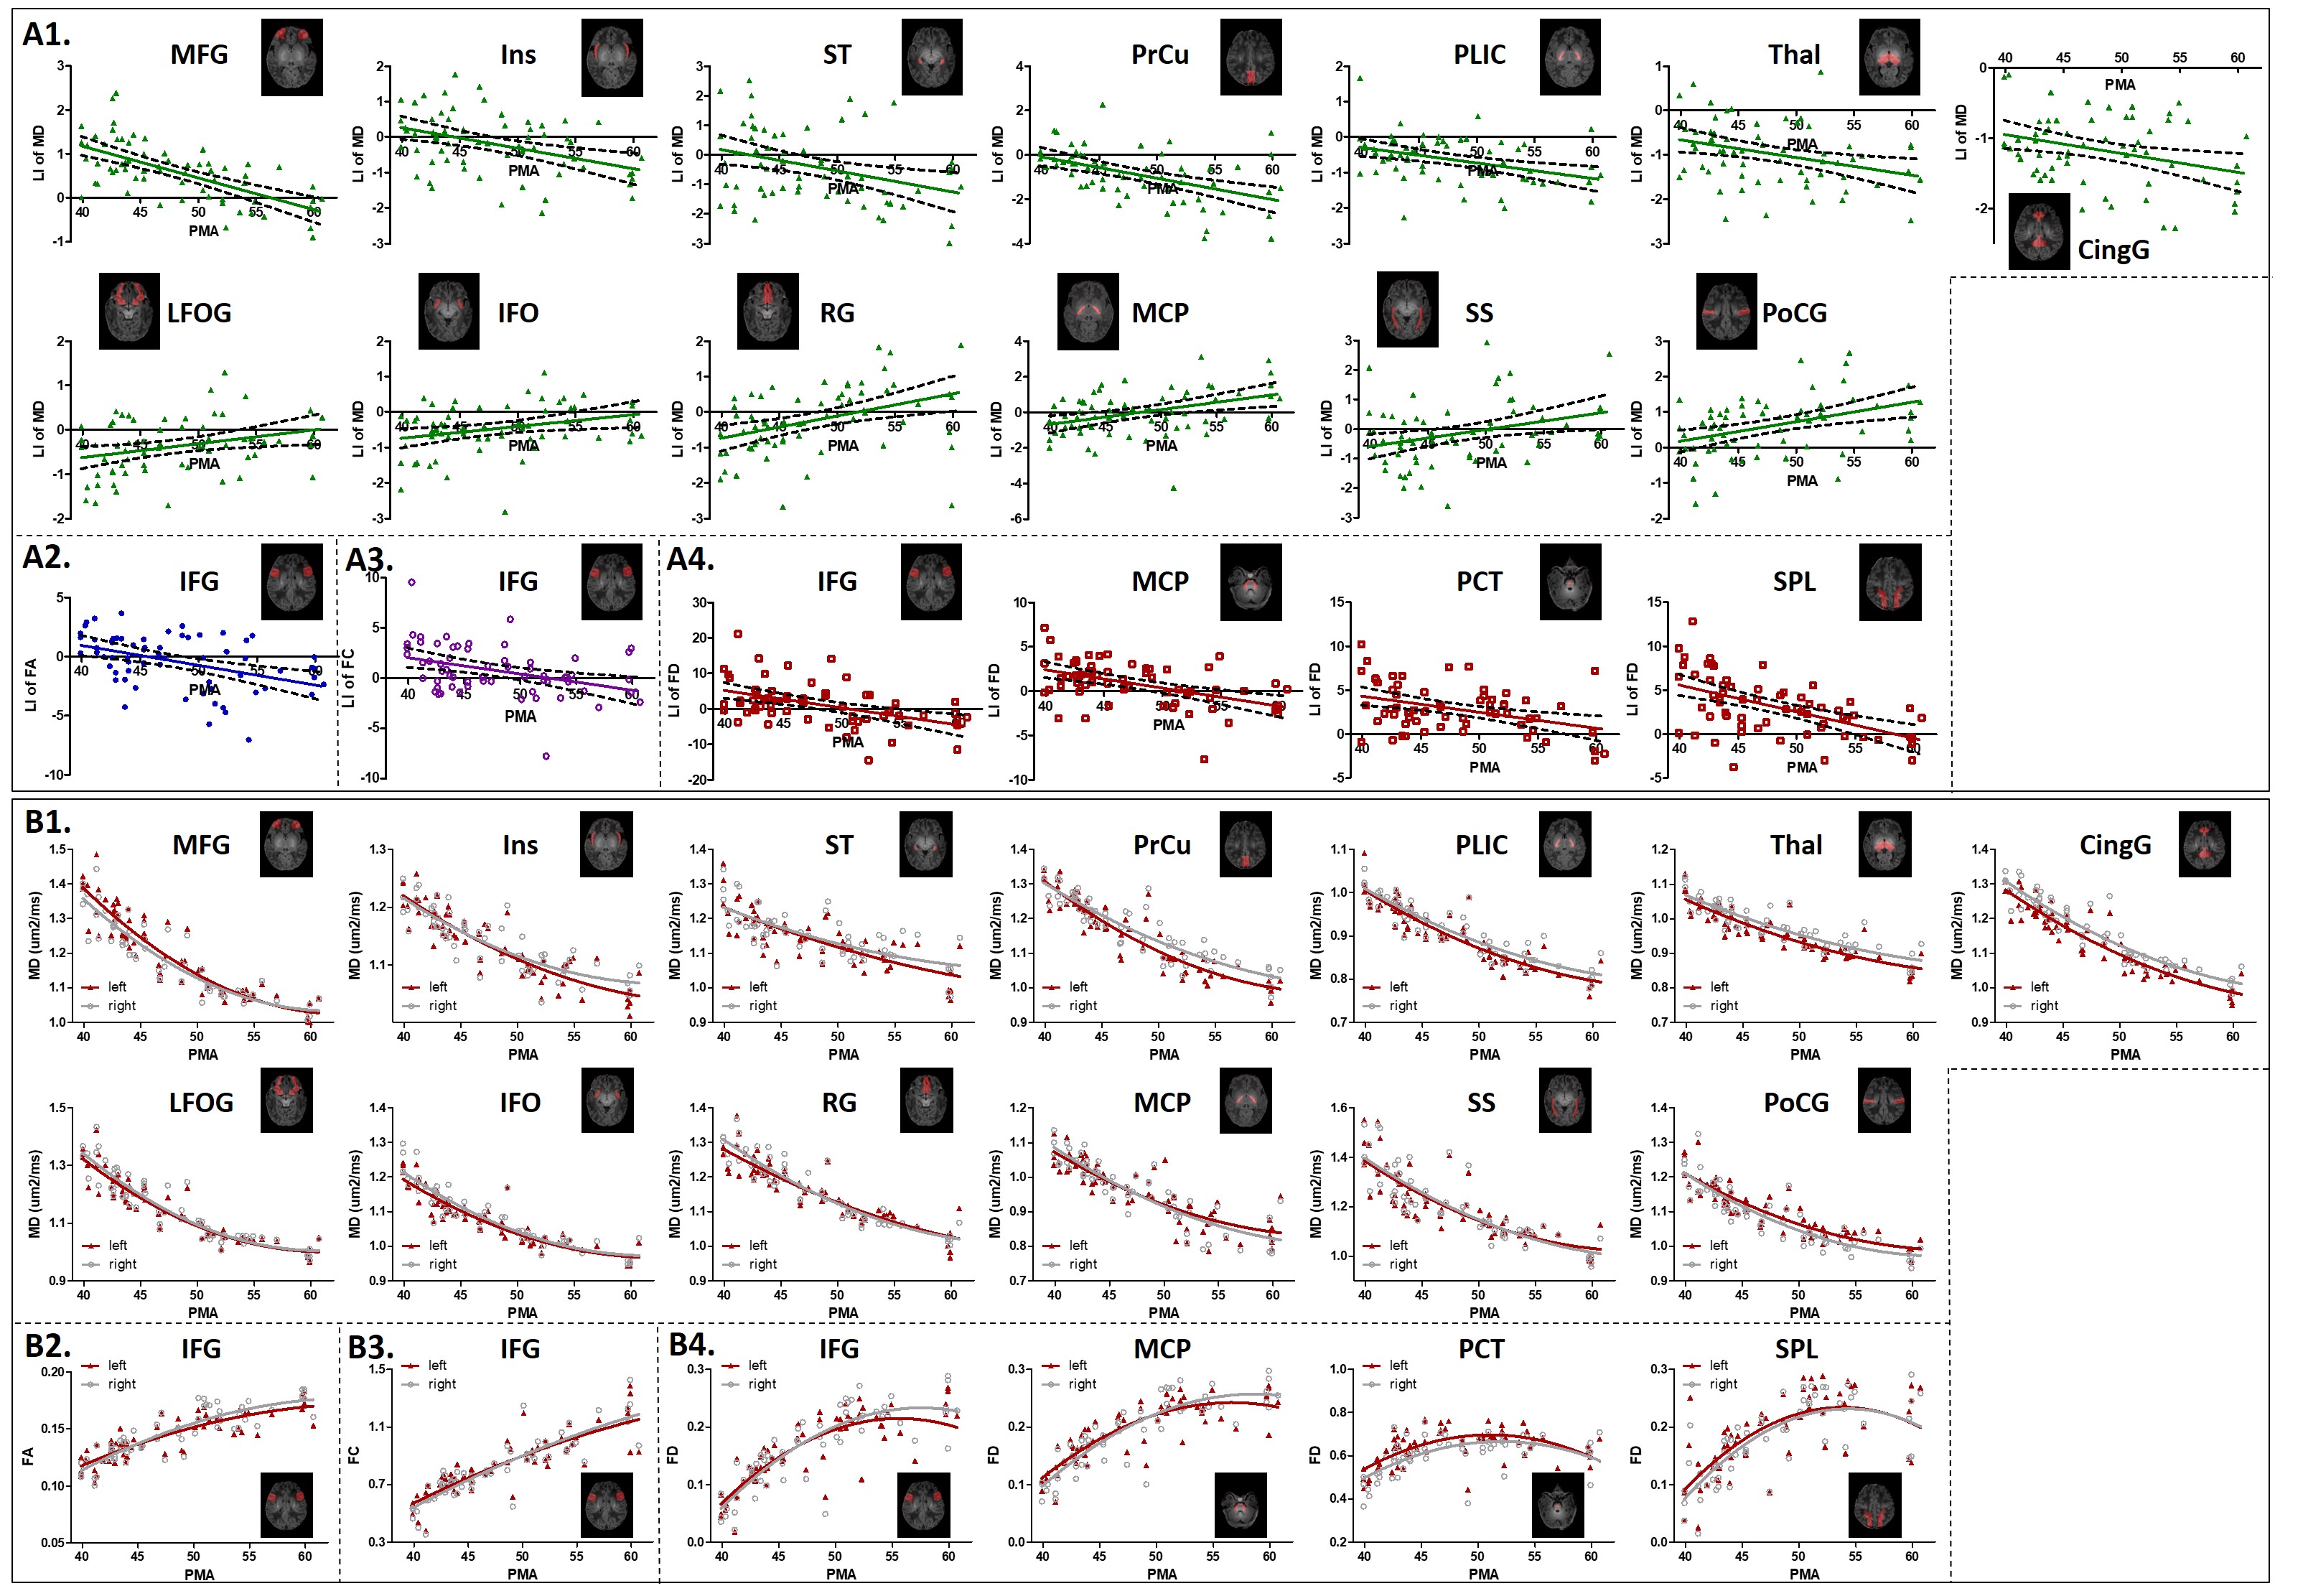
In the first half-of-year, the brain of infants demonstrated extensive regions with structural asymmetry. A distinct center-versus-peripheral asymmetry pattern was observed in MD, namely, leftward lateralization in the neocortex and rightward asymmetry in the central brain (Fig.1A), while the asymmetry patterns of FA, FD, and FC maps were more complicated (Fig.1B and Fig.2). In addition, the posterior brain demonstrated more remarkable lateralization compared with the anterior brain in all metric maps. Regionally, language processing regions showed a rightward asymmetry, while visuo-spatial processing regions exhibited leftward lateralization in FA, FD, and FC maps. Most WM regions were lateralized to the left in FA, FD, and FC maps (corresponding to rightward lateralization in MD).The LIs of several regions demonstrated significant developmental changes. For example, the LIs of the precuneus and postcentral gyrus showed increased asymmetry with age, indicating completing visual and somatosensory functions (Fig.3). LI of inferior frontal gyrus of FA, FD, and FC maps consistently demonstrated a shift from leftward to rightward lateralization.
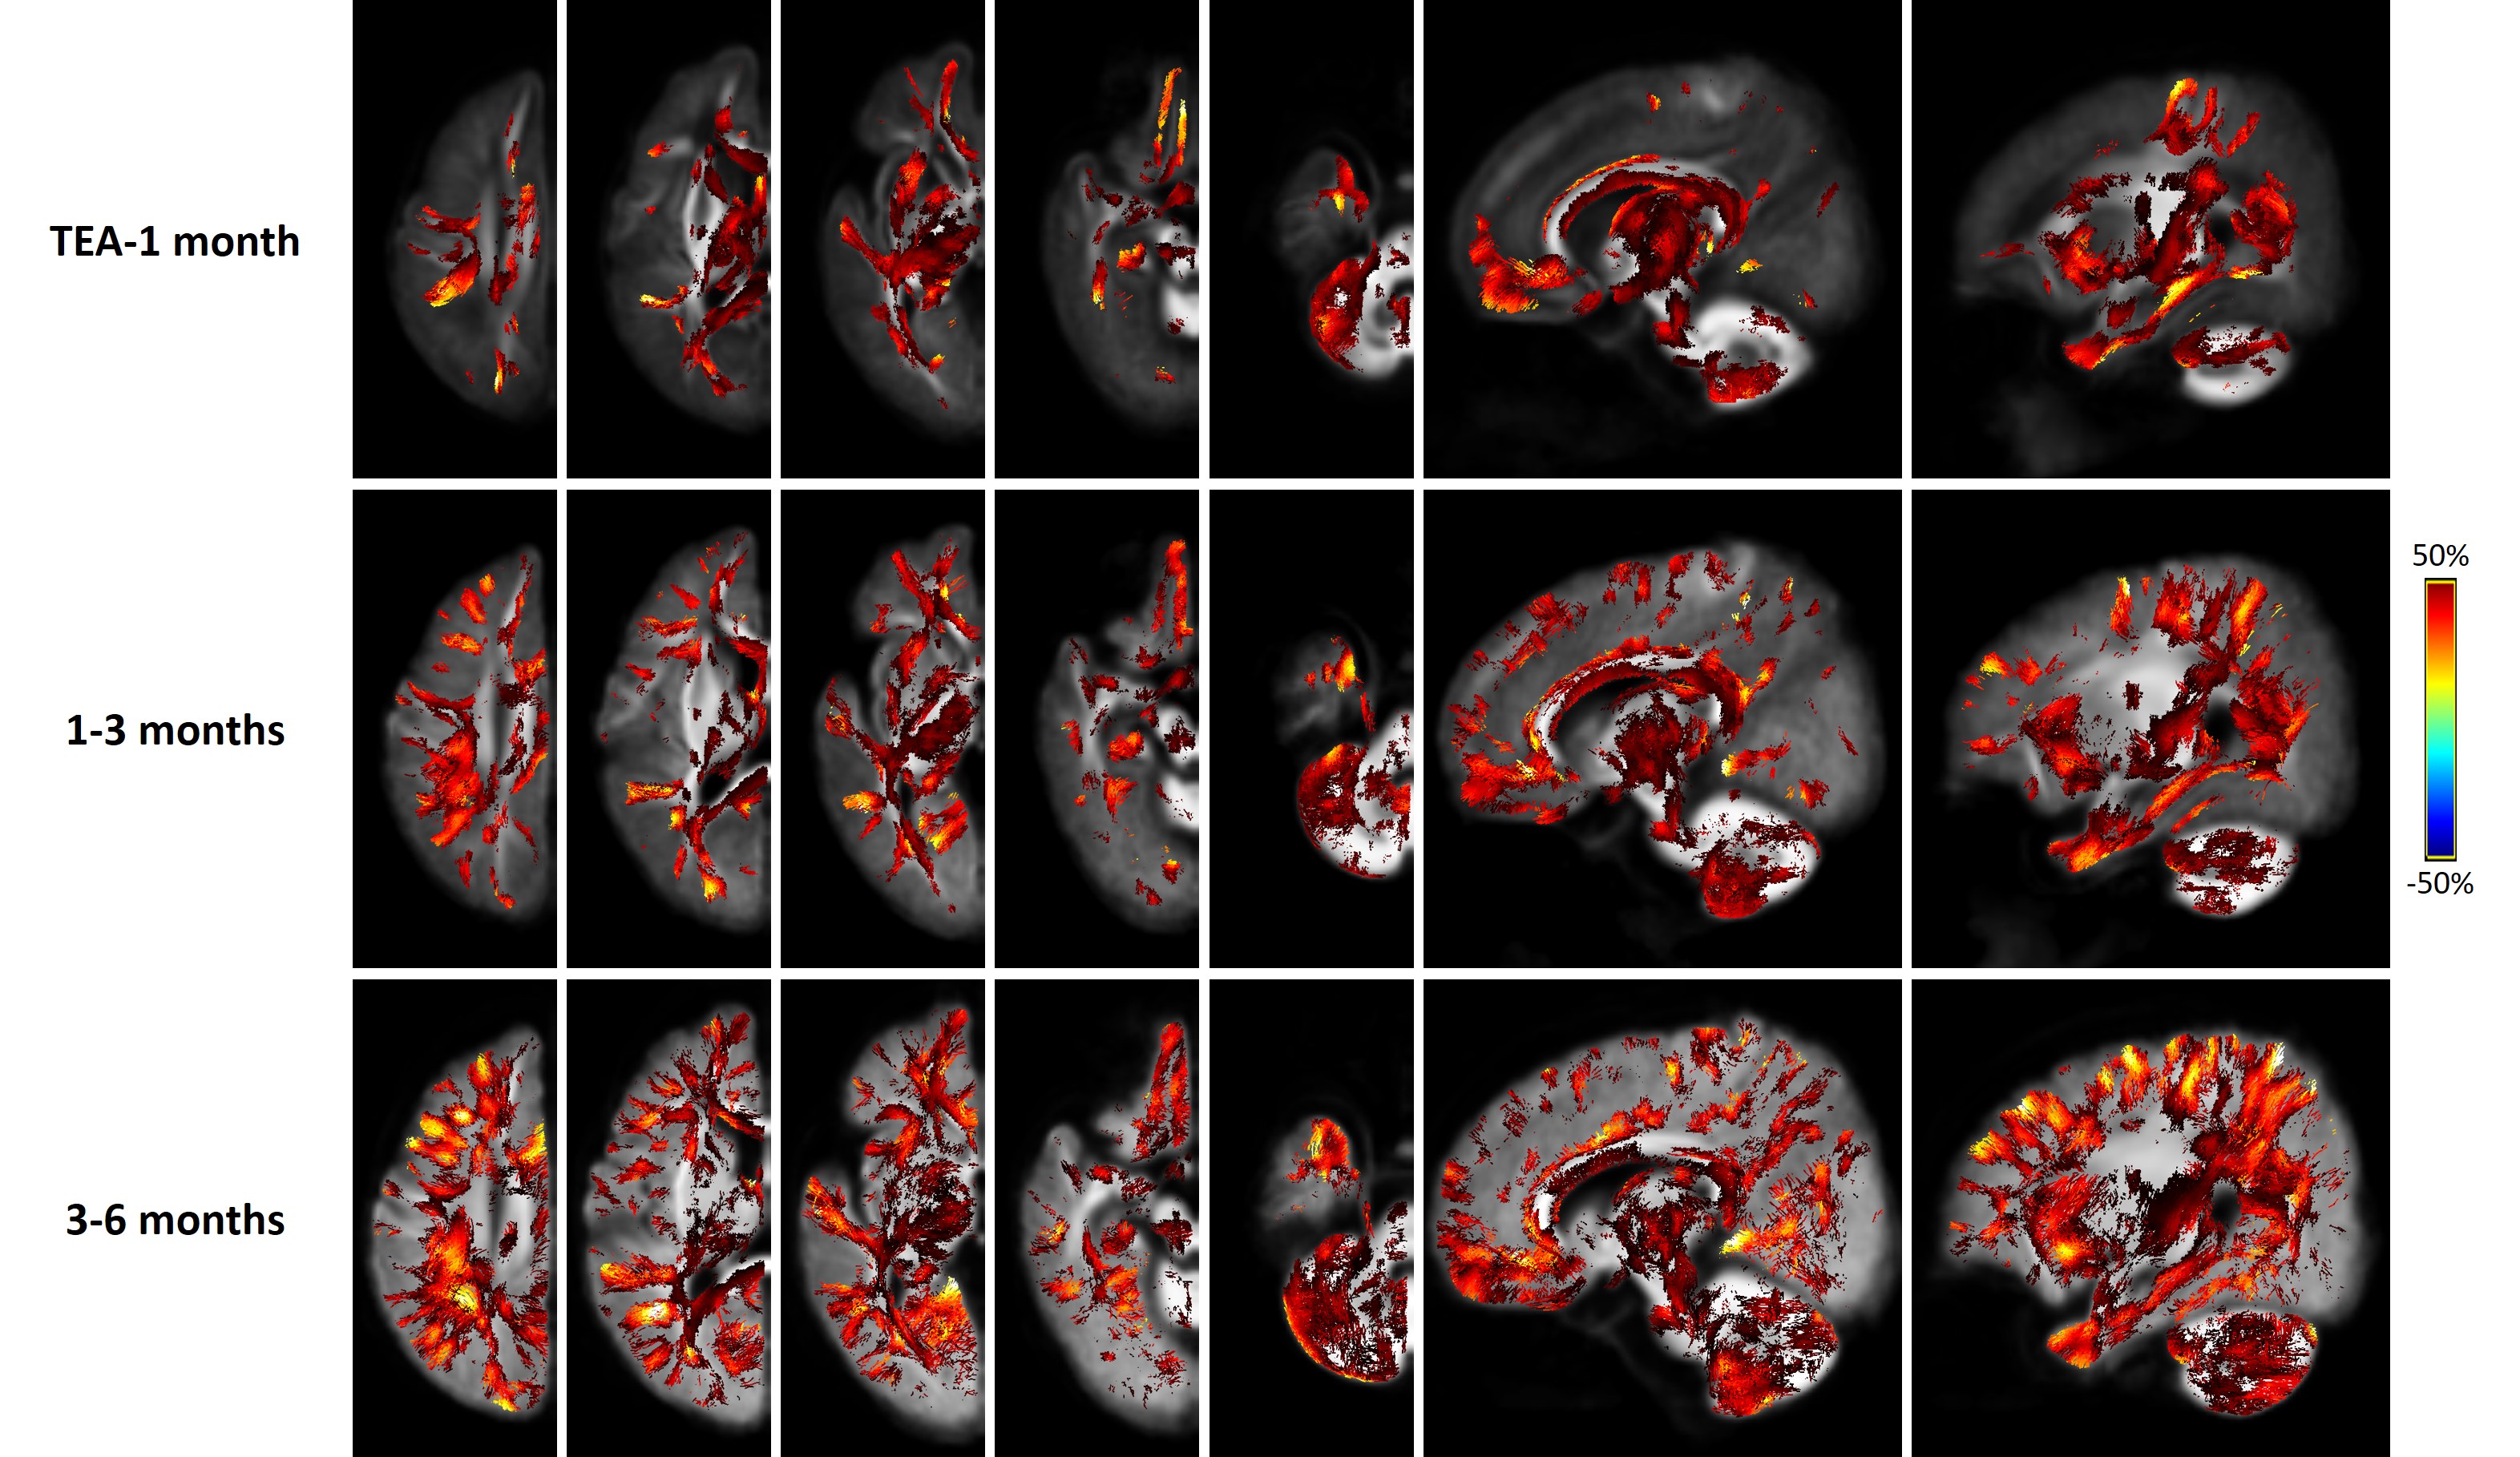
At the fixel level, extensive white matter structures showed constant leftward asymmetry in both FD and FDC maps with an inside-to-outside developmental change (Fig.4). The lateralized areas were more localized in the central brain and major WM tracts at TEA-1 month, but extended to peripheral and subcortical WM at 1-3 months and further increased at 3-6 months. Moreover, once the subcortical WM developed asymmetry, its degree of asymmetry was higher than that of the central brain.
Discussion
This study, for the first time, investigated the whole-brain asymmetry of infants within half-a-year with comprehensive ROI-based and fixel-based analysis. Results revealed a center-versus-peripheral asymmetry pattern in the MD measurement and inside-to-outside asymmetry changes with brain development based on FBA. We also found 1) the posterior brain demonstrated more established function specialization compared with the anterior brain, which is in accordance with the development trend of the brain from dorsal to rostrum16; 2) the rightward asymmetry in language processing regions and leftward asymmetry in visuospatial processing regions is opposite to the adult1,17-19, similar to the findings in another infant study20; 3) leftward lateralization of the WM was found from both ROI-based analysis and FBA, while FBA demonstrated more extensive differences. Moreover, brain asymmetry actively changes with development in terms of the degree (LI), lateralization (leftward versus rightward), and spatial distribution (inside-to-outside).Conclusion
In summary, the results revealed important spatiotemporal asymmetry patterns in early life, and the lateralization changed with age, which contributed to the understanding of brain development during infancy.Acknowledgements
This work was supported by the Ministry of Science and Technology of the People’s Republic of China (2018YFE0114600), National Natural Science Foundation of China (61801424, 81971606, 91859201, 61801421, and 81971605), Fundamental Research Funds for the Central Universities of China (2019QNA5024 and 2019FZJD005)), and Scientific Research Fund of Zhejiang Provincial Education Department (Y201431325).References
1. Duboc V, Dufourcq P, Blader P, Roussigne M. Asymmetry of the Brain: Development and Implications. Annu Rev Genet. 2015;49:647-672.
2. Toga AW, Thompson PM. Mapping brain asymmetry. Nat Rev Neurosci. 2003;4(1):37-48.
3. Kong XZ, Mathias SR, Guadalupe T, et al. Mapping cortical brain asymmetry in 17,141 healthy individuals worldwide via the ENIGMA Consortium. P Natl Acad Sci USA. 2018;115(22):E5154-E5163.
4. Dubois J, Dehaene-Lambertz G, Perrin M, et al. Asynchrony of the early maturation of white matter bundles in healthy infants: Quantitative landmarks revealed noninvasively by diffusion tensor imaging. Hum Brain Mapp. 2008;29(1):14-27.
5. Liu Y, Baleriaux D, Kavec M, et al. Structural asymmetries in motor and language networks in a population of healthy preterm neonates at term equivalent age: A diffusion tensor imaging and probabilistic tractography study. Neuroimage. 2010;51(2):783-788.
6. Dean DC, Planalp EM, Wooten W, et al. Mapping White Matter Microstructure in the One Month Human Brain. Sci Rep-Uk. 2017;7.
7. Jenkinson M, Bannister P, Brady M, Smith S. Improved optimization for the robust and accurate linear registration and motion correction of brain images. Neuroimage. 2002;17(2):825-841.
8. Jenkinson M, Smith S. A global optimisation method for robust affine registration of brain images. Med Image Anal. 2001;5(2):143-156.
9. Andersson JLR, Skare S, Ashburner J. How to correct susceptibility distortions in spin-echo echo-planar images: application to diffusion tensor imaging. Neuroimage. 2003;20(2):870-888.
10. Andersson JLR, Sotiropoulos SN. An integrated approach to correction for off-resonance effects and subject movement in diffusion MR imaging. Neuroimage. 2016;125:1063-1078.
11. Oishi K, Mori S, Donohue PK, et al. Multi-contrast human neonatal brain atlas: application to normal neonate development analysis. Neuroimage. 2011;56(1):8-20.
12. Djamanakova A, Faria AV, Hsu J, et al. Diffeomorphic brain mapping based on T1-weighted images: improvement of registration accuracy by multichannel mapping. J Magn Reson Imaging. 2013;37(1):76-84.
13. Raffelt DA, Tournier JD, Smith RE, et al. Investigating white matter fibre density and morphology using fixel-based analysis. Neuroimage. 2017;144:58-73.
14. Jeurissen B, Tournier JD, Dhollander T, Connelly A, Sijbers J. Multi-tissue constrained spherical deconvolution for improved analysis of multi-shell diffusion MRI data. Neuroimage. 2014;103:411-426.
15. Raffelt DA, Smith RE, Ridgway GR, et al. Connectivity-based fixel enhancement: Whole-brain statistical analysis of diffusion MRI measures in the presence of crossing fibres. Neuroimage. 2015;117:40-55.
16. Leipsic PFOJTL. Developmental (myelogenetic) localisation of the cerebral cortex in the human subject. 1901;158(4077):1027-1030.
17. Knecht S, Deppe M, Drager B, et al. Language lateralization in healthy right-handers. Brain. 2000;123:74-81.
18. Zago L, Petit L, Jobard G, et al. Pseudoneglect in line bisection judgement is associated with a modulation of right hemispheric spatial attention dominance in right-handers. Neuropsychologia. 2017;94:75-83.
19. Zhen ZL, Kong XZ, Huang LJ, et al. Quantifying the Variability of Scene-Selective Regions: Interindividual, Interhemispheric, and Sex Differences. Hum Brain Mapp. 2017;38(4):2260-2275.
20. Gilmore JH, Lin W, Prastawa MW, et al. Regional gray matter growth, sexual dimorphism, and cerebral asymmetry in the neonatal brain. J Neurosci. 2007;27(6):1255-1260.
Figures