2242
Association between multi-modal term MRI biomarkers and early cerebral palsy risk in very preterm infants1Cincinnati Children's Hospital Medical Center, Cincinnati, OH, United States
Synopsis
Very preterm (VPT) infants are at risk for serious motor impairments, including cerebral palsy (CP). Motor interventions are most effective if delivered early, but early accurate biomarkers of CP are lacking. In a cohort of 345 VPT infants, we extracted cortical morphometrics and brain volumes from term structural MRI and applied graph theoretical methods to term diffusion MRI connectomes. We observed consistent negative associations between early CP risk and cortical surface area, subcortical volumes, and graph metrics, including global efficiency and local efficiency of motor regions. These early biomarkers enhance our understanding of VPT motor impairments and may predict CP.
Introduction
Very preterm (VPT; 32 weeks gestational age) infants disproportionally suffer from major and minor motor impairments, including cerebral palsy (CP). A recent international guideline recommended the combined use of structural MRI at term, and the General Movements Assessment (GMA) and/or Hammersmith Infant Neurological Examination (HINE) at 3-4 months corrected age to facilitate early diagnosis of CP1. The micro and macrostructural changes that antecede early diagnosis of CP are not well characterized. We previously demonstrated that automatically-extracted volumetrics and cortical morphometrics from term structural MRI predict motor aptitude at two-years of age2. Additional insight can be gleaned from term diffusion MRI using graph theoretical methods applied to the preterm connectome3–5. Preterm birth alters graph metrics, especially global efficiency, local efficiency, clustering coefficient, and strength6–8,9. In this study we aimed to correlate brain morphometry metrics from term structural MRI and graph theory metrics from term diffusion MRI with early diagnosis of CP at 3-months corrected age. This multi-modal analysis may further our understanding of the early structural antecedents of CP.Methods
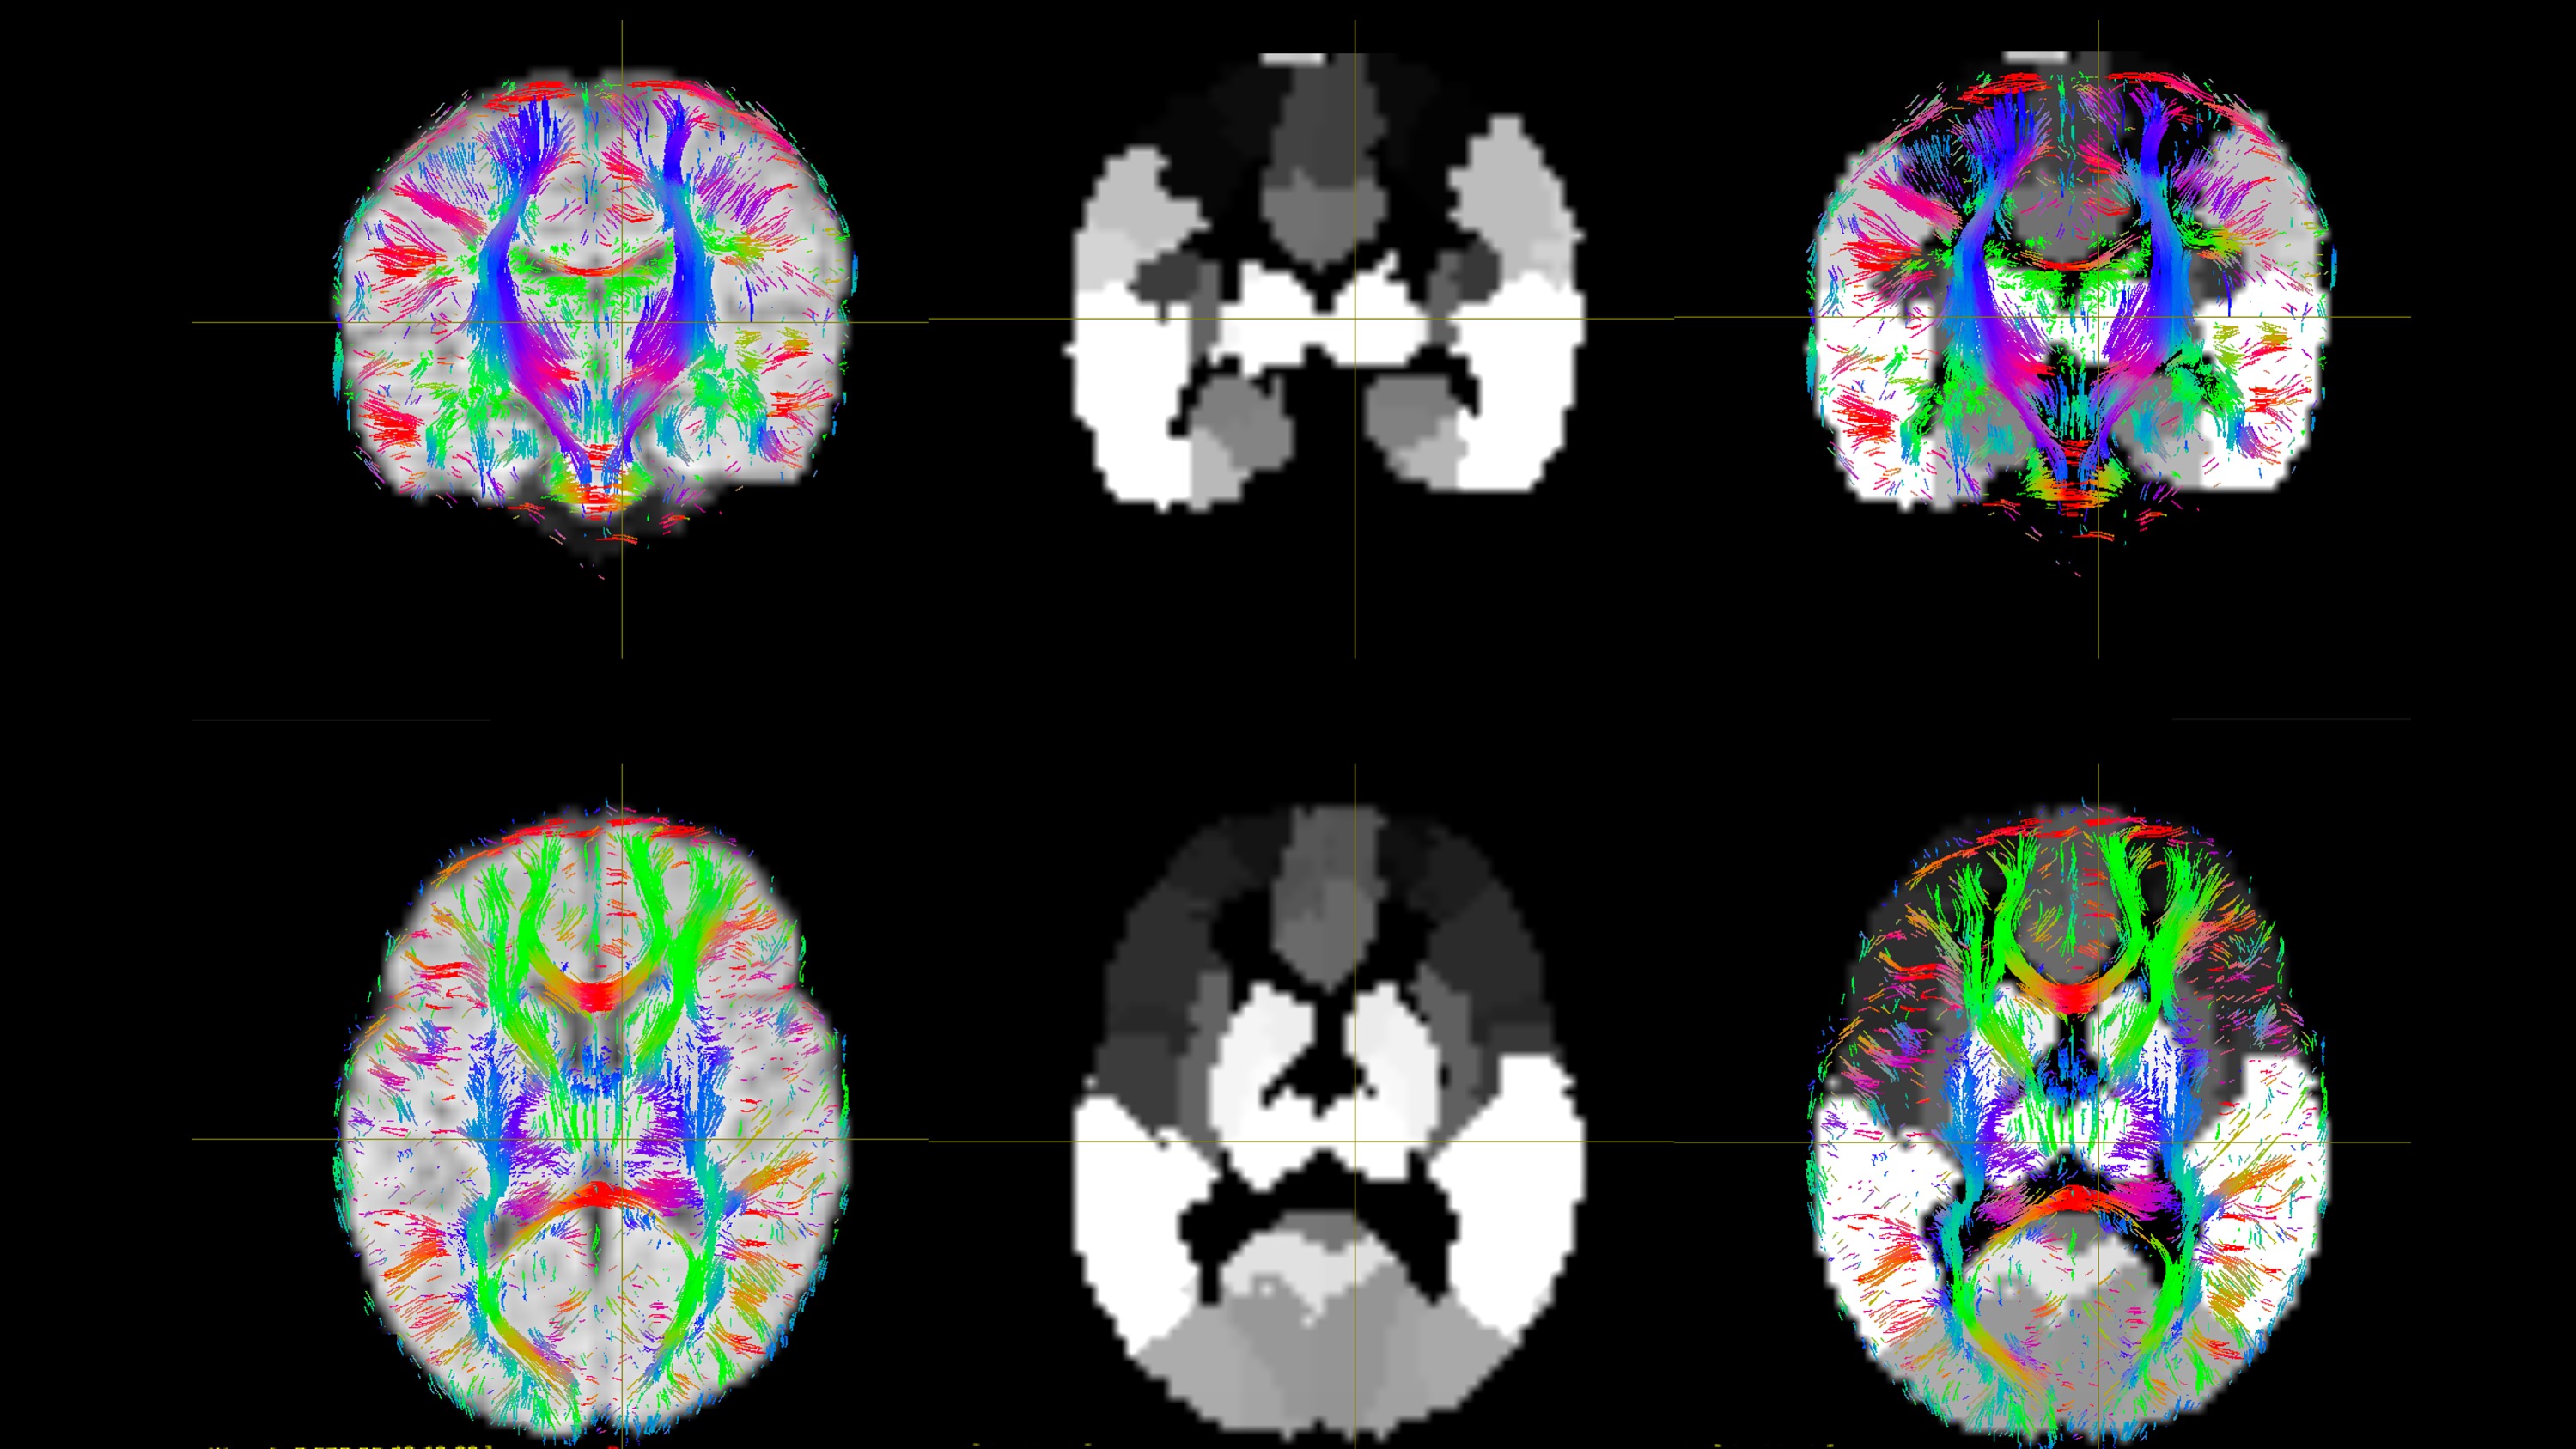
We prospectively enrolled a cohort of 345 VPT infants from the Greater Cincinnati area. Exclusions included chromosomal or congenital anomalies of the central nervous system, cyanotic heart disease, or mechanical ventilation past 45 weeks postmenstrual age. The Cincinnati Children’s Hospital Institutional Review Board approved the study. Infants were scanned during natural sleep on a 3T Philips Ingenia scanner with a 32-channel head coil as follows. Structural MRI (T2): TE 166 ms, TR 18567 ms, FA 90°, voxel dimensions 1.0×1.0× 1.0 mm3, and 3:43 minutes total scan time. Diffusion MRI: TE 89 ms, TR 5000 ms, FA 90°, FOV 160×160 mm2, 96×93 matrix, 2-mm contiguous slices, and 5:58 minutes total scan time. 34 directions of diffusion gradients were applied with a b value of 800 s/mm2; 4 b0 images acquired. At 3- to 4- months corrected age, infants returned for motor testing. Using the Novak et al. early CP diagnosis guidelines, we labeled infants at high risk for CP using a combination of moderate-severe injury on structural MRI plus abnormal GMA and/or HINE (score <57)1. We used the developing human connectome project (dHCP) pipeline to automatically segment T2-w images, resulting in volume measurements for each tissue type, lobe, and subcortical structure and measurements of surface area, sulcal depth, gyrification index, and curvature for each lobe. We processed the b800 data in FSL, correcting for susceptibility-induced distortions, eddy current artifact, and movement artifact. Using Diffusion Toolkit, we generated maps of fractional anisotropy (FA) and performed whole-brain, deterministic fiber tracking in diffusion space. We aligned each subject’s T2 to their diffusion image followed by alignment of the 90-region Automated Anatomical Labeling (AAL) infant template10,11 to create parcellated brain maps in diffusion space (Figure 1). In MRTRIX (mrtrix.org), we generated symmetrical, undirected connectivity matrices, with edge weights corresponding to the mean FA for all streamlines connecting each pair of regions. From these, we computed global efficiency for each whole connectome and local efficiency, clustering coefficient, and strength for each brain region. Using logistic regression, we examined the correlation of all MRI metrics with early diagnosis of CP. We corrected each model for postmenstrual age at scan, gestational age, severe retinopathy of prematurity, severe bronchopulmonary dysplasia, and late-onset sepsis, as these covariates are known CP risk factors that differed significantly between risk groups. A total of 345 tests were performed with the potential Type I error from multiple comparisons corrected using false discovery rate (FDR).Results
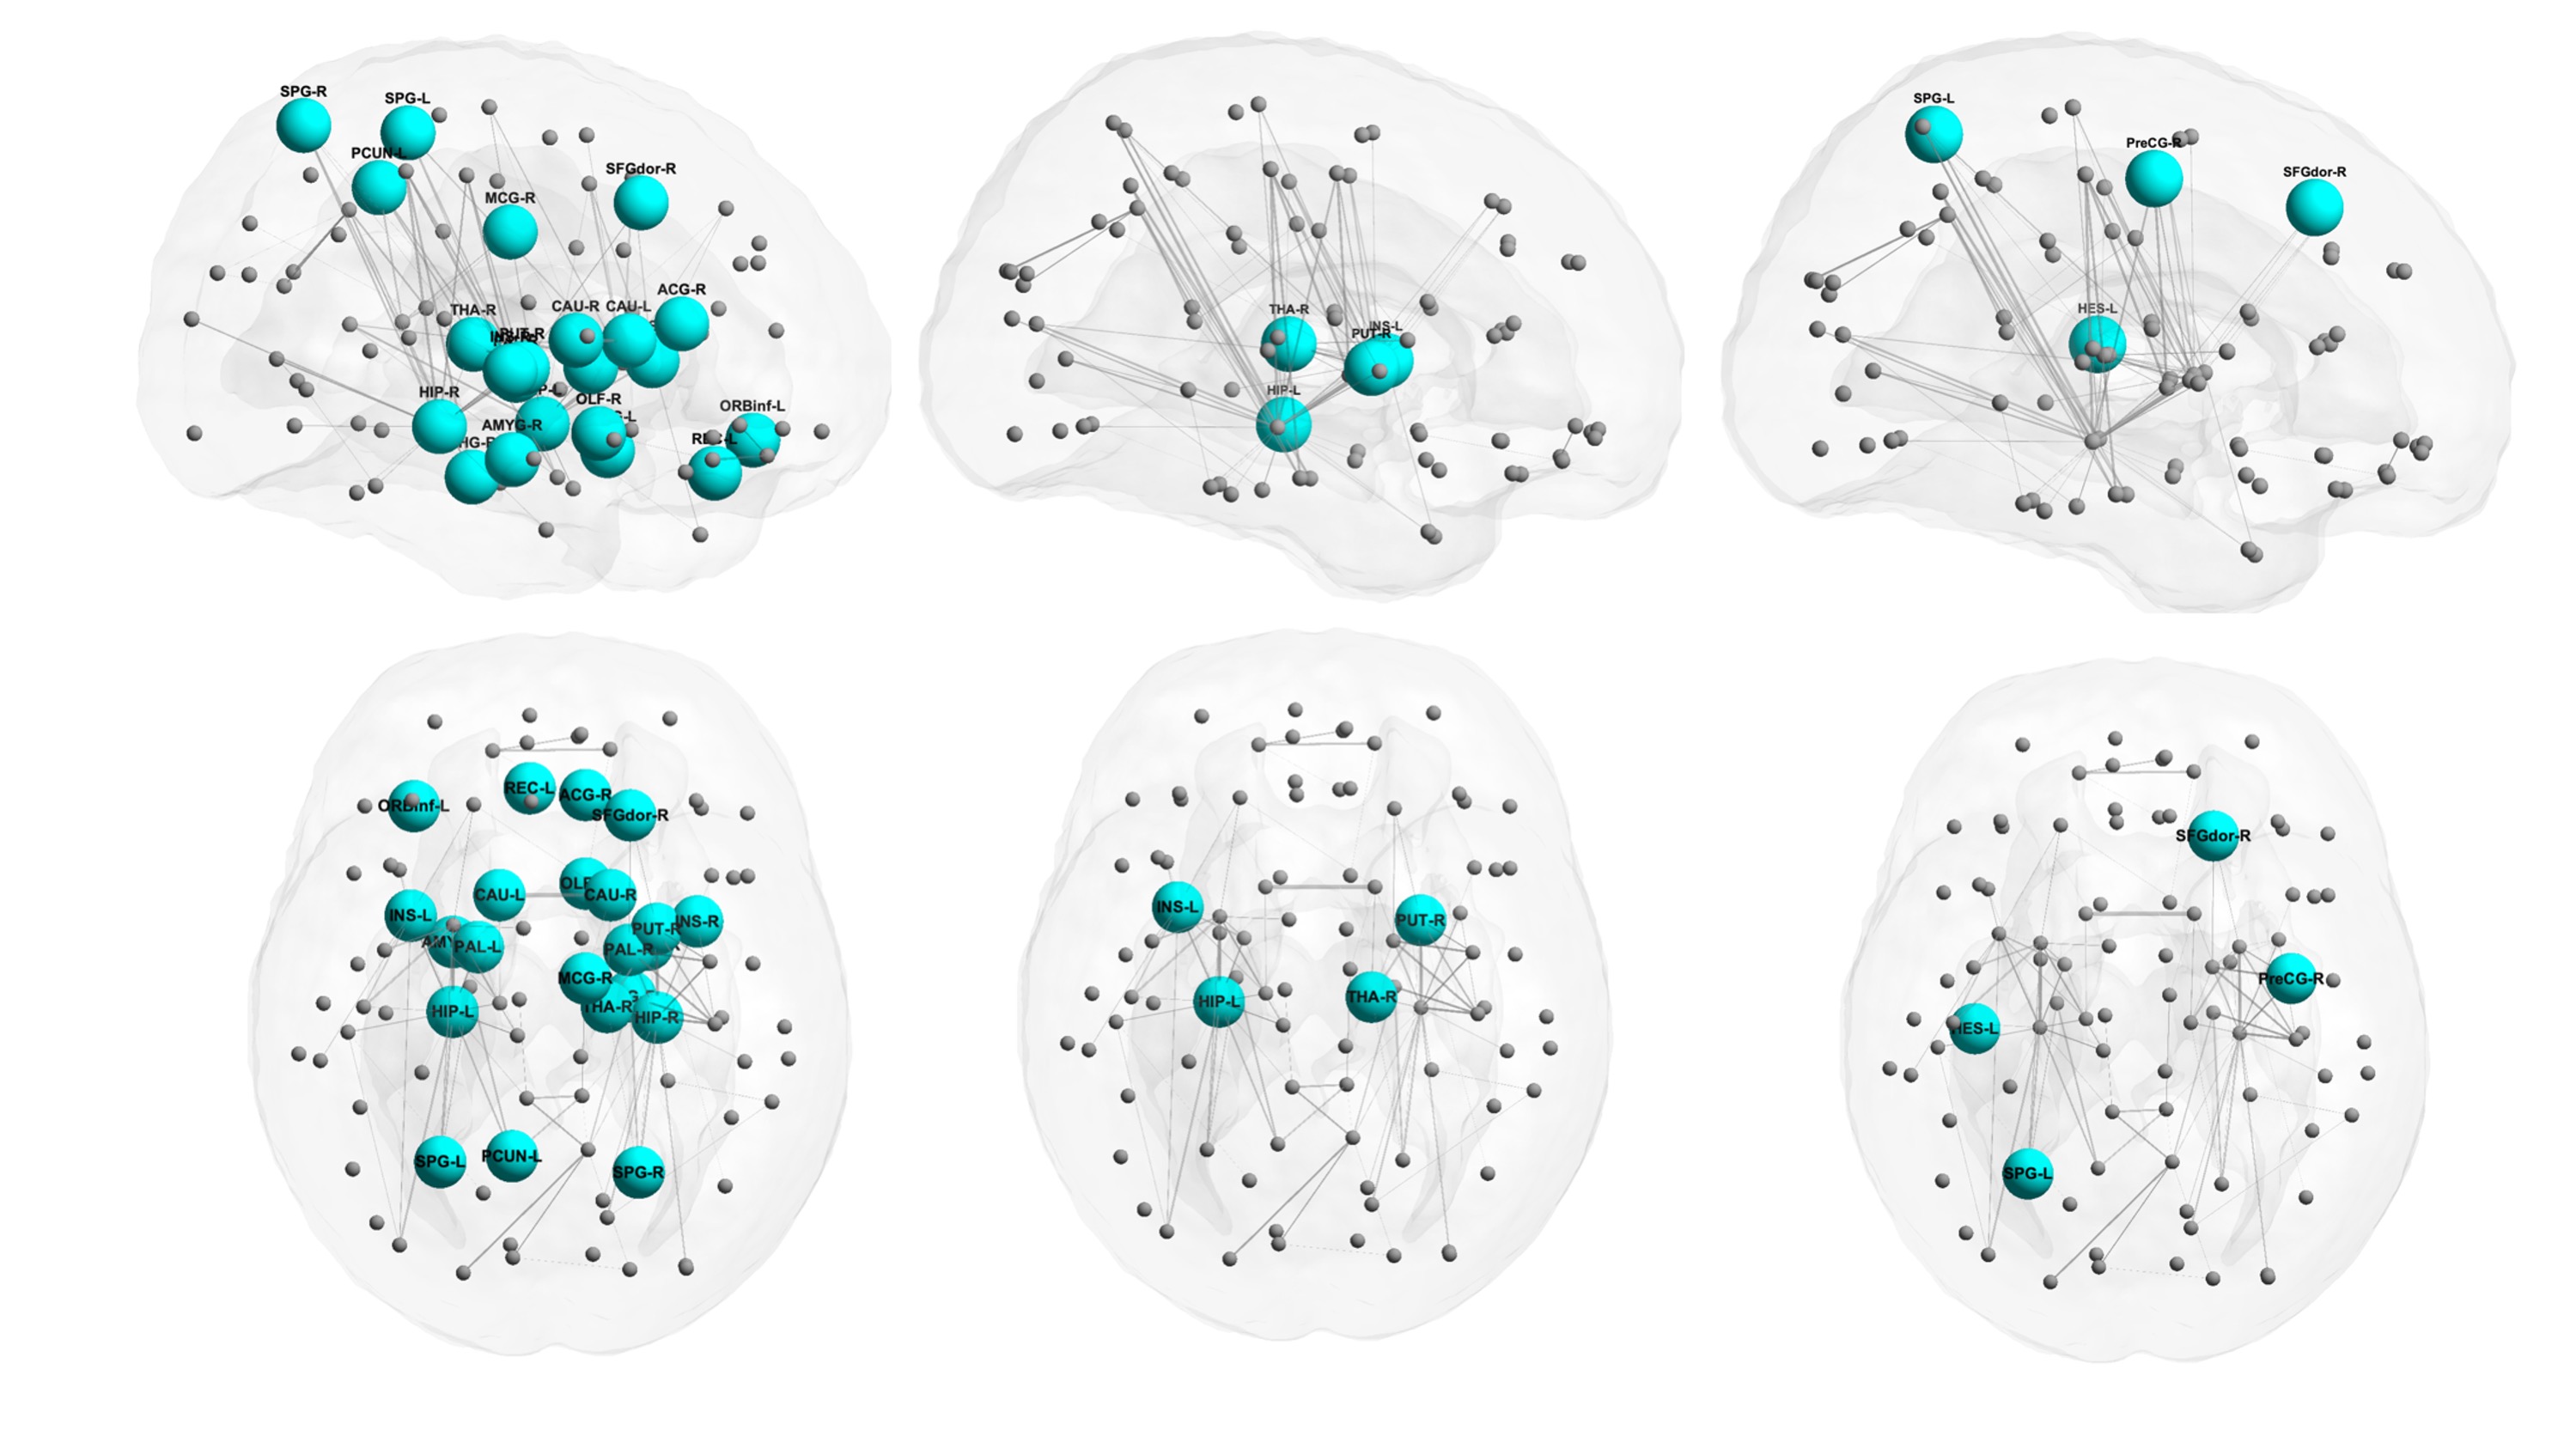
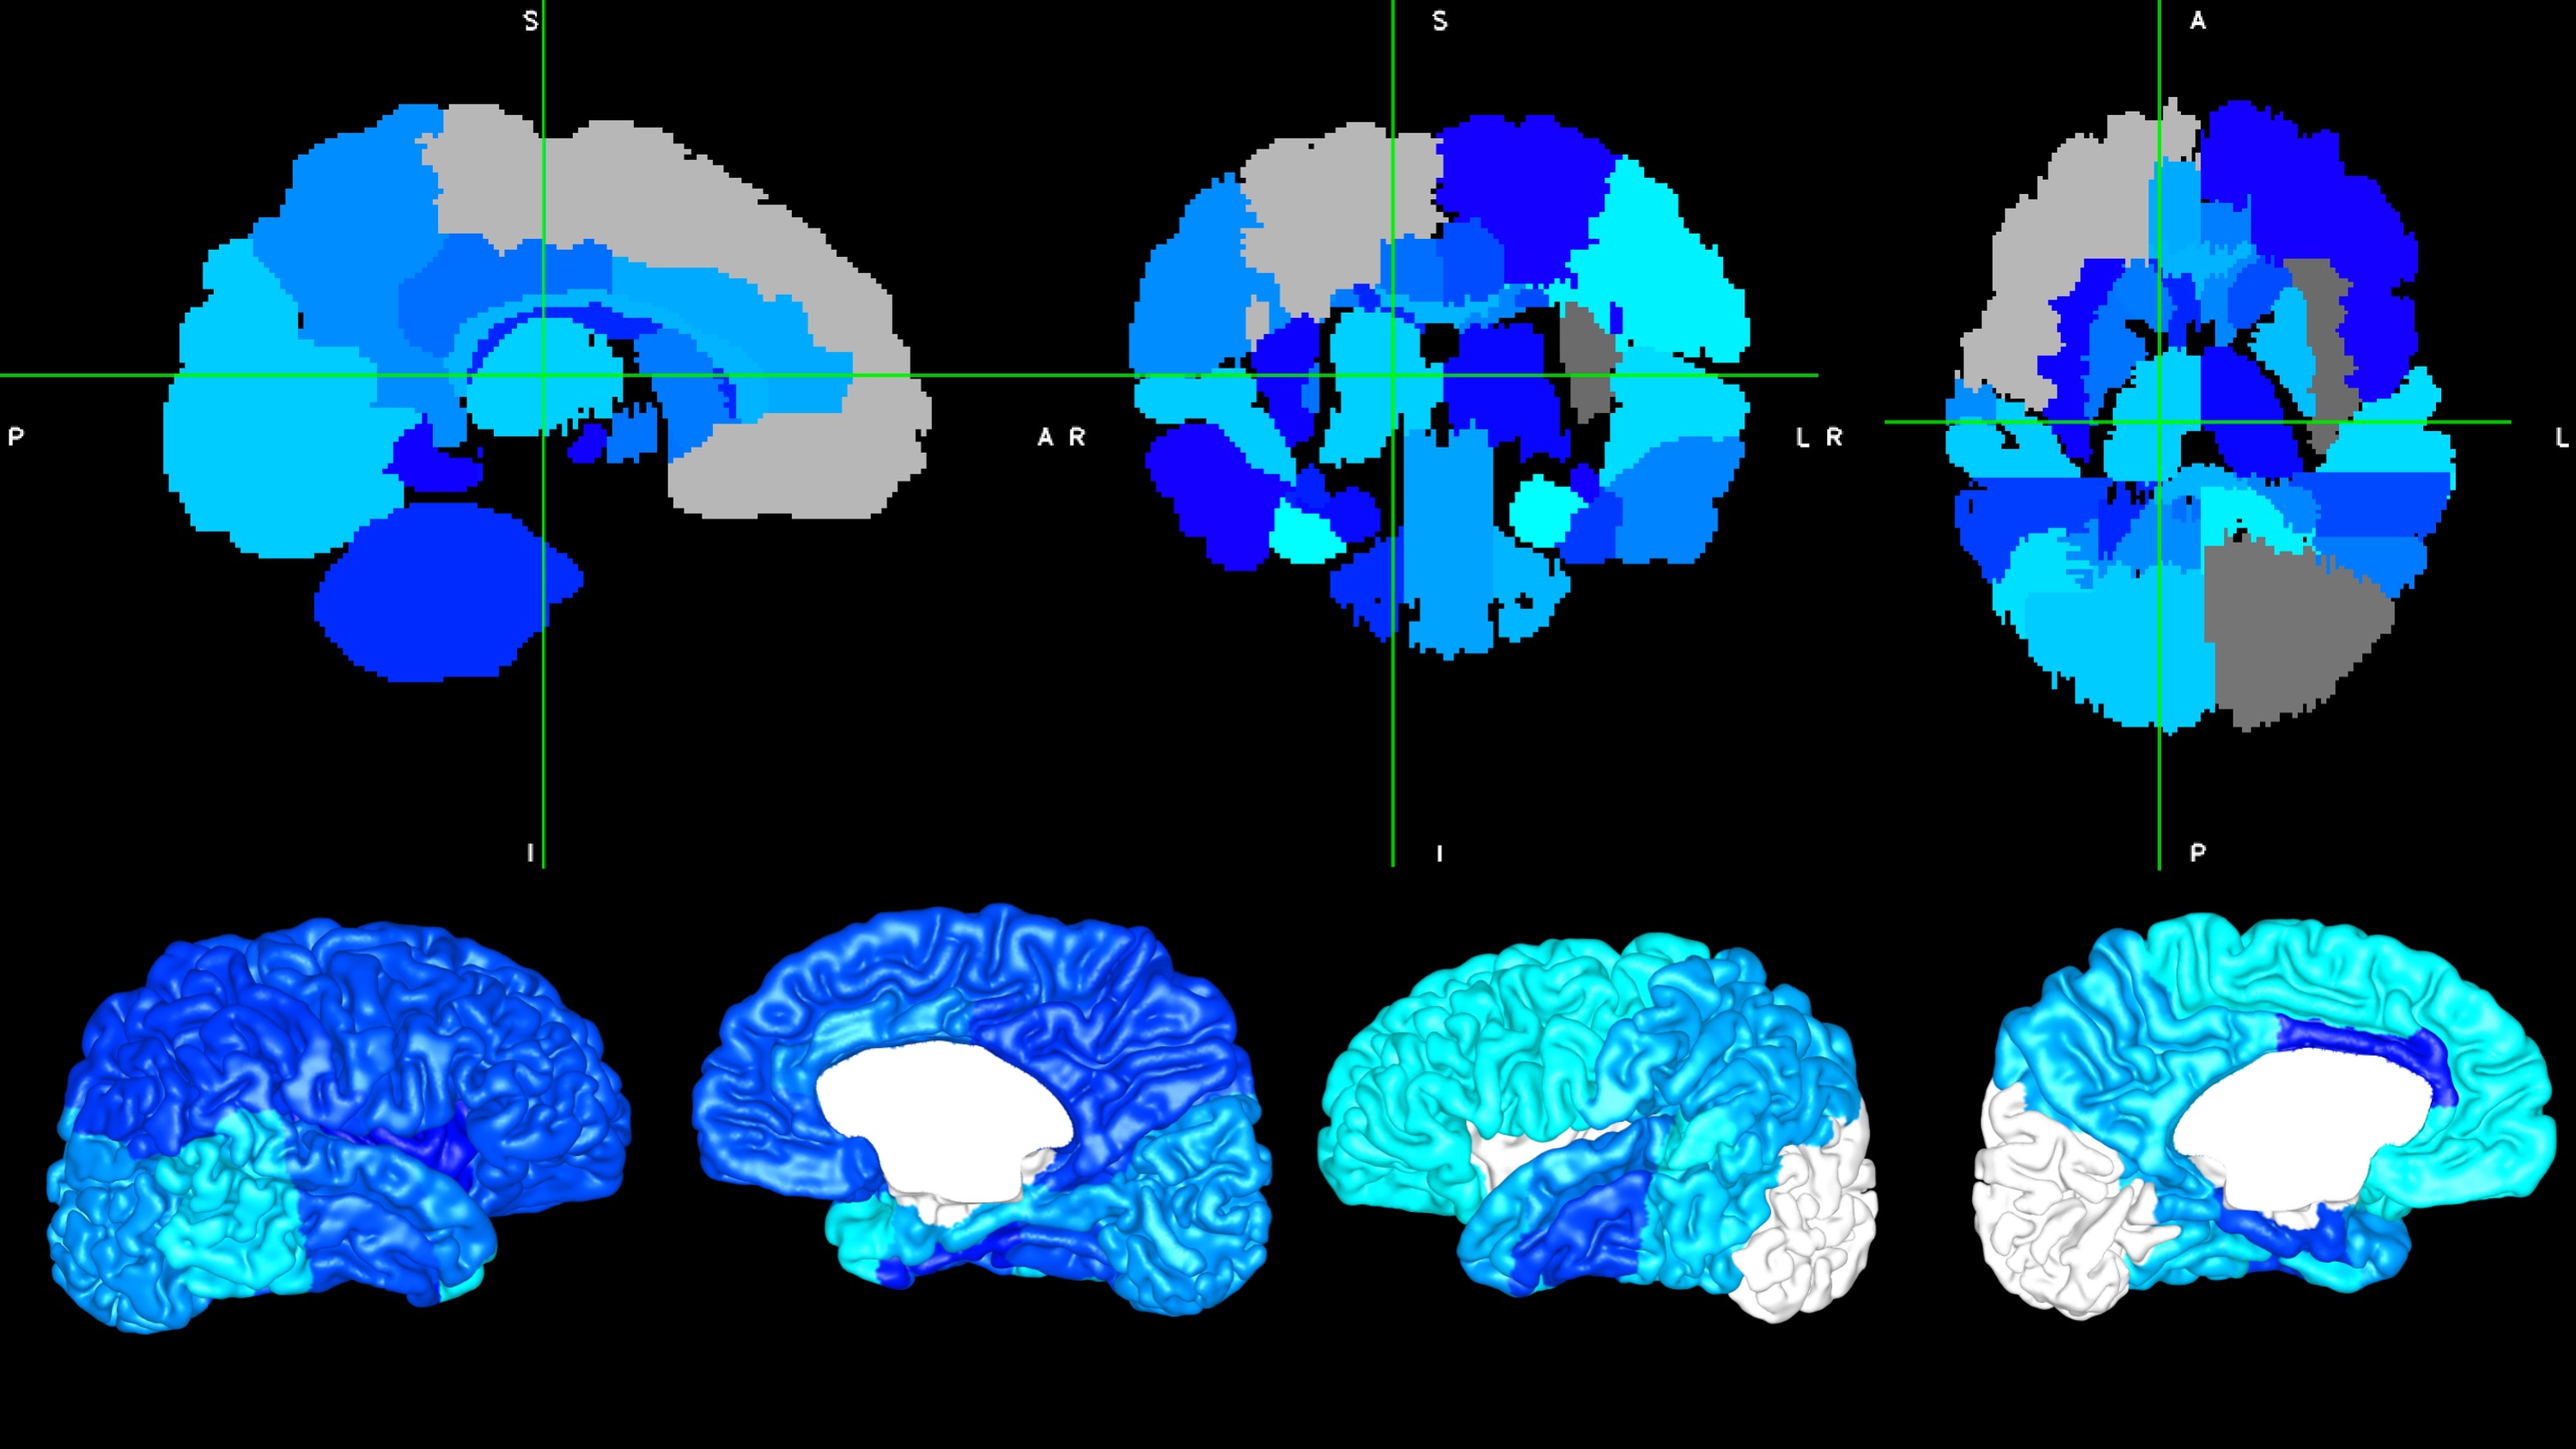
In our study, 321 subjects had high-quality artifact-free T2-w images that were successfully processed by the dHCP, and 308 of these subjects returned for follow-up motor assessments (19 high risk). 331 subjects had high-quality dMRI with optimal AAL template alignment, and 318 returned (26 high risk). Early diagnosis of CP was negatively correlated with global efficiency of the entire brain network, with local efficiency in 22 nodes including 10 motor regions, and with clustering coefficient and strength in a handful of mainly motor regions (Figure 2). CP risk was also negatively correlated with volume in the majority of lobes and subcortical structures (Figure 3, top) and with cortical surface area in the majority of brain lobes (Figure 3, bottom). For the other cortical metrics, CP risk was negatively correlated with overall sulcal depth and with sulcal depth of the left temporal lobe. No curvature or gyrification metrics remained significant after covariate and FDR correction. There were no significant positive correlations. Of all potential biomarkers tested, the strongest five associations with CP were: local efficiency of the right putamen, brainstem volume, left parietal lobe surface area, global efficiency of the entire brain network, and cerebellar volume (p values from 1.4E-05 to 3.8E-05).Discussion and Conclusion
Biomarkers from graph theory network analysis, especially global efficiency and local efficiency of motor nodes (e.g. the putamen), were highly correlated with early diagnosis of CP in very preterm infants. Macrostructural volumes of the brainstem and cerebellum were also highly correlated with CP. As part of a multi-modal MRI risk-assessment model, these advanced MRI biomarkers at term-equivalent age may help determine the highest risk infants in a timely manner, facilitating early intervention.Acknowledgements
This research was supported by grants R01-NS094200-05 and R01-NS096037-03 from the National Institute of Neurological Disorders and Stroke (NINDS) and R21-HD094085 from the Eunice Shriver Kennedy National Institute of Child Health and Human Development (NICHD). We sincerely thank the parents of infants that participated in our study and the Cincinnati Infant Neurodevelopment Early Prediction Study (CINEPS) Investigators: Principal Investigator: Nehal A. Parikh, DO, MS. Collaborators (in alphabetical order): Mekibib Altaye, PhD, Anita Arnsperger, RRT, Traci Beiersdorfer, RN BSN, Kaley Bridgewater, RT(MR) CNMT, Tanya Cahill, MD, Kim Cecil, PhD, Kent Dietrich, RT, Christen Distler, BSN RNC-NIC, Juanita Dudley, RN BSN, Brianne Georg, BS, Cathy Grisby, RN BSN CCRC, Lacey Haas, RT(MR) CNMT, Karen Harpster, PhD, OT/RL, Lili He, PhD, Scott K. Holland, PhD, V.S. Priyanka Illapani, MS, Kristin Kirker, CRC, Julia E. Kline, PhD, Beth M. Kline-Fath, MD, Hailong Li, PhD, Matt Lanier, RT(MR) RT(R), Stephanie L. Merhar, MD MS, Greg Muthig, BS, Brenda B. Poindexter, MD MS, David Russell, JD, Kari Tepe, BSN RNC-NIC, Leanne Tamm, PhD, Julia Thompson, RN BSN, Jean A. Tkach, PhD, Hui Wang, PhD, Jinghua Wang, PhD, Brynne Williams, RT(MR) CNMT, Kelsey Wineland, RT(MR) CNMT, Sandra Wuertz, RN BSN CCRP, Donna Wuest, AS, Weihong Yuan, PhD.References
1. Novak, I. et al. Early, accurate diagnosis and early intervention in cerebral palsy: Advances in diagnosis and treatment. JAMA Pediatrics (2017). doi:10.1001/jamapediatrics.2017.1689
2. Kline, J. E., Sita Priyanka Illapani, V., He, L. & Parikh, N. A. Automated brain morphometric biomarkers from MRI at term predict motor development in very preterm infants. NeuroImage Clin. (2020). doi:10.1016/j.nicl.2020.102475
3. Bullmore, E. & Sporns, O. Complex brain networks: Graph theoretical analysis of structural and functional systems. Nat. Rev. Neurosci. 10, 186–98 (2009).
4. Rubinov, M. & Sporns, O. Complex network measures of brain connectivity: Uses and interpretations. Neuroimage 52, 1059–69 (2010).
5. Sporns, O. Structure and function of complex brain networks. Dialogues Clin. Neurosci. 15, 247–62 (2013).
6. Young, J. M. et al. Altered white matter development in children born very preterm. Brain Struct. Funct. 223, 2129–2141 (2018).
7. Gozdas, E. et al. Altered functional network connectivity in preterm infants: antecedents of cognitive and motor impairments? Brain Struct. Funct. 223, 3665–3680 (2018).
8. Bouyssi-Kobar, M., De Asis-Cruz, J., Murnick, J., Chang, T. & Limperopoulos, C. Altered Functional Brain Network Integration, Segregation, and Modularity in Infants Born Very Preterm at Term-Equivalent Age. J. Pediatr. 213, 13-21.e1 (2019).
9. Thompson, D. K. et al. Structural connectivity relates to perinatal factors and functional impairment at 7 years in children born very preterm. Neuroimage 134, (2016).
10. Tzourio-Mazoyer, N. et al. Automated anatomical labeling of activations in SPM using a macroscopic anatomical parcellation of the MNI MRI single-subject brain. Neuroimage 15, 273–89 (2002).
11. Shi, F. et al. Infant brain atlases from neonates to 1- and 2-year-olds. PLoS One 6, e18746 (2011).
Figures