2239
General factors of white matter microstructure in the newborn human brain1MRC Centre for Reproductive Health, University of Edinburgh, Edinburgh, United Kingdom, 2Department of Paediatric Radiology, Royal Hospital for Sick Children, Edinburgh, United Kingdom, 3Centre for Clinical Brain Sciences, University of Edinburgh, Edinburgh, United Kingdom, 4Lothian Birth Cohort Studies group, Department of Psychology, University of Edinburgh, Edinburgh, United Kingdom, 5Centre for Inflammation Research, University of Edinburgh, Edinburgh, United Kingdom
Synopsis
Preterm birth associates with diffuse white matter dysmaturation, which is linked to neurocognitive impairment. We applied principal component analysis to tract-averaged diffusion tensor (DTI) and neurite orientation and density imaging (NODDI) measures to derive single- and multimodal general factors describing neonatal white matter microstructure. We report substantial shared variance of DTI and NODDI metrics across 16 white matter tracts and between the different metrics; the derived general factors associate with preterm birth. These results suggest that general factors are efficient markers of generalised white matter microstructure in early life, and are useful for investigating the determinants of white matter development.
Introduction
Preterm birth associates with diffuse white matter (WM) dysmaturation1–3, which motivates the search for efficient whole-brain estimates that capture maturational processes in early life. High correlations of diffusion MRI (dMRI) metrics, obtained from diffusion tensor (DTI) and neurite orientation and density imaging (NODDI) models across WM tracts3–7 have allowed derivation of general factors (g-factors) as measures of global dysconnectivity, and these associate with cognitive ability and age in adulthood6,8. In neonates, DTI-metric-based g-factors explain ~50% of variance in 8 tracts and associate with gestational age at birth2 and cognitive abilities in childhood7. Furthermore, dMRI metrics themselves are correlated, suggesting they share overlapping information3,9,10. A recent study demonstrated that dimensionality reduction of tract-based dMRI data is useful for studying age-related effects in the WM10. Using a neonatal dataset, we aimed to: (1) extend the single-modality g-factor framework in neonates2 to NODDI metrics which are more sensitive to underlying biological changes11,12; (2) investigate shared variance of dMRI metrics by deriving a multimodal g-factor; (3) test the utility of g-factors to classify neonatal data based on gestational age at birth.Methods
Dataset: 164 neonates (Table 1) underwent brain MRI at term-equivalent age as part of the Theirworld Edinburgh Birth Cohort study13. A Siemens MAGNETOM Prisma 3T MRI scanner with 16-channel phased-array paediatric head coil was used to acquire 3D T2-weighted SPACE (voxel size = 1mm isotropic) and axial dMRI with volumes/b = 3/200, 6/500, 64/750 and 64/2500 s/mm2 and 16 non-weighted images (2mm isotropic).Processing: the dMRI volumes were denoised14; eddy current, head movement, EPI geometric distortions15–17, and bias field inhomogeneity18 were corrected. DTI (FA, MD, RD, AD)19,20 and NODDI (neurite density index (NDI), orientation dispersion index (ODI), isotropic volume fraction (ISO))21 maps were obtained. The dMRI images were registered to the ENA50 tensor template22 using DTI-TK23.
Tract segmentation: A set of inclusion and exclusion regions of interest24,25 were used to constrain the whole brain deterministic tensor tractography in the ENA50 neonatal template22 to delineate 16 tracts (Figure 1). The binarized tract images were mapped to subject native space using the DTI-TK-computed transformations; tract-averaged DTI and NODDI metrics were extracted.
Statistical analyses: The tract-averaged metric values were residualised over gestational age at scan. One PCA was conducted for each dMRI metric across the 16 tracts; the first unrotated principal component (PC) scores were extracted (single-metric g-factors). Using a modified framework characterised in a previous study10, a multimodal PCA was conducted pooling all tracts and metrics; the first and second unrotated PC scores were extracted (multimodal g-factors). Group comparisons (full-term vs preterm) with the single-modality g-factors were made using two-sample t-test for normally distributed variables or with the Mann-Whitney U-test; linear mixed effect models were used to test whether the multimodal g-factors differed between term and preterm infants, using subject as the random effect. The single- and multimodal g-factors were then used as predictors in logistic regression models (mixed effects logistic regression for the multimodal g-factors) to discriminate between preterm and full-term infants. Prediction accuracy was measured using a 10-fold cross validation by computing accuracy as the average percentage of correctly classified subjects across the folds.
Results
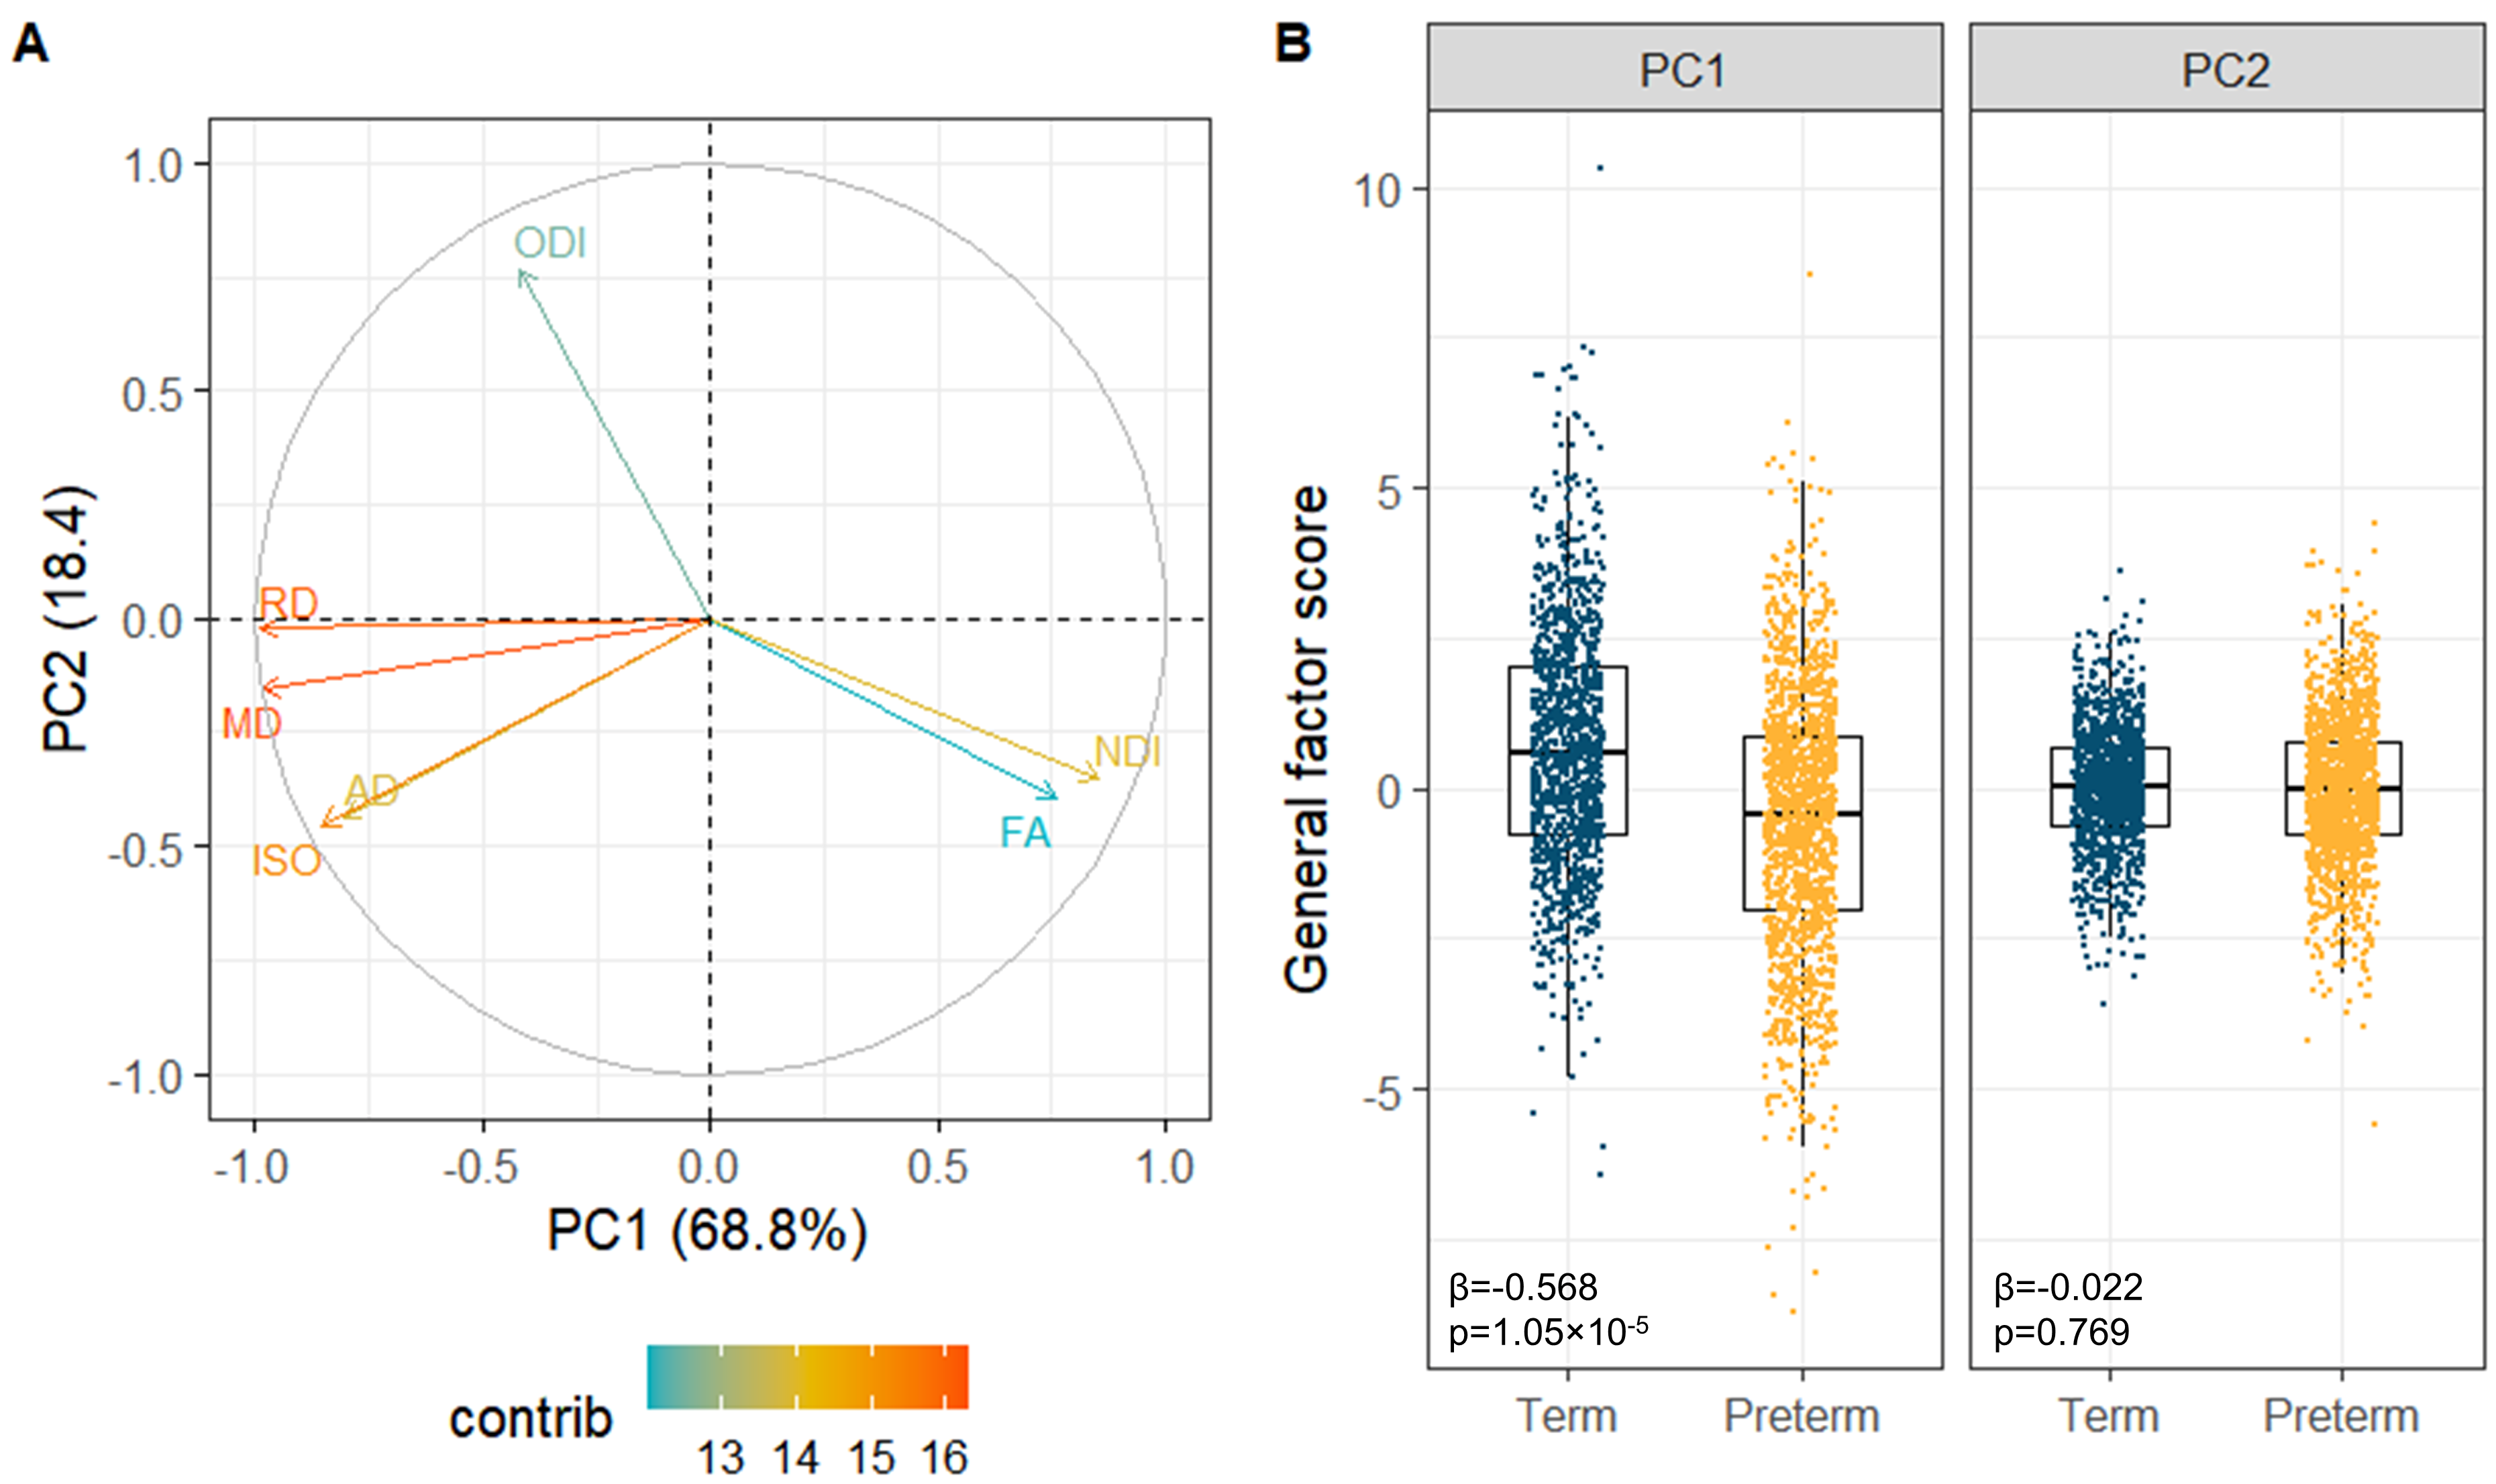
All single-metric PCAs resulted in one component model (Figure 2A): the first PC explained 33.1-68.4% of variance across metrics. gFA and gNDI were significantly lower while other g-factors were significantly higher in preterm compared to full-term infants (Figure 2B).The multimodal PCA revealed that 68.8% of the variability in dMRI metrics across WM tracts is accounted by the first and 18.4% by the second PC. The contributions of the metrics to the PCs are visualised in Figure 3A. The first multimodal g-factor was associated with preterm birth (Figure 3B).
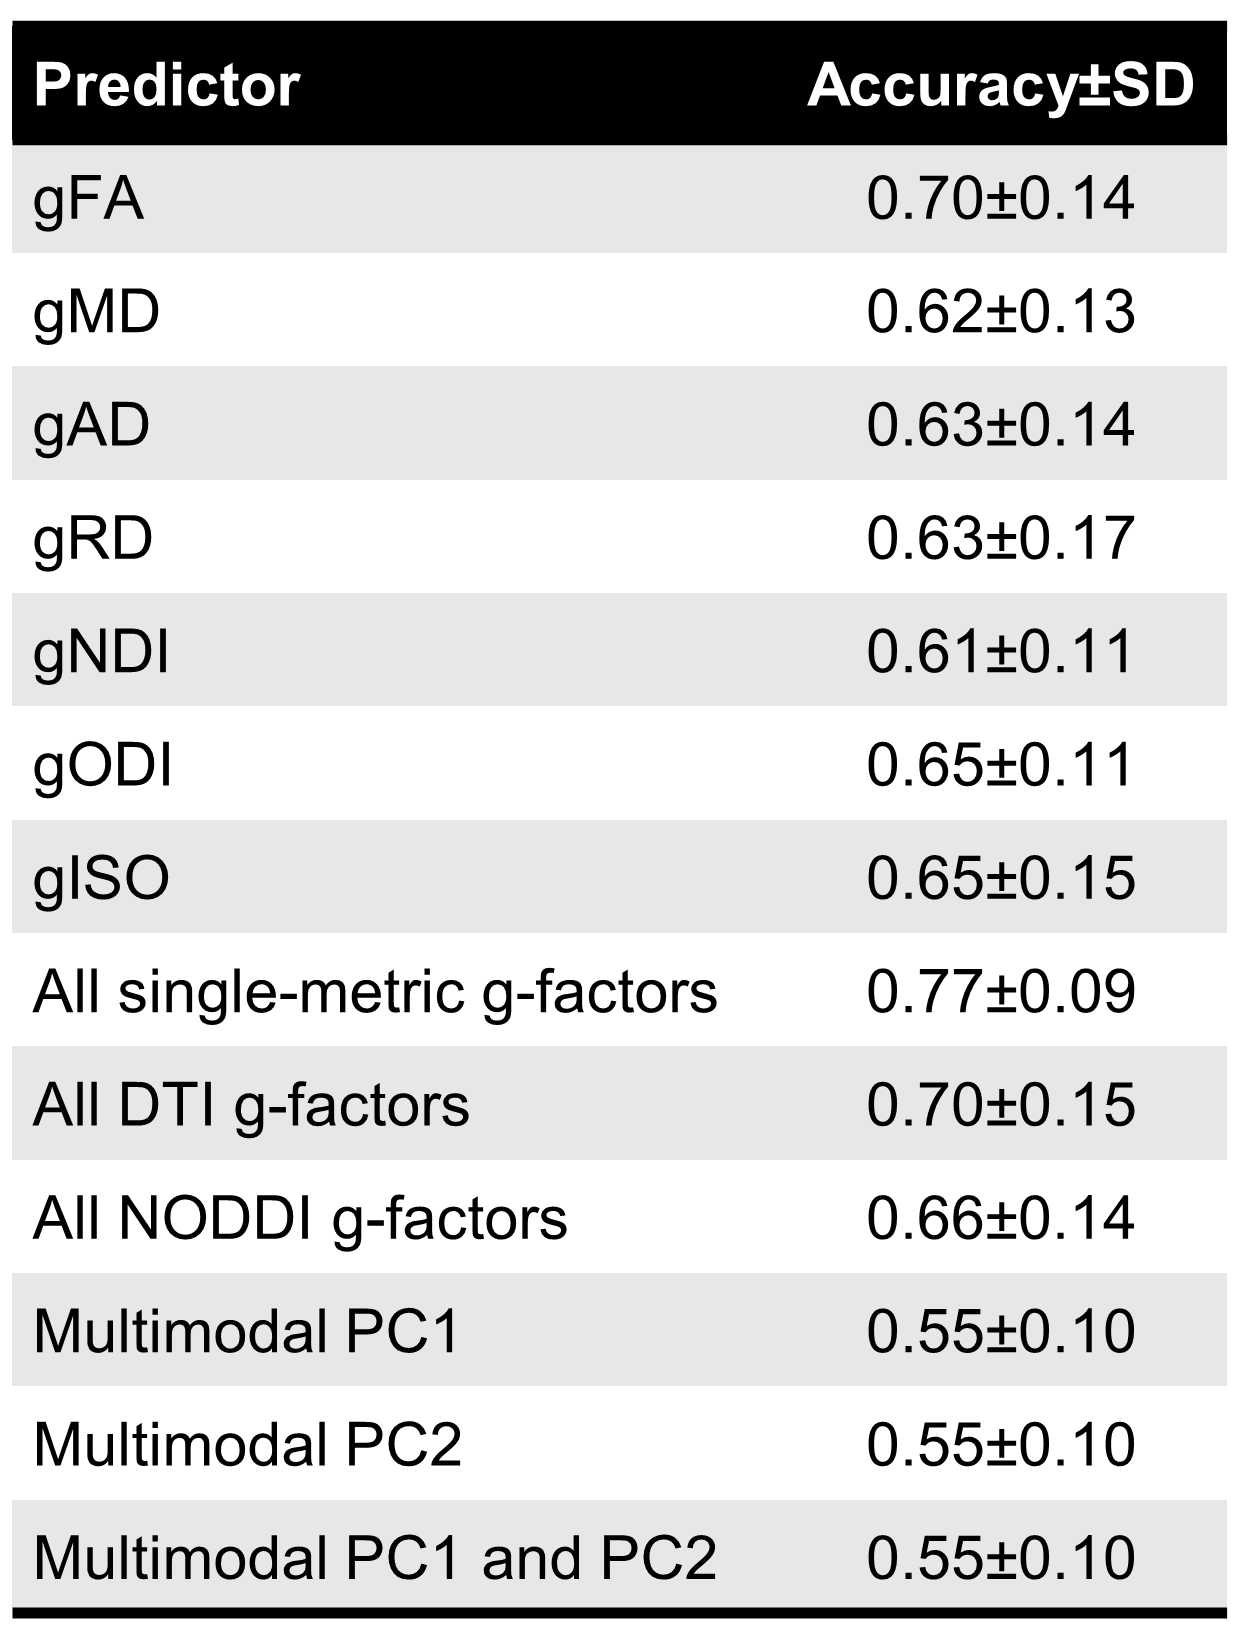
In the preterm versus full-term prediction task, all single-metric g-factors achieved accuracy between 61-70%. The highest classification accuracy was achieved when combining all single-metric g-factors as predictors (77% accuracy), while the models using the multimodal g-factors did not perform higher than chance (Table 2).
Discussion
We demonstrate that similarly to DTI metrics2, in neonates there is substantial shared variance of NODDI metrics across WM tracts. All single-metric g-factors differed between full-term and preterm infants, confirming previous notations of generalised WM dysmaturation in the preterm brain at term-equivalent age. We further demonstrate that considerable proportion of variance is shared across the dMRI metrics in neonates, confirming previous observations in children and adolescents10. We observe that the multimodal g-factor composed of NDI, FA and the water content measures MD, RD and ISO differs between full- and preterm infants. However, in prediction models, the multimodal g-factor is not effective in discriminating full- and preterm group, while the model incorporating all single-metric g-factors achieved the highest accuracy. This implies that despite global covariance of dMRI metrics in neonates, each one carries information on specific aspects of the underlying microstructure that differ in preterm compared to term subjects.Conclusion
By using PCA we have demonstrated substantial shared variance within and between DTI and NODDI metrics across major WM tracts in a neonatal population. The resulting g-factors offer promising whole-brain estimates for studying early life determinants of global WM development.Acknowledgements
We are grateful to the families who consented to take part in the study. This work was supported by Theirworld (www.theirworld.org) and was undertaken in the MRC Centre for Reproductive Health, which is funded by MRC Centre Grant (MRC G1002033). Participants were scanned in the University of Edinburgh Imaging Research MRI Facility at the Royal Infirmary of Edinburgh which was established with funding from The Wellcome Trust, Dunhill Medical Trust, Edinburgh and Lothians Research Foundation, Theirworld, The Muir Maxwell Trust and many other sources. KV is funded by the Wellcome Trust Translational Neuroscience PhD Programme at the University of Edinburgh (108890/Z/15/Z). MJT is supported by NHS Lothian Research and Development Office.References
1 Pecheva D, Kelly C, Kimpton J, Bonthrone A, Batalle D, Zhang H, et al. Recent advances in diffusion neuroimaging: applications in the developing preterm brain 2018;7:1326. doi: 10.12688/f1000research.15073.1.
2 Telford EJ, Cox SR, Fletcher-Watson S, Anblagan D, Sparrow S, Pataky R, et al. A latent measure explains substantial variance in white matter microstructure across the newborn human brain. Brain Struct Funct 2017;222:4023–4033. doi: 10.1007/s00429-017-1455-6.
3 Girault JB, Cornea E, Goldman BD, Knickmeyer RC, Styner M, Gilmore JH. White matter microstructural development and cognitive ability in the first 2 years of life. Hum Brain Mapp 2018;40:1195–210. doi: 10.1002/hbm.24439.
4 Wahl M, Li YO, Ng J, LaHue SC, Cooper SR, Sherr EH, et al. Microstructural correlations of white matter tracts in the human brain. Neuroimage 2010;51:531–41. doi: 10.1016/j.neuroimage.2010.02.072.
5 Mishra V, Cheng H, Gong G, He Y, Dong Q, Huang H. Differences of inter-tract correlations between neonates and children around puberty: a study based on microstructural measurements with DTI. Front Hum Neurosci 2013;7:721. doi: 10.3389/fnhum.2013.00721.
6 Cox SR, Ritchie SJ, Tucker-Drob EM, Liewald DC, Hagenaars SP, Davies G, et al. Ageing and brain white matter structure in 3,513 UK Biobank participants. Nat Commun 2016;7:1–13. doi: 10.1038/ncomms13629.
7 Lee SJ, Steiner RJ, Yang Y, Sarah JS, Michael CN, Martin AS, et al. Common and heritable components of white matter microstructure predict cognitive function at 1 and 2 y. Proc Natl Acad Sci U S A 2017;114:148–53. doi: 10.1073/pnas.1604658114.
8 Penke L, Maniega SM, Murray C, Gow AJ, Valdés Hernández MC, Clayden JD, et al. A general factor of brain white matter integrity predicts information processing speed in healthy older people. J Neurosci 2010;30:7569–74. doi: 10.1523/JNEUROSCI.1553-10.2010.
9 De Santis S, Drakesmith M, Bells S, Assaf Y, Jones DK. Why diffusion tensor MRI does well only some of the time: Variance and covariance of white matter tissue microstructure attributes in the living human brain. Neuroimage 2014;89:35–44. doi: 10.1016/j.neuroimage.2013.12.003.
10 Chamberland M, Raven EP, Genc S, Duffy K, Descoteaux M, Parker GD, et al. Dimensionality reduction of diffusion MRI measures for improved tractometry of the human brain. Neuroimage 2019;200:89–100. doi: 10.1016/j.neuroimage.2019.06.020.
11 Grussu F, Schneider T, Tur C, Yates RL, Tachrount M, Ianuş A, et al. Neurite dispersion: a new marker of multiple sclerosis spinal cord pathology? Ann Clin Transl Neurol 2017;4:663–79. doi: 10.1002/acn3.445.
12 Batalle D, O’Muircheartaigh J, Makropoulos A, Kelly CJ, Dimitrova R, Hughes EJ, et al. Different patterns of cortical maturation before and after 38 weeks gestational age demonstrated by diffusion MRI in vivo. Neuroimage 2019;185:764–75. doi: 10.1016/j.neuroimage.2018.05.046.
13 Boardman JP, Hall J, Thrippleton MJ, Reynolds RM, Bogaert D, Davidson DJ, et al. Impact of preterm birth on brain development and long-term outcome: protocol for a cohort study in Scotland. BMJ Open 2020;10:35854. doi: 10.1136/bmjopen-2019-035854.
14 Veraart J, Novikov DS, Christiaens D, Ades-aron B, Sijbers J, Fieremans E. Denoising of diffusion MRI using random matrix theory. Neuroimage 2016;142:394–406. doi: 10.1016/j.neuroimage.2016.08.016.
15 Andersson JLR, Sotiropoulos SN. An integrated approach to correction for off-resonance effects and subject movement in diffusion MR imaging. Neuroimage 2016;125:1063–78. doi: 10.1016/j.neuroimage.2015.10.019.
16 Andersson JLR, Graham MS, Zsoldos E, Sotiropoulos SN. Incorporating outlier detection and replacement into a non-parametric framework for movement and distortion correction of diffusion MR images. Neuroimage 2016;141:556–72. doi: 10.1016/j.neuroimage.2016.06.058.
17 Andersson JLR, Graham MS, Drobnjak I, Zhang H, Filippini N, Bastiani M. Towards a comprehensive framework for movement and distortion correction of diffusion MR images: Within volume movement. Neuroimage 2017;152:450–66. doi: 10.1016/j.neuroimage.2017.02.085.
18 Tustison NJ, Avants BB, Cook PA, Zheng Y, Egan A, Yushkevich PA, et al. N4ITK: Improved N3 bias correction. IEEE Trans Med Imaging 2010;29:1310–20. doi: 10.1109/TMI.2010.2046908.
19 Basser PJ, Mattiello J, LeBihan D. MR diffusion tensor spectroscopy and imaging. Biophys J 1994;66:259–67. doi: 10.1016/S0006-3495(94)80775-1.
20 Jenkinson M, Beckmann CF, Behrens TEJ, Woolrich MW, Smith SM. FSL. Neuroimage 2012;62:782–90. doi: 10.1016/j.neuroimage.2011.09.015.
21 Zhang H, Schneider T, Wheeler-Kingshott CA, Alexander DC. NODDI: Practical in vivo neurite orientation dispersion and density imaging of the human brain. Neuroimage 2012;61:1000–16. doi: 10.1016/j.neuroimage.2012.03.072.
22 Blesa M, Galdi P, Sullivan G, Wheater EN, Stoye DQ, Lamb GJ, et al. Peak Width of Skeletonized Water Diffusion MRI in the Neonatal Brain. Front Neurol 2020;11:235. doi: 10.3389/fneur.2020.00235.
23 Zhang H, Yushkevich PA, Alexander DC, Gee JC. Deformable registration of diffusion tensor MR images with explicit orientation optimization. Med Image Anal 2006;10:764–85. doi: 10.1016/j.media.2006.06.004.
24 Wakana S, Caprihan A, Panzenboeck MM, Fallon JH, Perry M, Gollub RL, et al. Reproducibility of quantitative tractography methods applied to cerebral white matter. Neuroimage 2007;36:630–44. doi: 10.1016/j.neuroimage.2007.02.049.
25 Pecheva D, Yushkevich P, Batalle D, Hughes E, Aljabar P, Wurie J, et al. A tract-specific approach to assessing white matter in preterm infants. Neuroimage 2017;157:675–94. doi: 10.1016/j.neuroimage.2017.04.057.
Figures