2236
Ultra-high field MR spectroscopic imaging at 7 Tesla in Multiple Sclerosis: myo-Inositol as early biomarker for MS pathologies1High Field MR Centre, Department of Biomedical Imaging and Image-guided Therapy, Medical University of Vienna, Vienna, Austria, 2Christian Doppler Laboratory for Clinical Molecular MR Imaging, Vienna, Austria, 3Department of Neurology, Medical University of Vienna, Vienna, Austria, 4Jessenius Faculty of Medicine in Martin, Comenius University, Bratislava, Slovakia
Synopsis
Routine T1/T2-weighted magnetic resonance imaging (MRI) is the method of choice for diagnosis and treatment monitoring of Multiple Sclerosis (MS), but is not being able to map the underlying pathological processes. In contrast to T1/T2-lesions which represent the general macroscopic tissue damage, MR Spectroscopic Imaging (MRSI) can detect pathologies on a biochemical level. In 54 relapsing-remitting (RRMS) patients and 16 healthy age/sex-matched controls, we show - enabled through ultra-high resolution Free Induction Decay(FID)-MRSI at 7T - the metabolic distribution within lesions and their close proximity as well as the importance of myo-Inositol as an imaging biomarker in early lesion development.
Introduction
Routine T1/T2-weighted MRI has become the method of choice for diagnosis and treatment monitoring of Multiple Sclerosis (MS) lesions, but is unable to map the underlying pathological processes. In contrast to T1/T2-lesions which represent the general macroscopic tissue damage, MR Spectroscopic Imaging (MRSI) can detect pathologies on a biochemical level.FID-MRSI[1-2] has enabled us to measure subjects in a clinically feasible scan time of ~6min and has shown that especially decreased N-acetylaspartate(NAA) caused by axonal loss, elevated myoInositol(mIns) due to inflammation followed by glial activation and decreased creatine(Cr) by mitochondrial dysfunction are the main metabolic hallmarks in MS lesions[3-4].
The study’s objective was to categorize different lesion groups by their appearance on T1/T2-weighted images and (1) compare these groups in terms of metabolic changes, (2) investigate whether the concentration of metabolites was equally distributed over the whole lesion and its’ close vicinity and (3) examine possible correlations between the different lesion groups and their respective absolute T1 values.
Materials and Methods
After approval of the institutional review board, 54 RRMS patients (32 female/22 male; age 35.43 ± 9.65 years) and 16 age/sex-matched healthy controls (9 female/7 male; age 34.13 ± 9.89 years) were scanned using a 7T whole-body MR scanner (Magnetom; Siemens Healthcare, Erlangen, Germany) and a 32-channel head coil (NovaMedical, Wilmington, MA).Prior to spectroscopic data collection, routine 3D-MRI including T1-weighted MP2RAGE images with a voxel size of 0.8mm3 isotropic and T2-weighted 3D FLAIR images with a voxel size of 0.86mm3 isotropic were obtained.
FID-MRSI was performed with TR/acquisition delay(AD) 200/1.3ms; FOV 220×220mm²; matrix size 100×100; 8mm slice thickness; 29° flip angle; 3kHz spectral bandwidth; 1024 samples; WET water suppression; 4-fold 2D-CAIPIRINHA acceleration; 6:06min scan time[5].
Inhouse developed MATLAB post-processing was performed including MUSICAL coil combination[2], 2D-CAIPIRINHA reconstruction[5], spatial Hamming filtering and lipid signal removal via L2-regularization[6]. Within LCModel the spectral range of 1.8 to 4.2 ppm was fitted using a basis-set consisting of 17 metabolites and a measured macromolecule background[7] . Maps of metabolite levels and their ratios, quantification precision (Cramer-Rao Lower Bounds(CRLBs)) and spectral quality(SNR, linewidth) were created.
After resampling MP2RAGE images to slices matching the respective MRSI slice, ROIs were segmented manually using ITK-SNAP. Lesions were categorized as “black hole” (BH; hypointense on MP2RAGE & hyperintense on FLAIR), “non black hole” (nonBH; hypointense on MP2RAGE & not visible on FLAIR) or “MRSI hotspot” (hyperintense on Ins/tNAA, but neither on MP2RAGE nor FLAIR). Additionally, representative ROIs of normal appearing white matter (NAWM) in patients, as well as normal white matter (NWM) in healthy controls were segmented.
All BH and nonBH lesions were eroded/dilated 3 times using MINC, resulting in 7 lesion layer rings and were corrected for intruding grey matter or cerebrospinal fluid using lesion-free masks created in Freesurfer and MINC (figure 4 A).
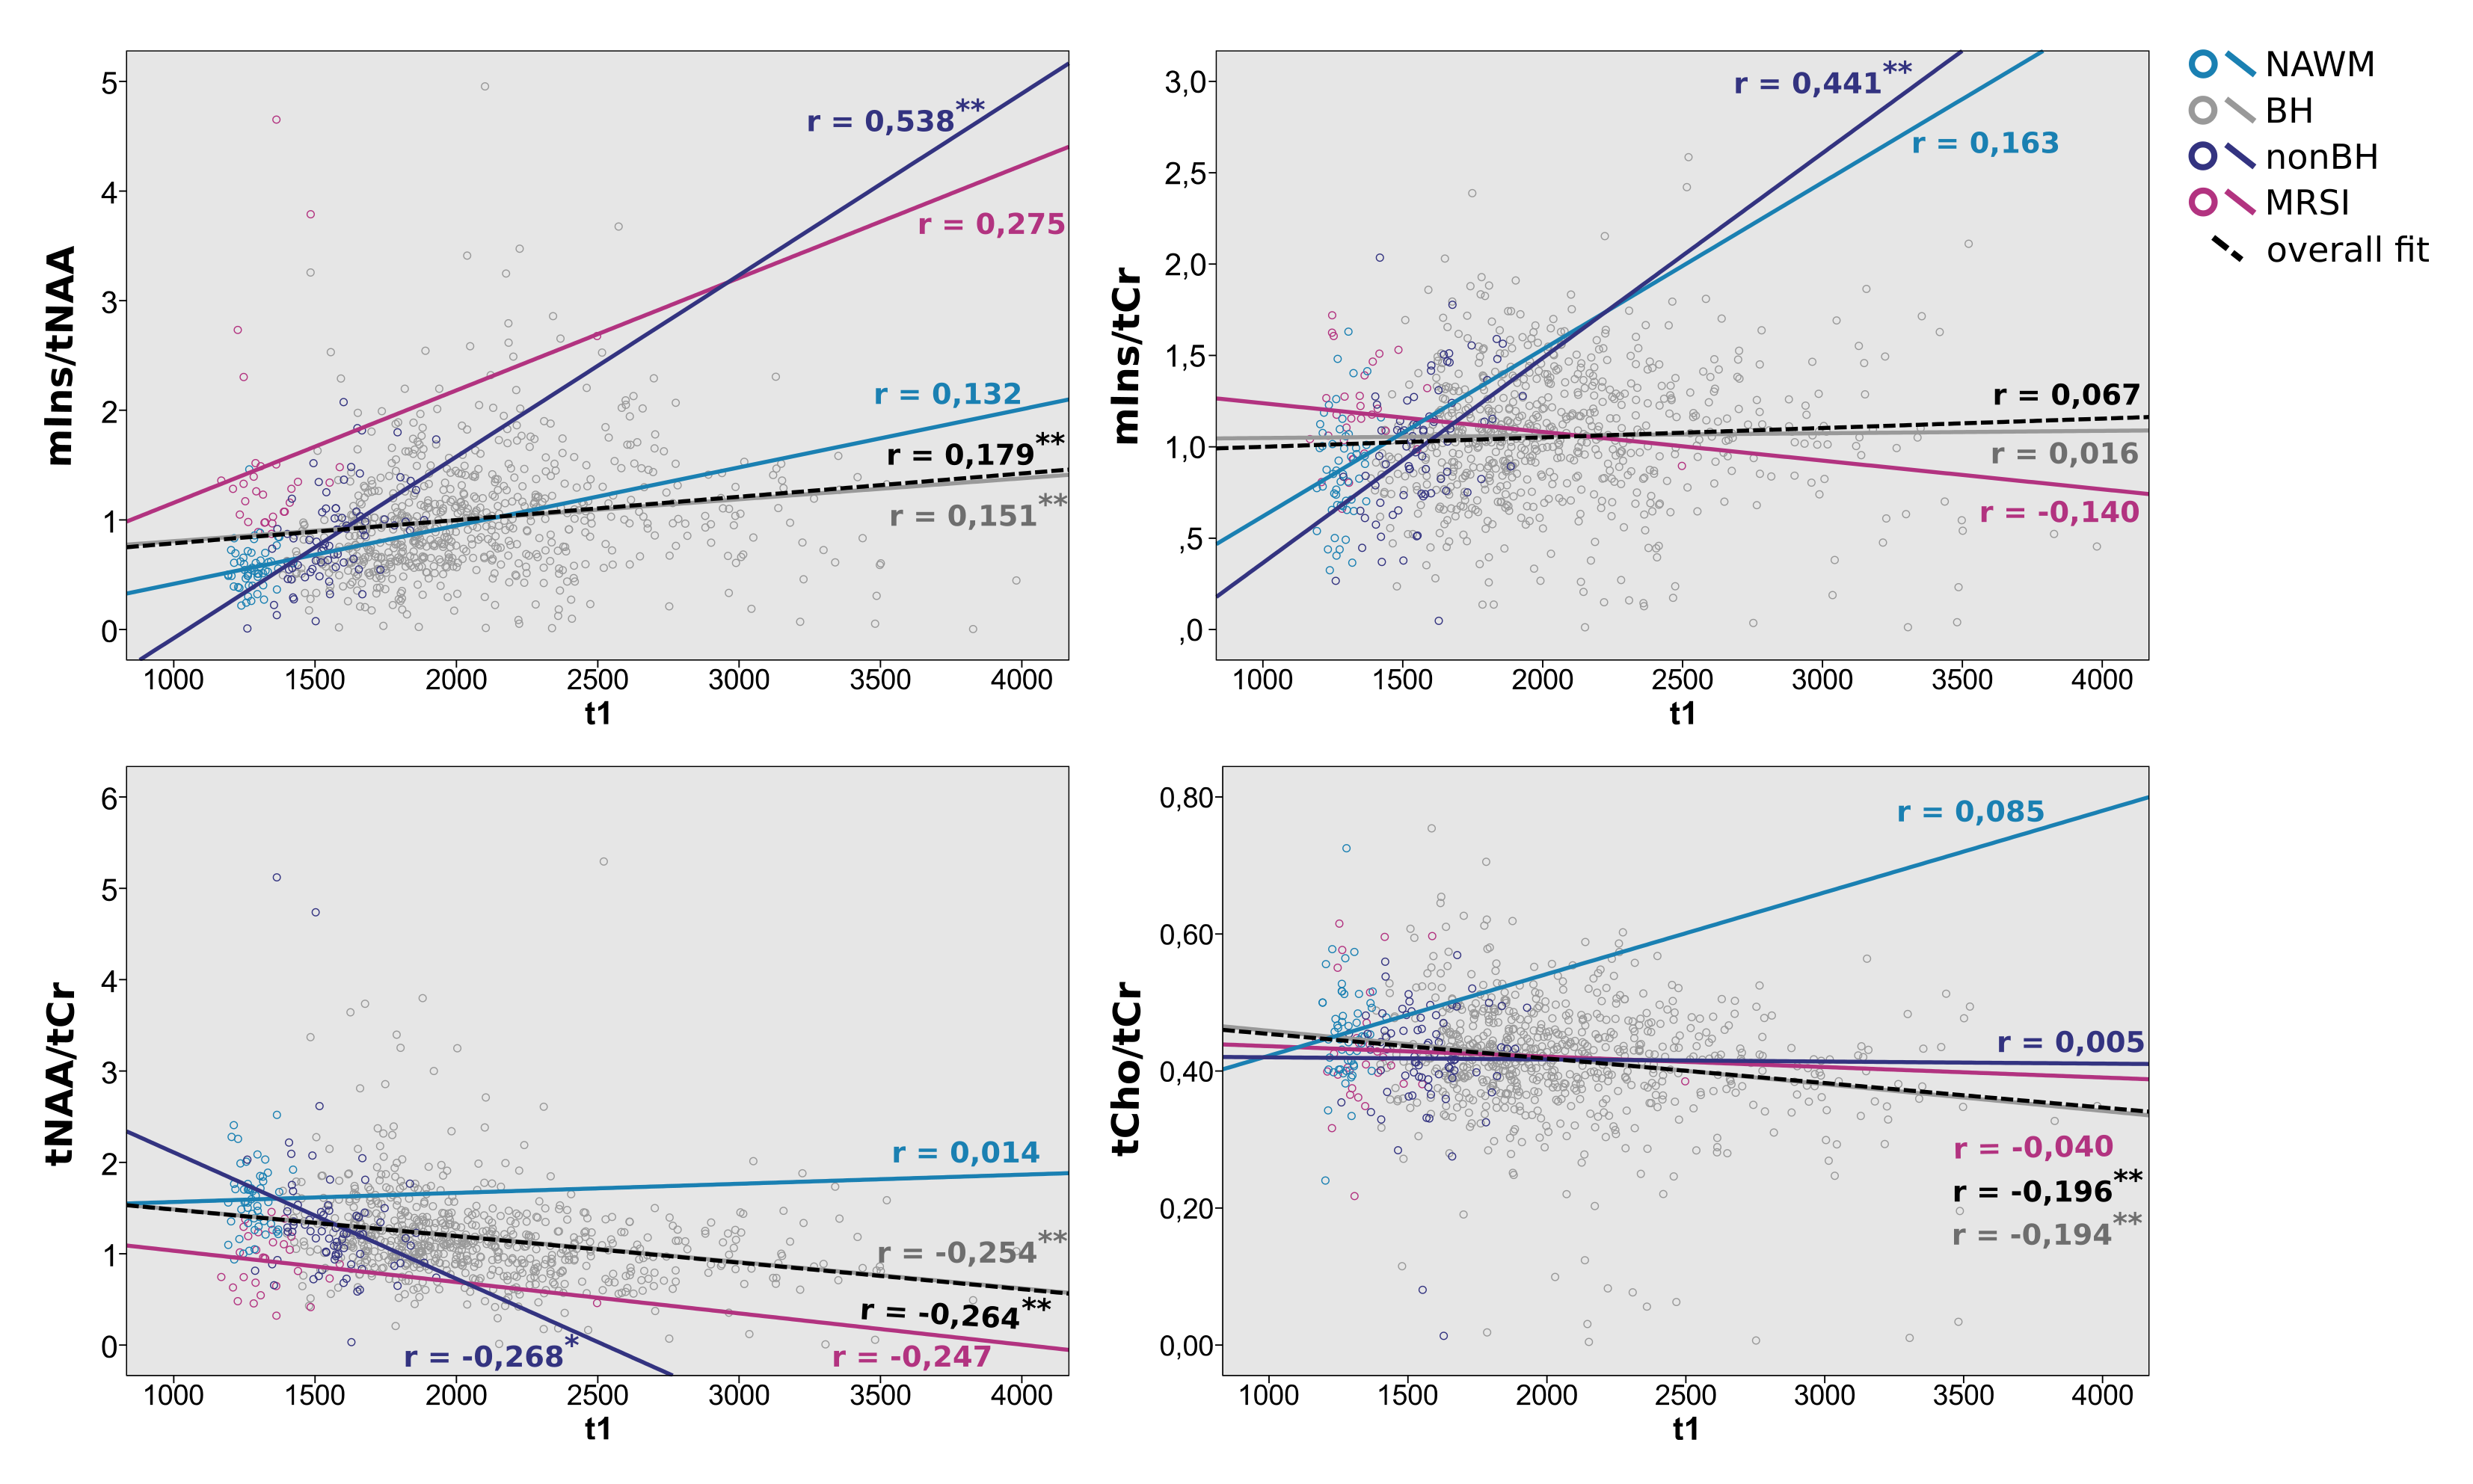
The mean metabolic ratio values of Ins/tNAA, Ins/tCr, tNAA/tCr and tCho/tCr for each ROI were determined using MINC. Additionally, absolute T1 values were obtained from MP2RAGE images in order to correlate to metabolite concentrations.
One-Way ANOVA including Tukey Post Hoc analysis with a significance threshold set to P = 0.05 and a 2-tailed Pearson Correlation with P = 0.05 were performed using IBM SPSS Statistics 24.
Results
High quality metabolic maps of mIns/tNAA, mIns/tCr, tNAA/tCr and tCho/tCr were obtained. There was no significant metabolic difference between NWM and NAWM for any of the metabolic ratios (Figure 1). Highly significant results could be found for mIns/tNAA, mIns/tCr and tNAA/tCr with an increase of mIns/tNAA and mIns/tCr from NWM/NAWM over nonBH and BH (Figure 1 & 2) up to MRSI hotspot lesions (Figure 1 & 3) and a respective decrease of tNAA/tCr. Looking into the different lesion layers, again significant changes could be found for mIns/tNAA, mIns/tCr and tNAA/tCr (Figure 4). Correlating metabolic ratios and T1 values (Figure 5), most of the significant correlations were present in nonBH lesions, showing the strongest significant correlations for mIns/tNAA. Taken together these results suggest that mIns/tNAA is the best discriminator for MS abnormalities.Discussion
Combining the full sensitivity signal detection of FID-MRSI and the advantages of increased spatial and spectral resolution at 7T allowed metabolic mapping of a neurochemical profile of well-delineated MS lesions including metabolites like mIns, which are crucial to understand the underlying biochemical processes.Previous studies have shown mIns and tNAA to be driving forces behind metabolic changes in NAWM of MS patients[8], which is again supported by our findings, though adding four remarkable findings:
- Overall mIns concentration was strongly positively correlated with T1 in “non black hole” lesions and changes in mIns were already found before tNAA changes, suggesting that mIns increases might trigger changes in tNAA concentration and are therefore the driving force for lesions to become visible on routine MRI
- hotspots on MRSI could represent an initial metabolic burst attributed especially to mIns, not yet following the above described correlation
- NAWM, after excluding MRSI hotspots, shows no significant metabolic difference to NWM
- in “black hole” lesions metabolic concentrations and T1 values do not correlate. Furthermore, the lesion centers are still metabolically active, suggesting that they do not just represent scar tissue.
Conclusion
FID-MRSI enables a comprehensive biochemical characterization of lesions and strengthens the role of mIns/tNAA as an imaging biomarker for MS pathologies.Acknowledgements
No acknowledgement found.References
[1] Hangel et al., Neuroimage 2016 [Epub]; doi: 10.1016/j.neuroimage.2016.10.043
[2] Strasser et al., NMR in Biomed 2013; 10.1002/nbm.3019
[3] Heckova et al., Investigative Radiology 2019; doi: 10.1097/RLI.0000000000000531
[4] Saija et al., Neuroimaging Clin N.Am 2009; doi: 10.1016/j.nic.2008.08.002.
[5] Strasser et al., MRM 2017; doi: 10.1002/mrm.26386
[6] Bilgic et al., JMRI 2014; doi: 10.1002/jmri.24365
[7] Povazan et al., Neuroimage 2015; doi: 10.1016/j.neuroimage.2015.07.042
[8] Fernando et al., Brain 2004; doi: 10.1093/brain/awh153
Figures
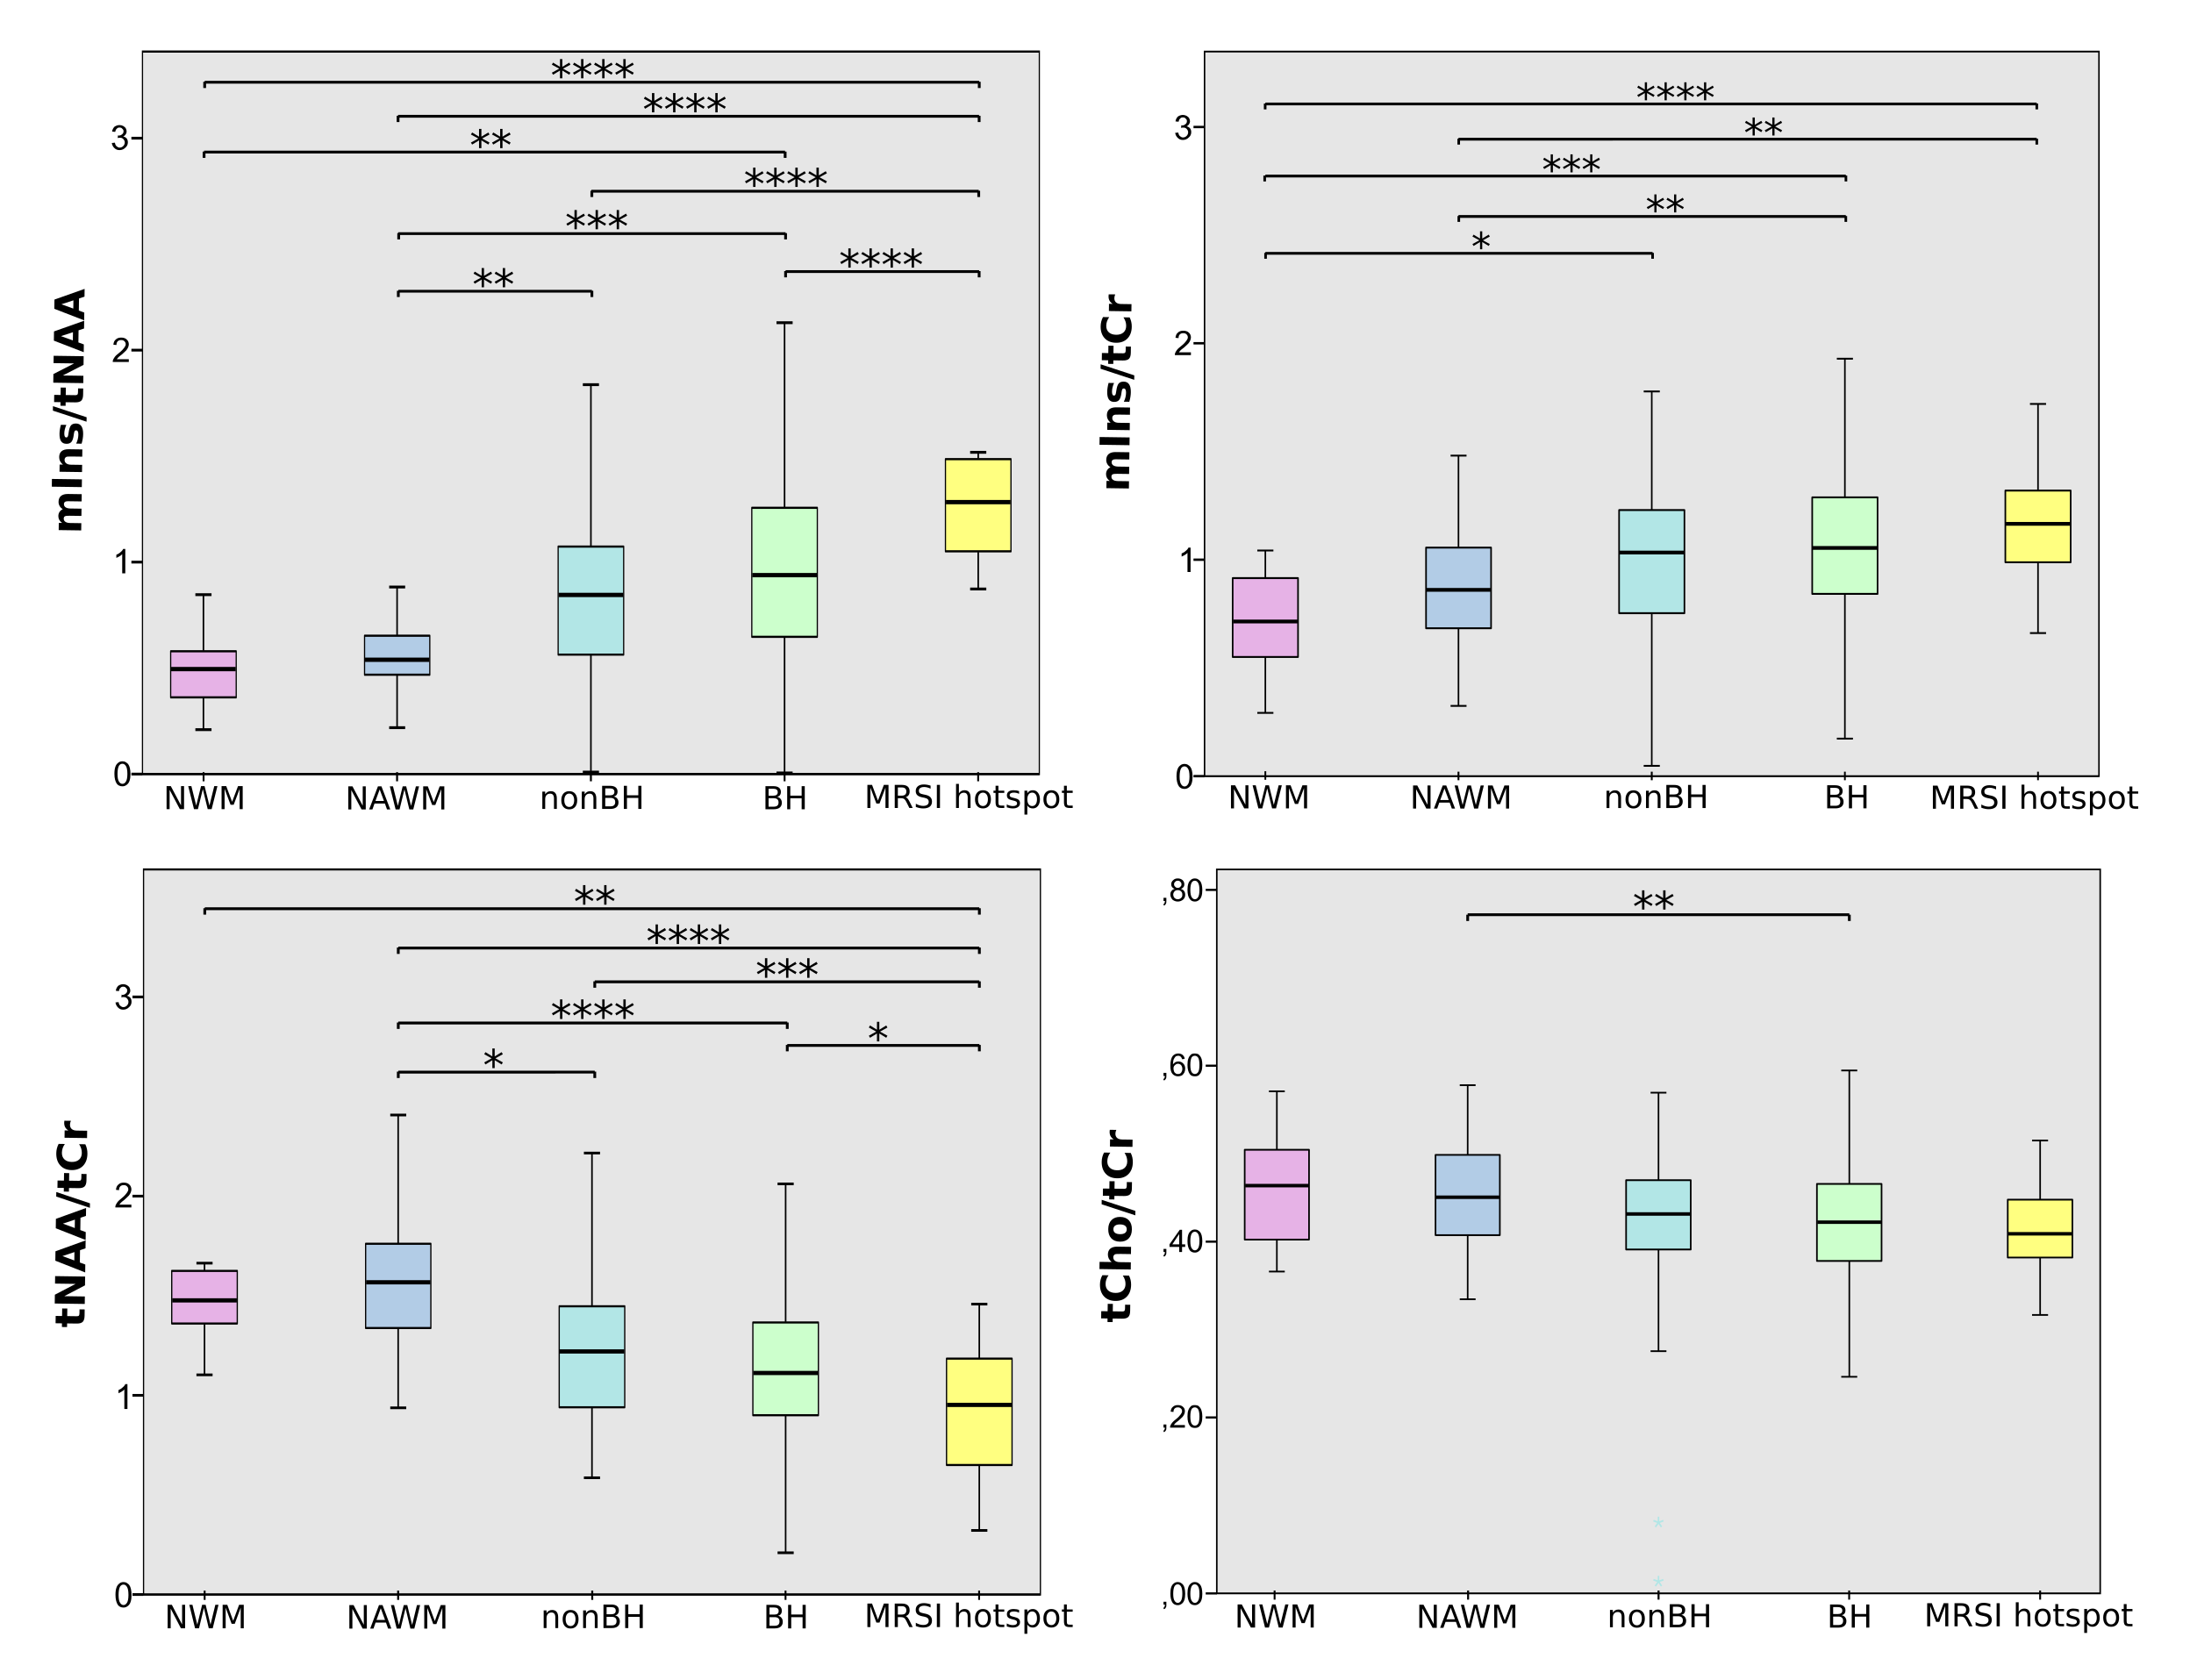
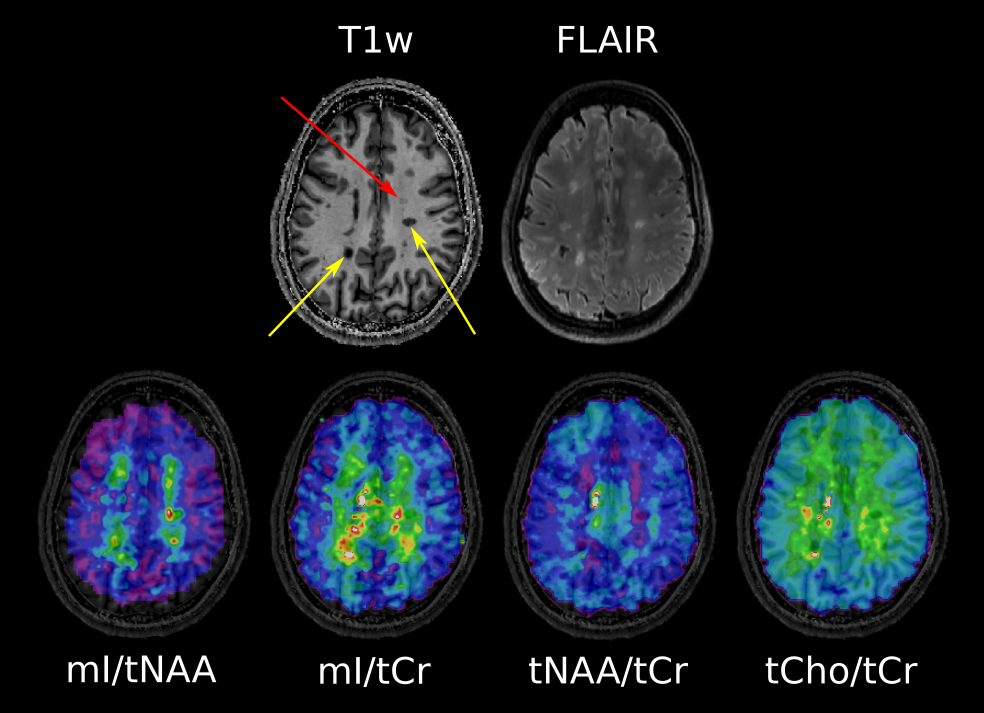
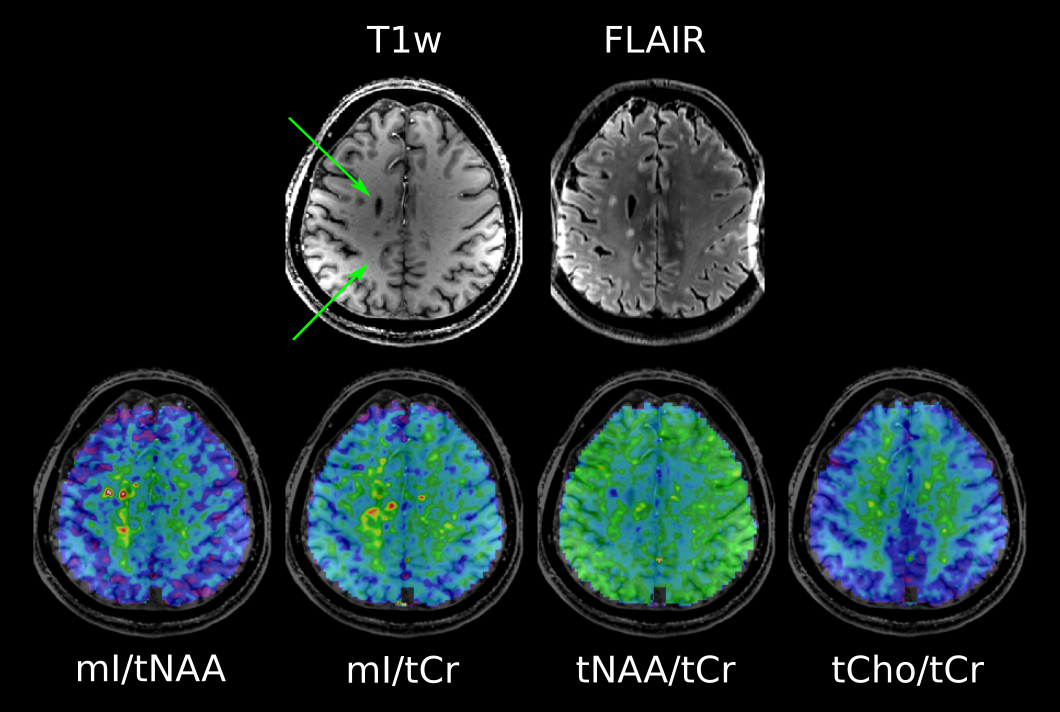
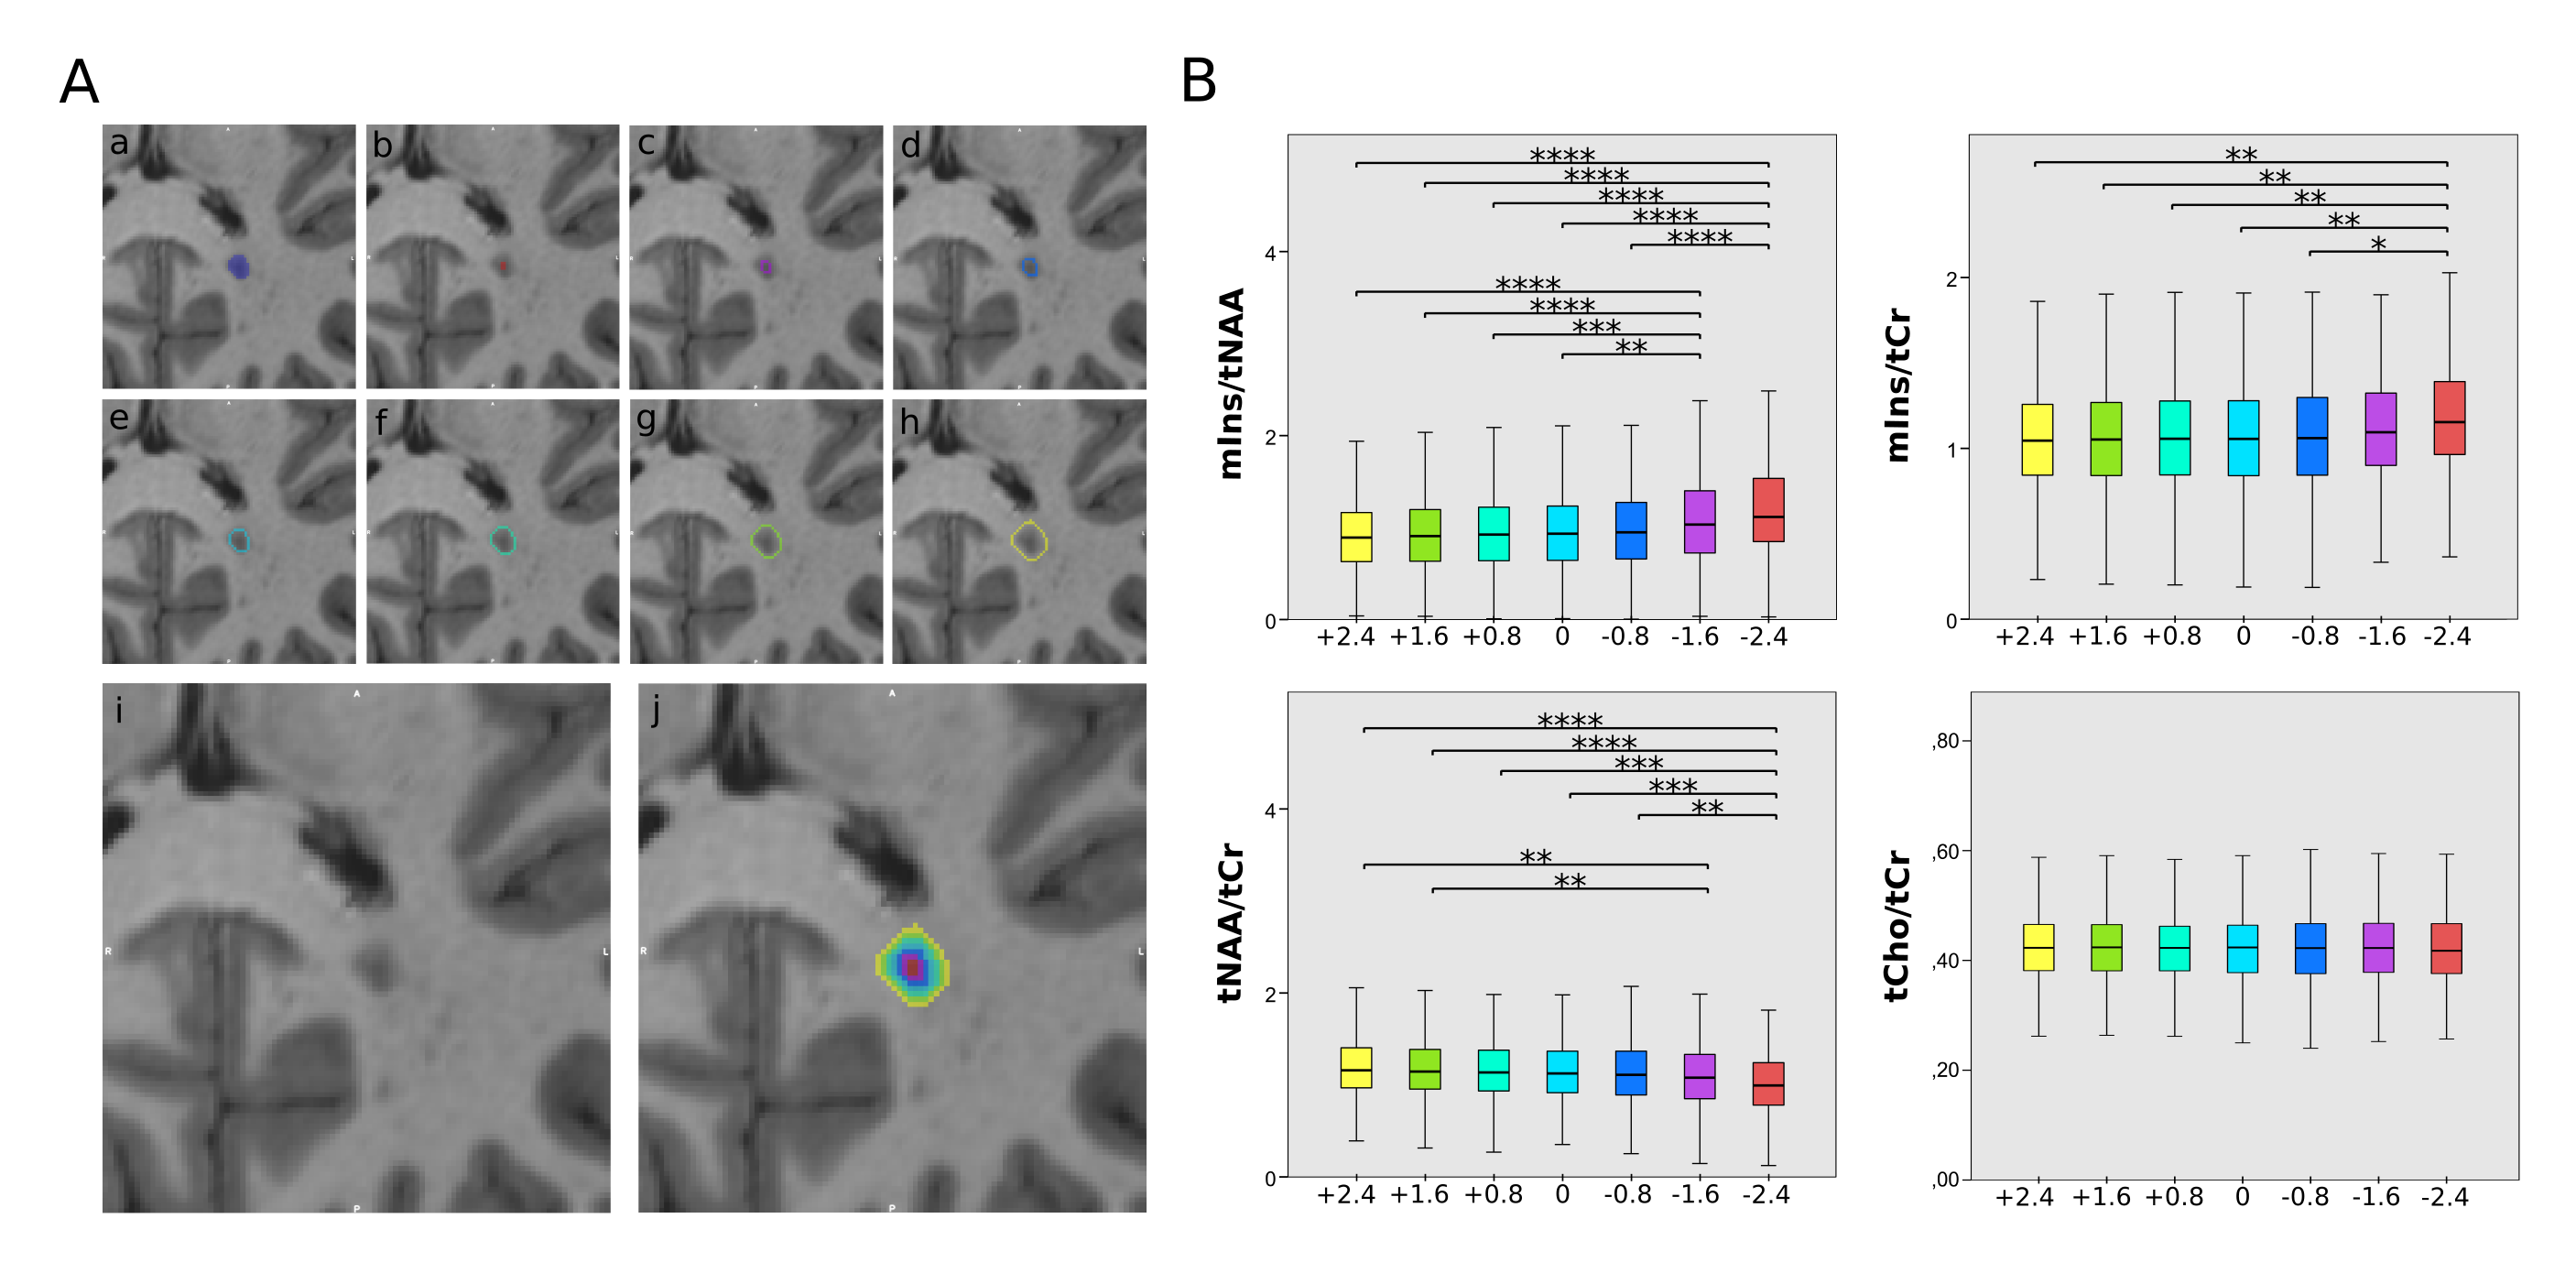
Figure 4:
A: lesion
layers with (a) being the originally segmented lesion, (b)-(h)
depicting the 7 lesion layer rings, while (i) shows the MP2RAGE
lesion itself and (j) all rings overlaid on top of it.
B: boxplot diagram for mIns/tNAA, mIns/tCr, tNAA/tCr and tCho/tCr that show significant differences in metabolite concentrations between the lesion layers for mIns/tCr, tNAA/tCr and especially mIns/tNAA