2235
A time course of the glutamate+glutamine level in response to a short visual stimulus1Clinical and Research Institute of Emergency Pediatric Surgery and Trauma, Moscow, Russian Federation, 2N.N.Semenov Federal research center of Chemical Physics Russian Academy of Sciences, Moscow, Russian Federation, 3N.M. Emanuel Institute of Biochemical Physics RAS, Moscow, Russian Federation, 4Philips Healthcare, Moscow, Russian Federation
Synopsis
Changes in the concentration of neurotransmitters in response to a short (or event-related) stimulus in not well investigated. Due to low neurotransmitter cycle rates, these changes can be related to neurotransmitter release from vesicles. In this work, we measured a time course of Glx level in response to a short visual stimulus in a period exceeding the BOLD response using 3T MR scanner. This Glx level dynamic is considered as the release of Glu from the vesicles, reuptake, and refilling. For the first time, we investigated the dynamics of the BOLD-effect using the metabolic signal.
Introduction
Proton magnetic resonance spectroscopy (1H-MRS) allows in-vivo measurement of neurotransmitter concentrations (such as GABA and glutamate (Glu)) in humans. Few studies explore metabolic responses to event-related stimuli [1,2,3,4] and in those works, some variations [Glu] revealed in a short period were considered as neurotransmitter release rather than metabolic changes. The present study aimed to investigate kinetics of glutamate release and vesicles refilling. We measured the time course of Glu concentration in response to a short visual stimulus in a period exceeding the BOLD response.Methods
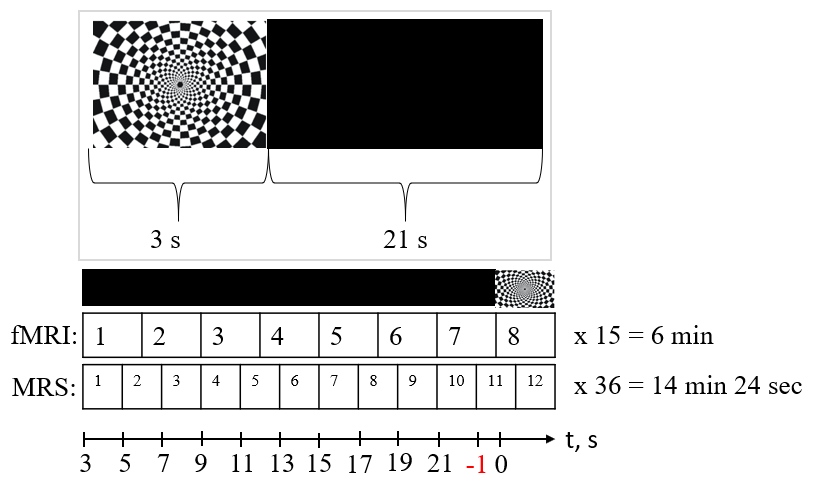
MR images and single voxel 1H-MRS were acquired on a Philips Achieva dStream 3T MRI System (Eindhoven, Netherlands) using a SENSE Head-8 coil. Eighteen healthy subjects (11 males; mean age = 23.6 years, SD = 2.2) took part in the study. The 4 Hz flashing checkerboard was used for stimulation in similar blocks (3s - stimulus, 21s -black screen) (fig.1).To find activation volume images were acquired using gradient-echo echo-planar imaging (GE EPI) sequence with TR/TE = 3000/40 ms, flip angle =90°, in‐plane resolution =2.4 × 2.4 mm2, slice thickness = 4 mm, number of slices =30 and 120 measurements.
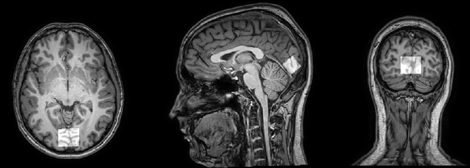
The fMRI data were processed using the SPM12 software package. Statistical analysis of the images was performed using GLM. As a result, an activation map was obtained in response to visual stimulation. Spectral voxel volume was obtained and the average intensity in the volume was defined for each participant.
During the experiment activated region was found using iViewBOLD (tomograph software) to localize spectroscopic voxel. The spectra were obtained using the PRESS sequence (TR=2000 ms, TE=35ms, NSA=444 (12*37), voxel size - 20x30x20mm) and were localized in the activated region of the visual cortex (fig.2). Spectra were frequency and phase corrected, averaged within time points to produce spectra for dynamic of metabolite levels after the short stimulus. We identified the impact of BOLD effects in metabolite spectra by estimating the differences in total creatine (tCr) singlet (3.03 ppm) linewidth between each time point and the value at -1s (1 sec before the start presentation of the stimulus, fig. 1). To correct for the BOLD effect, metabolite spectra corresponding to each time point were line broadened by the difference in tCr line width at this time point. Metabolites were quantified using LCModel with a basis set of 17 simulated metabolites. For further statistical processing, the signal intensity ratio of Glx/Cr and NAA/Cr was obtained.
The difference between the obtained values (Glx/Cr, NAA/Cr, and linewidth of tCr) corresponding to individual time points was statistically determined by repeated measures of ANOVA statistical test. Greenhouse-Geisser corrections were utilized to adjust for violations of the sphericity assumption. Post hoc Dunnett's test was then run. Сorrelation coefficient between Glx/Cr at 1s and fMRI-amplitude was assessed.
Results
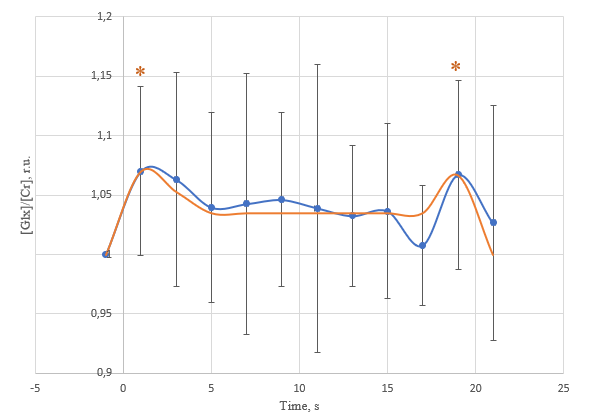
We found a statistically significant difference in the ratio of Glx/Cr intensities (p=0,031, fig.3) between time points by rANOVA. Post-hoc Dunnett's test (fig. 3) showed a statistically significant Glx/Cr increase from -1 s to 1s (+0.17±0.04, p = 0.004), 3s (+0.15±0.05, p = 0.074), 19s (+0.16±0.04, p=0.013). Line width of tCr measurement showed a statistically significant line narrowing at 7s (-4,6±1,0%, p = 0,002). There is no correlation between spectral data and amplitude of fMRI-response (r = 0,24, P>0,05). The inter-subject analysis of GLX/Cr level over three consecutive periods (each period corresponded ~5 min) of the study showed that there are no concentration changes (rANOVA: p=0.32).Discussion
We investigated changes in Glx level in a period exceeding the BOLD response. At least two periods of growth of Glx/Cr ratio were revealed. As Glu-Gln cycle rate is too small for these Glx/Cr changes, the observed Glx/Cr time course can be considired to the release of Glu from the vesicles, reuptake, and refilling. The rate of Glu refilling into synaptic vesicles at an intact mammalian central synapse is estimated as 1/15 s-1. Around 80% of the initial Glu vesicle concentration would be transported into a vesicle within 20s. This value is close to our estimate.Our work presents dynamic measurement of BOLD effects in metabolite spectra using the tCr signal for the first time.
Acknowledgements
No acknowledgement found.References
1. Lally, N., Mullins, P. G., Roberts, M. V., Price, D., Gruber, T., & Haenschel, C. (2014). Glutamatergic correlates of gamma-band oscillatory activity during cognition: A concurrent ER-MRS and EEG study. NeuroImage, 85, 823-833.
2. Cleve, M., Gussew, A., & Reichenbach, J. R. (2015). In vivo detection of acute pain-induced changes of GABA+ and Glx in the human brain by using functional 1H MEGA-PRESS MR spectroscopy. Neuroimage, 105, 67-75.
3. Gussew, A., Rzanny, R., Erdtel, M., Scholle, H. C., Kaiser, W. A., Mentzel, H. J., & Reichenbach, J. R. (2010). Time-resolved functional 1H MR spectroscopic detection of glutamate concentration changes in the brain during acute heat pain stimulation. Neuroimage, 49(2), 1895-1902.
4. Apšvalka, D., Gadie, A., Clemence, M., & Mullins, P. G. (2015). Event-related dynamics of glutamate and BOLD effects measured using functional magnetic resonance spectroscopy (fMRS) at 3 T in a repetition suppression paradigm. Neuroimage, 118, 292-300.
5. Hori, T., & Takahashi, T. (2012). Kinetics of synaptic vesicle refilling with neurotransmitter glutamate. Neuron, 76(3), 511-517.
Figures