2233
On the repeatability and reproducibility of SPECIAL-based in-vivo spectroscopy with different adiabatic inversion pulses1Physikalisch-Technische Bundesanstalt (PTB), Braunschweig und Berlin, Germany, 2Center for Stroke Research Berlin, Charité Universitätsmedizin, Berlin, Germany
Synopsis
This work assesses the test-retest repeatability and reproducibility of spectral shapes and neurochemical profiles of the SPECIAL 1H MR spectroscopy sequence employing three different adiabatic pulses in-vivo at 7T: the standard hyperbolic secant pulse and two gradient-modulated pulses, namely a GOIA and a WURST pulse. Nine healthy volunteers were scanned four times each, with all three SPECIAL variants to establish three different repeatability or reproducibility measures and to evaluate the limits in the precision of the resulting metabolite quantification.
Introduction
In single voxel spectroscopy, the use of short TEs is favorable to minimize effects due to T2/T2* relaxation and J-coupling1. One way to achieve this is to use the SPin ECho, full Intensity Acquired Localized (SPECIAL)2,3 sequence.To assure reproducible results at 7T, the impact of B0 and B1 inhomogeneities should be minimized4. This is particularly important for the adiabatic inversion pulse used in SPECIAL, as inaccuracies in the subtraction will lead to inaccuracies in the localization of the VOI.
This work aims to determine and compare the test-retest repeatability and the reproducibility of neurochemical profiles using the SPECIAL sequence at 7T for three different adiabatic inversion pulses, namely the originally implemented hyperbolic secant (HS)5 pulse, a gradient-offset independent adiabaticity (GOIA)6 pulse, and a wideband, uniform rate, smooth truncation (WURST)7 pulse.
Methods
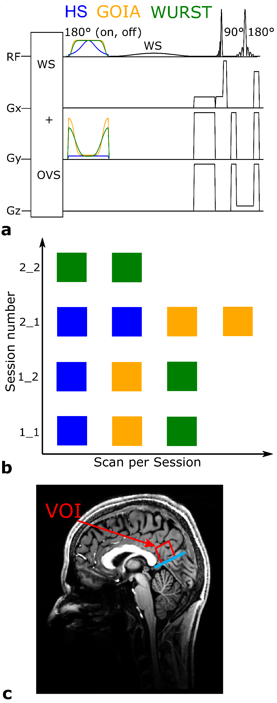
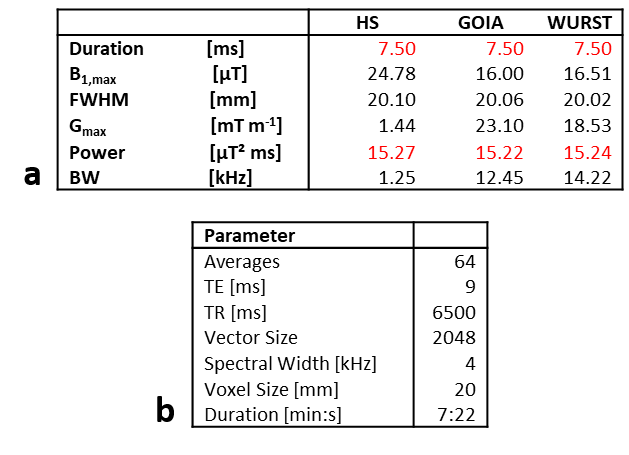
Single volume spectra from the posterior cingulate cortex (PCC) of nine healthy volunteers were acquired using a SPECIAL sequence with HS, GOIA, and WURST pulses on a 7T Scanner (Magnetom 7T, Siemens Healthineers, Erlangen, Germany) utilizing a 1Tx/32Rx-channel head coil (Nova Medical Inc., Wilmington, MA, USA). All measurements were approved by the local ethics board. Fig.1 shows the sequence diagram (Fig.1a), scan scheme (Fig.1b), and voxel positioning (Fig.1c). Tab.1 summarizes the pulse and sequence parameters.Each volunteer was scanned four times with three sequence variants: twice on the first day, repeating all measurements of the first session after repositioning; and twice one week after when repeated measurements with the same sequence variant were acquired without repositioning in-between. In this way, the intra-session repeatability R0 and the reproducibilities after repositioning, i.e. a few minutes later, R1,M, and one week later, R1,W, were assessed. The order of acquisition for the sequence variants was cyclically permuted for the different volunteers to avoid bias from scan time elapsed before the respective sequence variant was performed.
Spectra were post-processed with MATLAB (The Mathworks, Natick, MA, USA), including the summation of the even and uneven averages to obtain full localization, weighted and phase-corrected coil combination, frequency correction, and averaging. The post-processed spectra were quantified with LCModel8. Metabolite concentrations were corrected for relaxation and individual tissue composition using SPM129.
To compare the spectral shape of two measurements and obtain R0,R1,M, and R1,W, the spectral difference is calculated in the frequency domain over the relevant frequency range (4.2 to 0.8 ppm). To generate one point for subject $$$i$$$ in the Bland-Altman plots, the integral of the difference of the absolute between the compared spectra $$$BA_{i,y}$$$ was plotted over the integral of the absolute averaged spectrum $$$BA_{i,x}$$$:
$$BA_{i,y} = \int\limits_{f_0}^{f} | x(f')_{i,1\_1} | - | x(f')_{i,1\_2} | \ df',$$
$$BA_{i,x} = \int\limits_{f_0}^{f} |\ \overline{x(f')_i} | \ df'.$$
$$$| x(f')_{i,1\_1} |$$$ and $$$| x(f')_{i,1\_2} |$$$ indicate the absolute of the real part of the spectral shapes at frequency $$$f’$$$ for two sessions, while $$$|\ \overline{x(f')_i} |$$$ indicates the absolute mean out of both sessions.
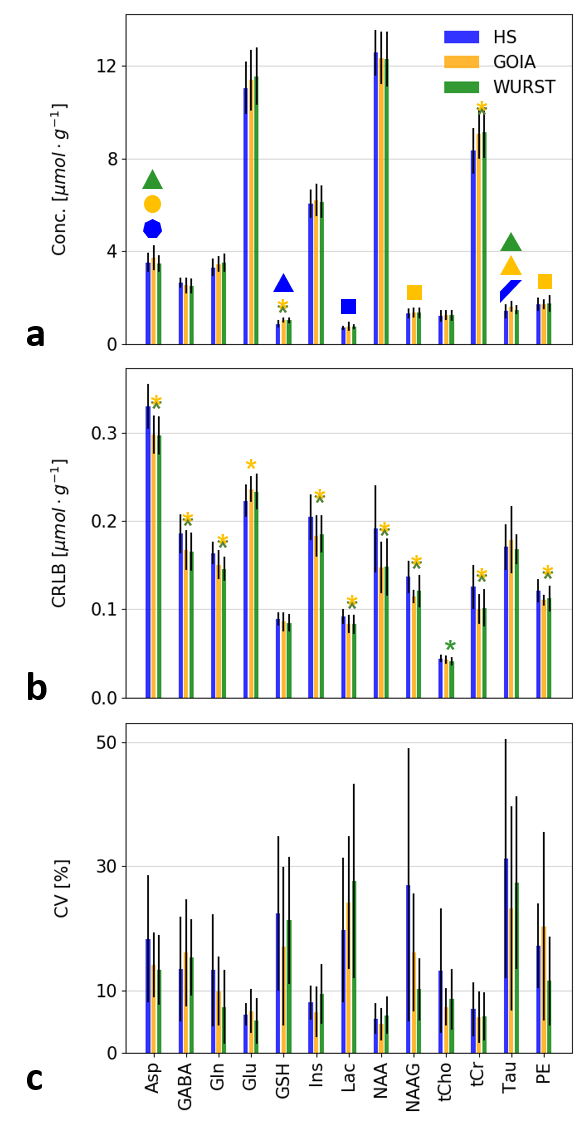
Metabolite concentrations quantified with mean Cramér-Rao lower bounds (CRLBs)≥20% and single values of CRLBs>50% were discarded10. To compare results between the different sequence variants, concentrations and CRLBs were averaged over all subjects and sessions. Furthermore, coefficients of variance (CVs) were determined for all valid quantification results for each volunteer over the four sessions and then averaged over all subjects11. Statistical significance was assessed with a Wilcoxon signed-rank sum test with a significance level of p<0.05.
Results and Discussion
Spectral quality achieved with all three pulses was of comparable and high quality (Fig.2a),while the Bland-Altman plots (Fig.2b) indicate more repeatable results (R0) when using adiabatic GOIA and WURST pulses. For the reproducibility scenarios (R1,M, and R1,W), all three pulses perform on a similar level. As expected, repeatability/reproducibility was improved, the shorter the time in-between measurements, i.e. R0<R1,M<R1,W.For all different inversion pulses and all selected metabolites, similar concentrations and inter-subject variances were observed (Fig.3a). Compared to the HS, slightly higher concentrations for GSH and tCr are obtained with GOIA and WURST pulses. The effect is statistically significant but small. Concentrations and CRLBs are both comparable with literature values for this region11. Out of a total of 468 metabolite concentration values (9 volunteers x 4 sessions x 13 quantified metabolites), the number of measurements that are not included as they exceed the CRLBs limits was 18 for HS-SPECIAL, 7 for GOIA-SPECIAL, and 4 for WURST-SPECIAL. The CRLBs are higher for most of the metabolites measured with HS-SPECIAL (Fig.3b), again a small but statistically significant effect. In addition, HS-SPECIAL showed the highest averaged intra-subject CV for most of the metabolites, except for GABA and Lac (Fig.3c). These results might be explained by the reduced chemical shift displacement error and sharper slice profiles due to the increased RF bandwidth of the gradient-modulated pulses.
Conclusion
In conclusion, the gradient-modulated pulses that were used in the SPECIAL sequence as adiabatic inversion pulses tend to result in decreased intra-subject variation and CRLBs, as well as in improved short-term repeatability compared to the commonly used HS pulse. Thus, the use of GOIA and WURST pulses with SPECIAL yields a more robust metabolite quantification than the HS pulse. However, after one week, intra-individual physiological variations seem to become the dominating factor outshining the performance differences between the different pulses.Acknowledgements
This project has received funding from the EMPIR program co-financed by the Participating States and from the European Union’s Horizon 2020 research and innovation program. This paper reflects only the author's view and EURAMET is not responsible for any use that may be made of the information it contains. Furthermore this project received funding from grant number IT7/8-1 of the DFG.References
1. Zhong K, Ernst T. Localized in vivo human 1H MRS at very short echo times. Magn Reson Med. 2004;52(4):898-901. doi:10.1002/mrm.20201
2. Mlynárik V, Gambarota G, Frenkel H, Gruetter R. Localized short-echo-time proton MR spectroscopy with full signal-intensity acquisition. Magn Reson Med. 2006;56(5):965-970. doi:10.1002/mrm.21043
3. Mekle R, Mlynárik V, Gambarota G, Hergt M, Krueger G, Gruetter R. MR spectroscopy of the human brain with enhanced signal intensity at ultrashort echo times on a clinical platform at 3T and 7T. Magn Reson Med. 2009;61(6):1279-1285. doi:10.1002/mrm.21961
4. Ladd ME, Bachert P, Meyerspeer M, et al. Pros and cons of ultra-high-field MRI/MRS for human application. Prog Nucl Magn Reson Spectrosc. 2018;109:1-50. doi:10.1016/j.pnmrs.2018.06.001
5. Bernstein. Handbook of MRI Pulse Sequences. Elsevier; 2004. doi:10.1016/B978-0-12-092861-3.X5000-6
6. Tannús A, Garwood M. Adiabatic Pulses. NMR Biomed. 1997;10(2-3):423-434. doi:DOI: 10.1002/(sici)1099-1492(199712)10:8<423::aid-nbm488>3.0.co;2-x
7. Andronesi OC, Ramadan S, Ratai EM, Jennings D, Mountford CE, Sorensen AG. Spectroscopic Imaging with Improved Gradient Modulated Constant Adiabadicity Pulses on High-Field Clinical Scanners. J Magn Reson. 2011;23(1):1-7. doi:10.1161/CIRCULATIONAHA.110.956839
8. Provencher SW. Estimation of metabolite concentrations from localized in vivo proton NMR spectra. Magn Reson Med. 1993;30(6):672-679. doi:10.1002/mrm.1910300604
9. Friston K, Ashburner J, Kiebel S, Nichols T, Penny W, eds. Statistical Parametric Mapping. 1st ed. Elsevier; 2007. doi:10.1016/B978-0-12-372560-8.X5000-1
10. Kreis R. The trouble with quality filtering based on relative Cramér-Rao lower bounds. Magn Reson Med. 2016;75(1):15-18. doi:10.1002/mrm.25568
11. Terpstra M, Cheong I, Lyu T, et al. Test-retest reproducibility of neurochemical profiles with short-echo, single-voxel MR spectroscopy at 3T and 7T. Magn Reson Med. 2016;76(4):1083-1091. doi:10.1002/mrm.26022
Figures