2227
The Correlation of Neurometabolites on Presentation of Post-Concussion Phenotypes1Radiology, Brigham and Women's Hospital, Boston, MA, United States, 2Childrens Hospital Colorado, Aurora, CO, United States, 3Ludwig-Maximilians-Universitat, Munich, Germany, 4Brigham and Women's Hospital, Boston, MA, United States, 5Boston Children's Hospital, Boston, MA, United States
Synopsis
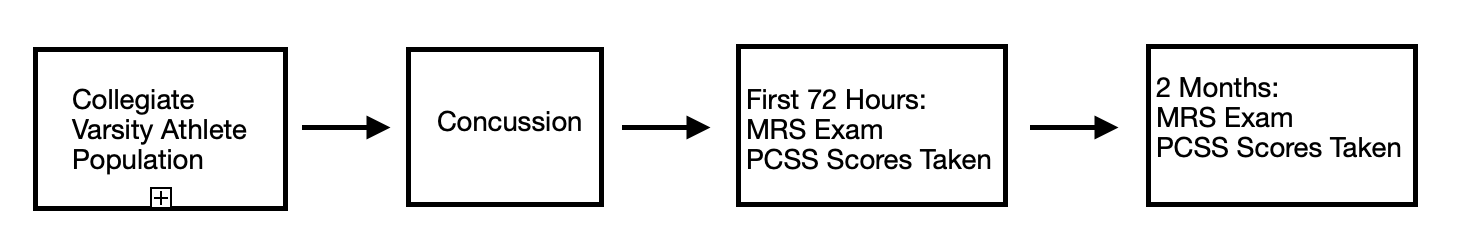
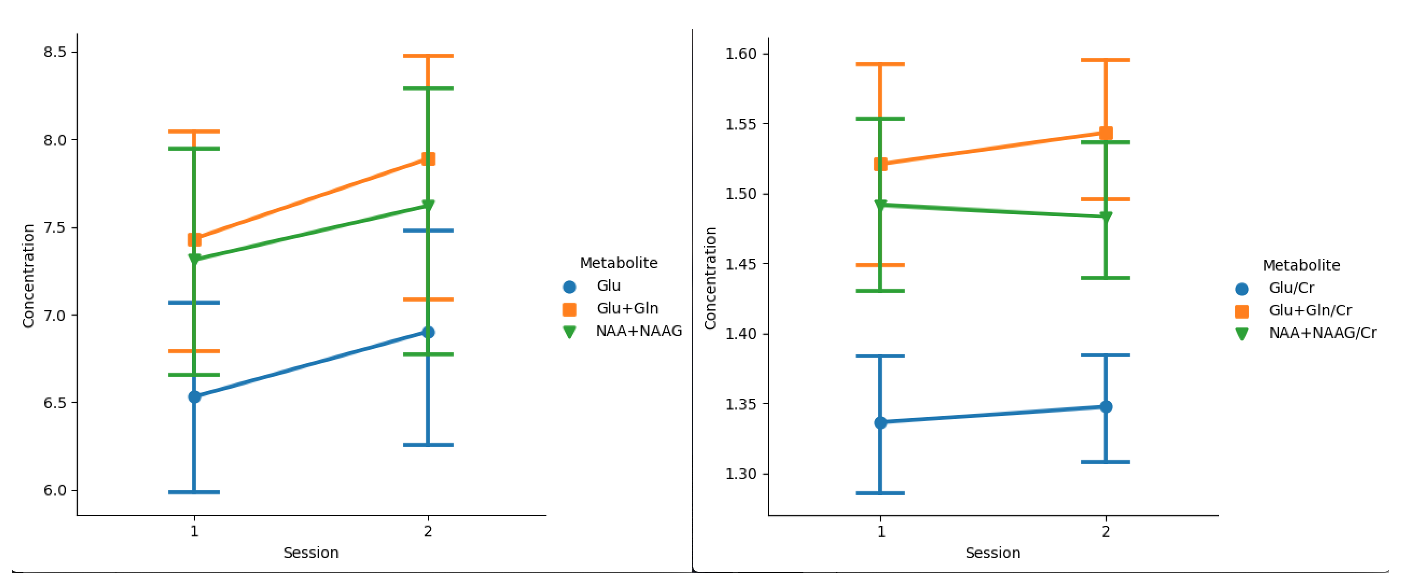
A population of collegiate athletes was evaluated post-concussion for neurometabolic levels in the PCG by magnetic resonance spectroscopy (MRS) and Post-Concussion Symptom Scale (PCSS) following injury. Evaluations were conducted within 72 hours of diagnosed concussion with a follow-up two months after injury. Correlations between neurometabolic concentration and PCSS composite scores were explored. For the purpose of this work, focus was given to the concentrations and concentration ratios of total NAA (NAA+NAAG), total Glutamate (Glu+Gln), and Glutamate (Glu). The change in metabolites between the two time points was also computed.
Introduction
Sport-related Concussion (SRC) is a common occurrence in sport with over 10,000 SRC occurring in collegiate athletes annually1 . In the absence of an objective test for diagnosis, clinicians rely on patient reported symptoms to determine diagnosis2. These clinical symptoms are usually measured using the Post-Concussion Symptom Scale (PCSS), which has been incorporated into many commonly used concussion assessment tools such as the Sport Concussion Assessment Tool (SCAT5) and the Immediate Post Concussion Assessment and Cognitive Test (IMPACT). The clinical presentation of symptoms has been found to be predictive of the length of recovery, with higher initial somatic symptom scores correlated with recovery times longer than 28 days3. Yet despite the key importance of symptoms to diagnosis and prognosis, the underlying neurometabolic changes which manifest in typical symptom phenotypes are poorly understood. A decrease in NAA immediately post-concussion as compared to control subjects has been reported from magnetic resonance spectroscopy studies, reflecting an altered neurometabolic4. A previous study also found a relationship between NAA/Cr in the motor cortex and self-reported symptom scale scores in M1 and DLPFC. However, the study did not find any association between NAA/Cr and symptom scale domain (i.e., composite scores within symptom subcategories)5. Furthermore, the PCG has been identified as a key region in concussion pathophysiology, which was not assessed. In view of these previous studies, it was hypothesized that changes in neurometabolites in PCG would correlate with PCSS symptom scale domain.Methods
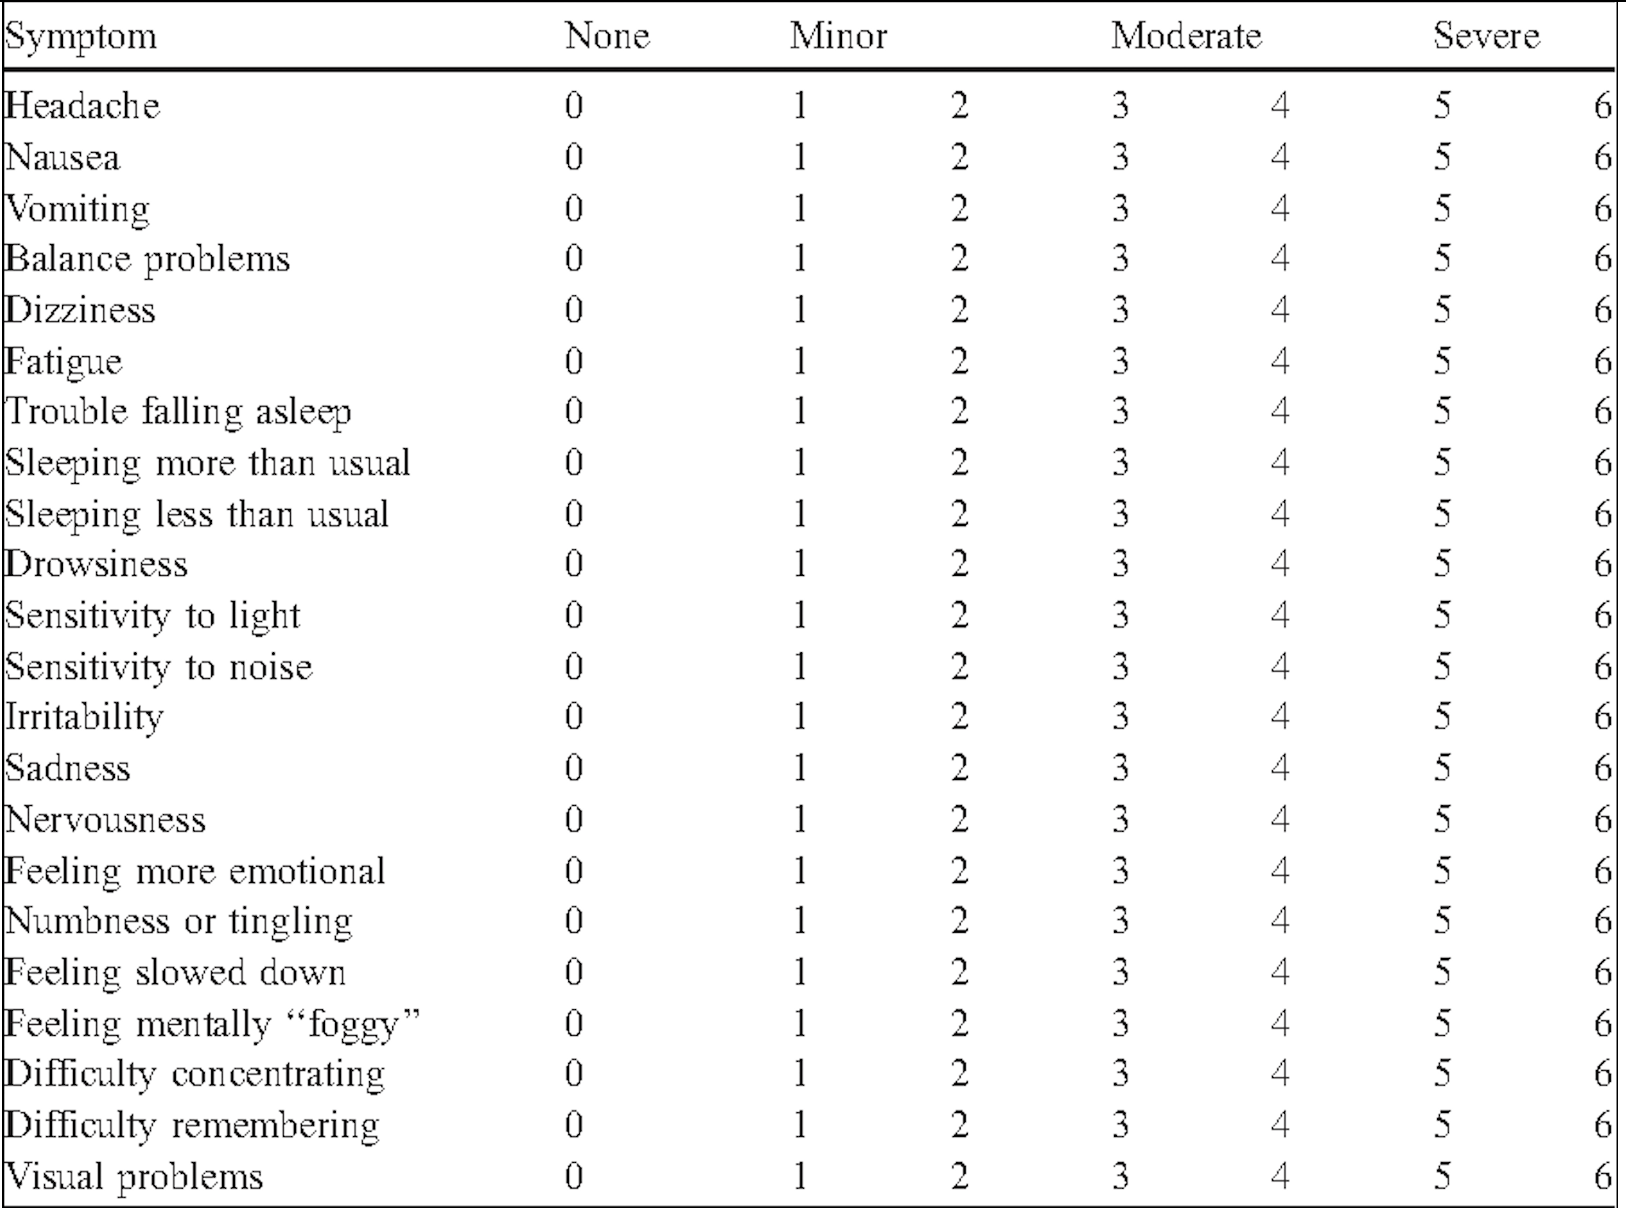
Subjects: Subjects were varsity collegiate athletes at a single NCAA Division 1 institution. Subjects consented to participate in the study following a diagnosed concussion and underwent a clinical test and MRS scan within 72 hours of diagnosis. A second scan and clinical evaluation was conducted at two months post diagnosis. A study timeline is outlined in Figure 1. Clinical Measures: The Post-Concussion Symptom Scale (PCSS) was used to measure clinical symptom burden following concussion. Subjects are given a list of 22 symptoms shown in Figure 2 and ask to rate each symptom on a scale that ranges from 0 (asymptomatic) to 6 (severe). Subjects were instructed to only rate those symptoms that had started following the onset of the injury. The 22 symptoms were then further subdivided into five symptom scale domains: somatic, cognitive, sleep, emotional, and vestibular-ocular (vo). Data collection: The study presents an analysis of 36 spectra from 18 participants measured at a single brain location (Posterior Cingulate Gyrus). The scans were performed at 3T (Skyra, Siemens, Erlangen, Germany) using PRESS localization and utilizing the following parameters. TR=2000, TE=30ms, voxel size=20x20x20mm3, number of averages=128. Data Processing and Quantification: MRS datasets were processed with a python pipeline using OpenMRSLab6 and quantified with LCModel7. This pipeline completed coil combination, eddy-current correction, frequency alignment, water removal, and zero-order phase removal. A TE correction factor was also applied to all absolute metabolite measurements. Statistical Methods: Neurometabolite correlations were assessed for each of the four symptom scale domain scores. Inspection of data revealed a possible quadratic relationship; therefore, regressions were performed against each metabolite concentration along with the squared metabolite concentration.Results
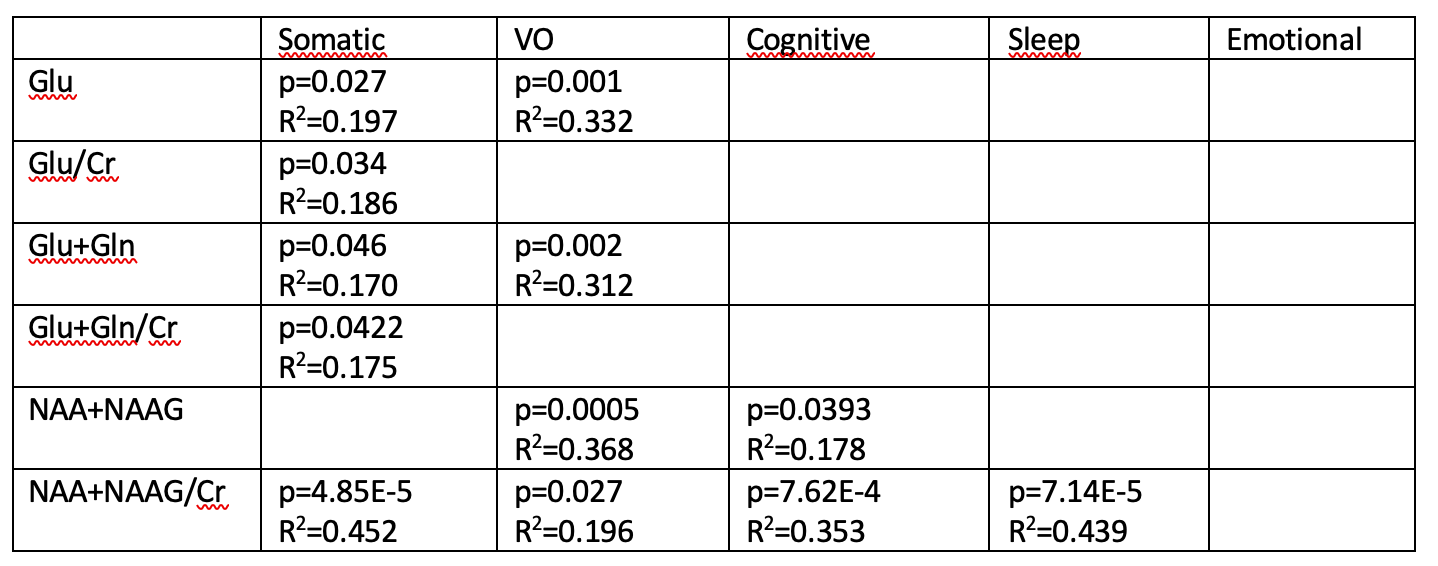
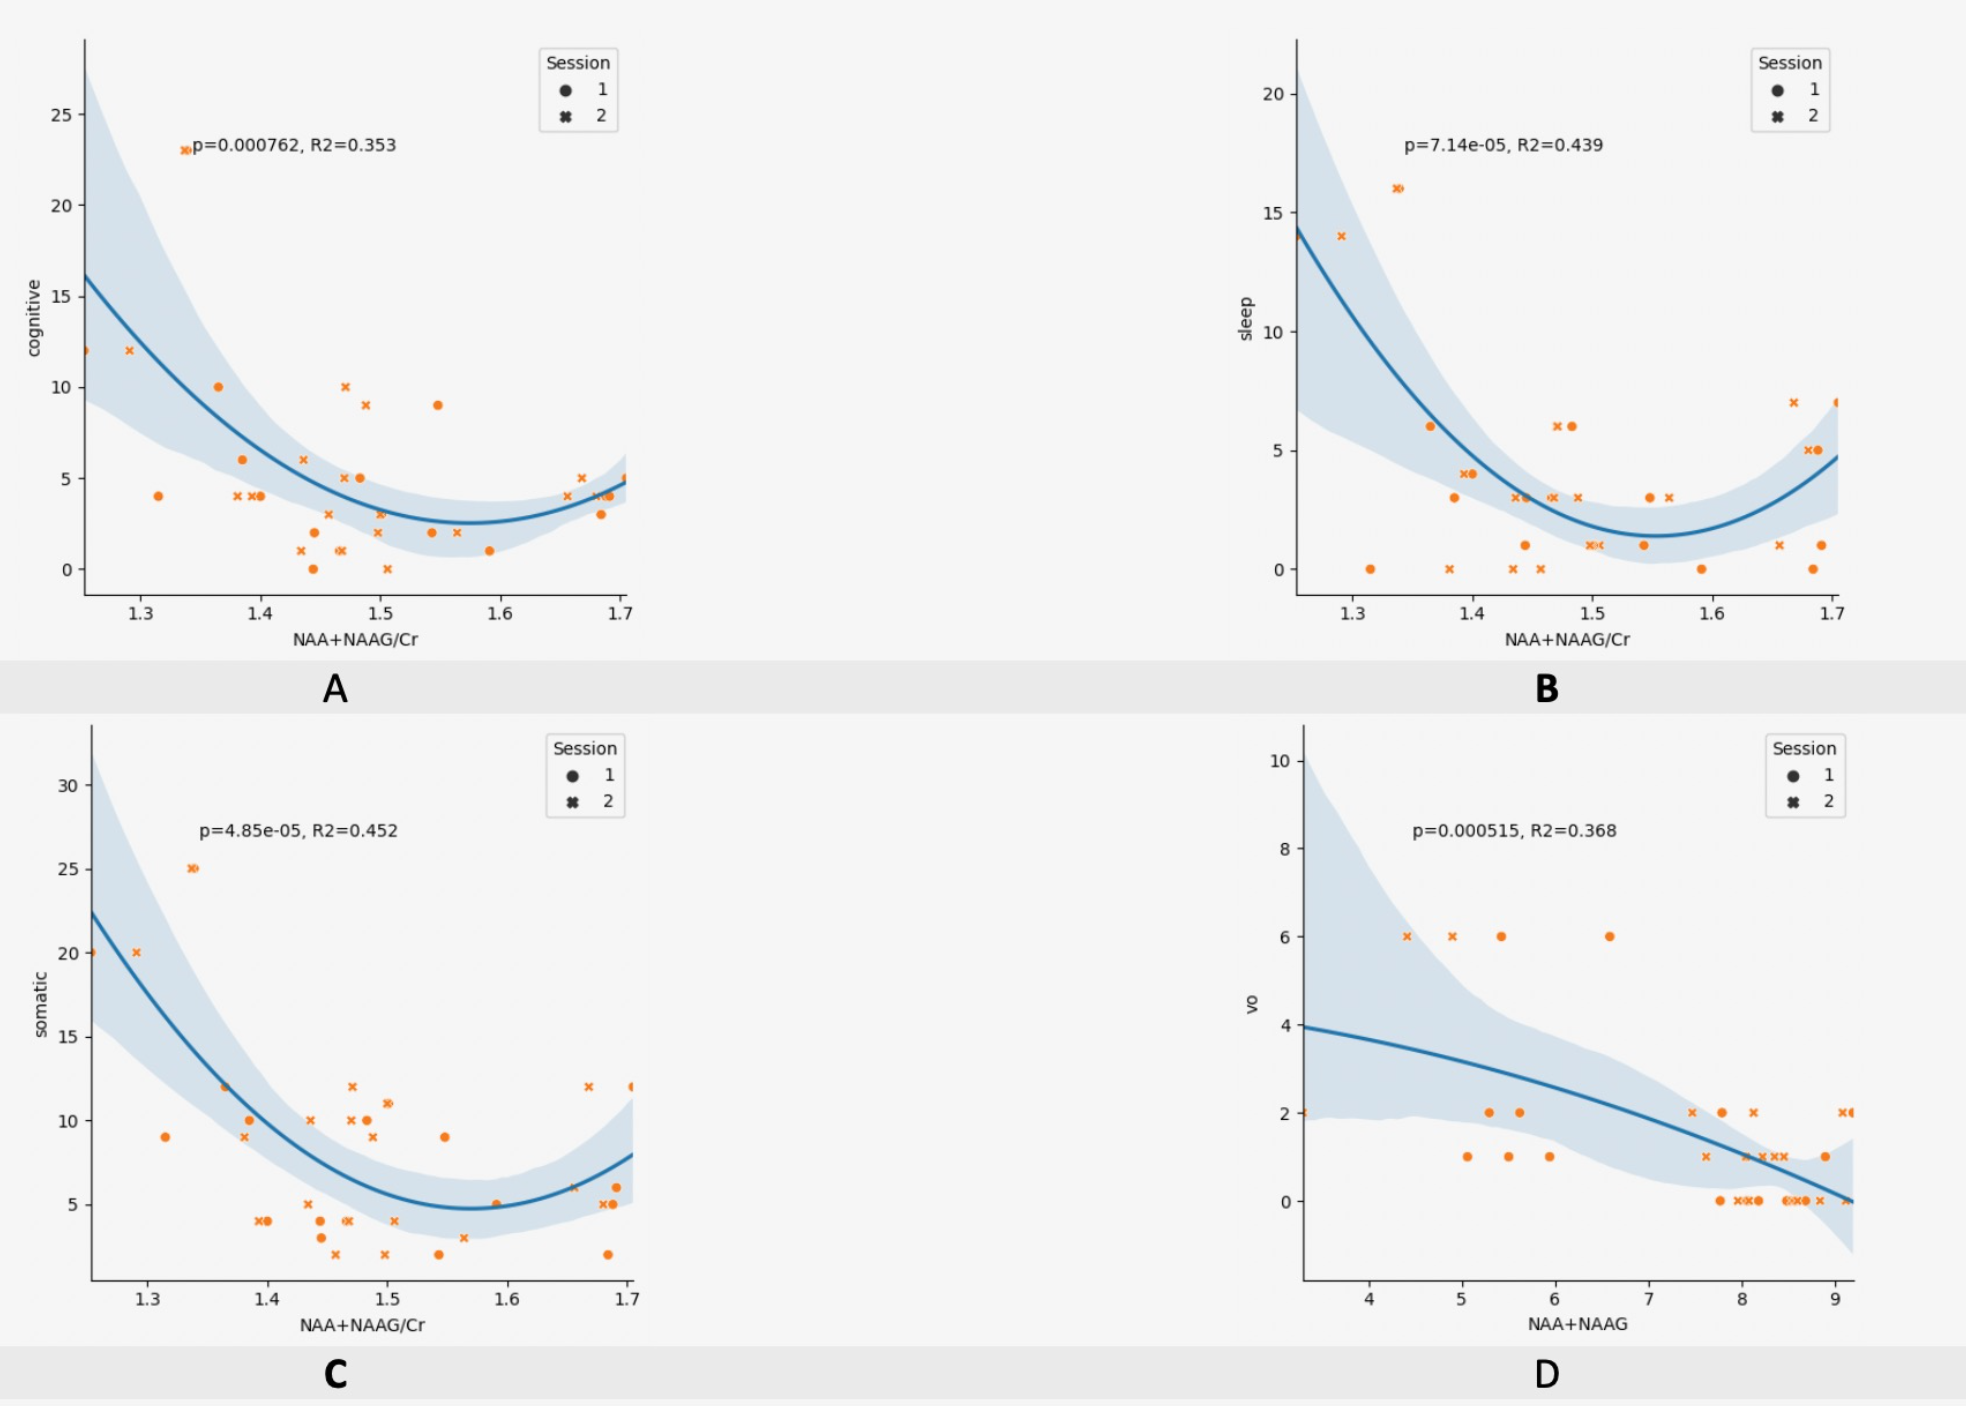
Out of 60 possible combinations of symptom scale domain scores and metabolite metrics, 12 regressions were found to be significant (p<0.05) and listed in Figure 3. Fit quality range from R2 =0.170 to R2=0.452. Total NAA was found to correlate with vestibular-ocular symptom scores (p=0.0005,R2=0.368) and cognitive symptom scores (p<0.04, R2=0.178). The ratio of Total NAA over Total Creatine correlated with somatic symptom scores (p≪0.0001, R2=0.452) and sleep symptom scores (p≪0.0001, R2=0.439).Conclusion
Data indicate that neurometabolite concentrations correlate with symptom phenotype. Moreover, the relationships appear to be nonlinear, with a relationship to both the concentration of the metabolite and the metabolite squared. This nonlinear dependence may suggest a more complex relationship between metabolic changes and symptom presentation. It is also notable that the strongest relationships were identified for Total NAA. Total NAA has been implicated in the literature as an indicator of neuronal health.4Acknowledgements
No acknowledgement found.References
[1] Zuckerman S L, et al. Epidemiology of Sport Related Concussion in NCAA Athletes From 2009-2010 to 2013-2014: Incidence, Recurrance, and Mechanisms. AJSM. (2015).
[2] McCrory P, et al. Consensus Statement on Concussion in Sport – the 5th International Conference on Concussion in Sport Held in Berlin, October 2016. BJSM. (2017).
[3] Howell D R, et al. Initial Somatic Symptoms are Associated with Prolonged Symptom Duration Following Concussion in Adolescents. Acta Paediatr. (2016)
[4] Gardner A, et al. A Systematic Review of Proton Magnetic Resonance Spectroscopy Findings in Sport-Related Concussion. J Neurotrauma (2014)
[5] Henry L. et al. Neurometabolic Changes in the Acute Phase after Sports Concussions Correlate with Symptom Severity. J Neurotrauma (2010).
[6] Niznikiewicz MA, et al. Neurobiological approaches to the study of clinical and genetic high risk for developing psychosis. Psychiatry Res. (2019)
[7] Bednařík P, et al. Neurochemical and BOLD responses during neuronal activation measured in the human visual cortex at 7 Tesla. Journal of Cerebral Blood Flow & Metabolism (2015)
Figures