2226
Measurement of local values of cerebral pH in mild traumatic brain injury using 1H MR spectroscopy1Lomonosov Moscow State University, Moscow, Russian Federation, 2Clinical and Research Institute of Emergency Pediatric Surgery and Traumatology, Moscow, Russian Federation, 3Emanuel Institute of Biochemical Physics of RAS, Moscow, Russian Federation, 4PHilips Healthcare, Russia, Moscow, Russian Federation, 5Semenov Institute of Chemical Physics of the Russian Academy of Sciences, Moscow, Russian Federation
Synopsis
The effect of mild traumatic brain injury (mTBI) on the values of the cerebral pH in the region of the posterior cingulate cortex was studied. pH was determined by analyzing the chemical shifts of mobile protons in the aromatic region of the spectrum of histidine, homocarnosine, resonating at ~7-8 ppm in PRESS spectra. According to our data, the pH value decreases by ~1% in posterior cingulate cortex after acute mTBI.
Introduction
Mild traumatic brain injury (mTBI) is a very common diagnosis in medical practice. It may have some long-term consequences, e.g. reduced attention, memory and sleep disturbances, increased irritability and fatigue, decreased attention, frequent dizziness and headaches [1]. However, mTBI does not lead to structural changes visible by MRI or computed tomography, but may cause the metabolic and chemical changes in the brain. MR spectroscopy may be a tool able to detect these changes [2].One of the parameters describing the normal cerebral state is the pH value [2]. Phosphorus MRS is the traditional way to determine pH in vivo, however, multinuclear spectroscopy is connected with special technical requirements. 1H MRS could be a suitable alternative: pH is determined by analyzing the chemical shifts of mobile protons in the aromatic region of the spectrum of histidine, homocarnosine, resonating at ~7-8 ppm [3].
The aim of this study is to determine the effect of the acute mTBI on the value of cerebral pH in the region of posterior cingulate cortex (PCC). The signal at ~7 ppm is more intensive, and has been chosen as the signal of interest.
Materials and methods
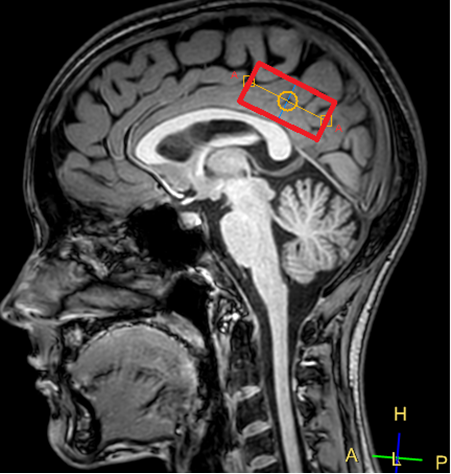
Subjects: 16 patients of Clinical and Research Institute of Emergency Pediatric Surgery and Trauma with mTBI (up to 3 days since the injury), mean age 15±3 years, and 17 healthy age-matched controls. MRI examination: Philips Achieva dStream 3.0T and 32-channel SENSE head quadrature coil were used.The PRESS pulse sequence parameters are as follows: TR=2 s, TE=80 ms, Npoints = 2048, BW = 2000 Hz, NSA=288. The voxel sized 50 x 25 x 25 mm was located in the posterior cingulate cortex (fig.1).
Data processing
Spectra were processed in home-made MATLAB script, based on FID-A processing toolkit [4]. Processing included zero filling, rejection of bad averages, aligning and averaging. The SNR of the peak at 7 ppm was measured in individual spectra.After that, spectra were aligned between subjects and averaged over groups into normal spectrum and mTBI spectrum. SNR of the peaks of interest was measured in these spectra as well. For further analysis, the apodization with line broadening factor = 0.5 Hz was used. The central resonance frequency was determined in 2 ways: as the frequency of the maximum real value of spectrum in the range of 6.5 – 7.5 ppm, and as the coordinate of the maximum of the Gaussian line used for peak approximation. The approximation algorithm was taken from Gannet [5]. Aligning was performed using the Сr1 signal (3.01 ppm). To control the ppm scale identity, the frequency of Cr2 (3,89 ppm) and NAA (2,01 ppm) signal were also estimated.
The pH values were calculated using the following expression [3]:
$$pH = 6.86 + log{\frac{7.27 - \sigma}{\sigma - 6.92}}$$
Results
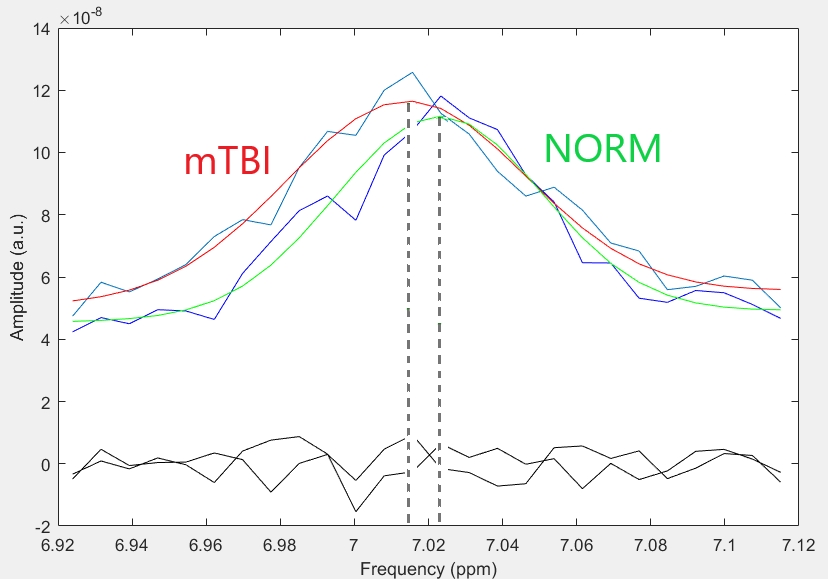
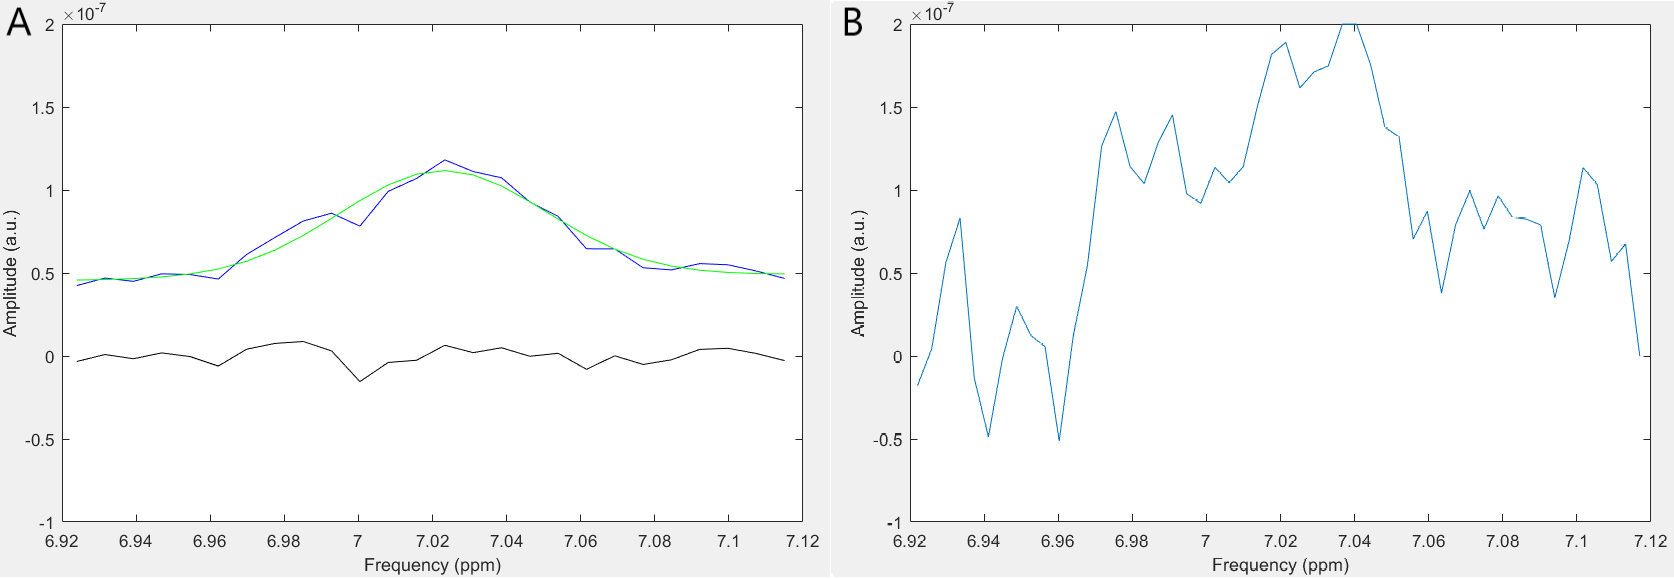
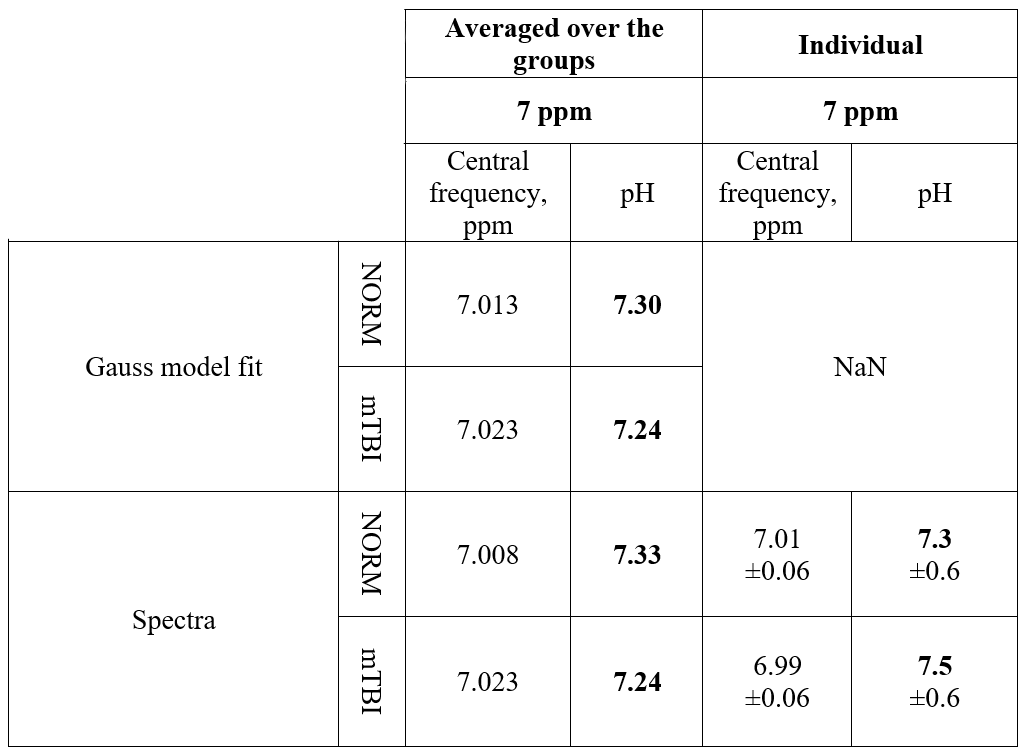
SNR of group-averaged spectra at ~7 ppm (fig3.a) was 11.6 for the NORM and 13.9 for mTBI. For individual spectra (fig3.b), SNR at ~7 ppm was 4±1.5. Gauss model fit was successful only for group-averaged spectra.The values of the center frequencies at ~7 ppm, and the corresponding pH values are provided in table 2.
In case of spectra, averaged over groups, the pH value in mTBI decreased by 0.8% when ~7 ppm signal was approximated with a Gaussian, and by 1.2%, when the center frequency was determined directly. The difference between the center frequencies of NAA (at ~2.01 ppm) in the averaged NORM and mTBI spectra was equal to 0.001 ppm, for Cr2 (at ~3.9 ppm) – 0.0006 ppm, which is ~2 orders of magnitude lower than the difference in the central frequency of the signal of interest at ~7 ppm.
For individual spectra, low SNR at ~7 ppm has led to a large pH error value, providing inconsistent results.
Discussion
The results of the study demonstrate that the pH value decreases in posterior cingulate cortex after acute mTBI. Since the pH regulates the activity of the enzymes participating in cerebral metabolism [6], its change may cause the biochemical disorders in this cerebral region. These alterations may be connected with the consequences of the trauma.Despite the fact that the pH values obtained in this study are slightly overestimated (comparing with, e.g. [3]), the proximity of the Cr2 and NAA frequencies in normal and mTBI spectra confirms the presence of the pH alteration.
The dismal results of the individual spectra processing due to the low SNR at ~7 ppm indicate the necessity to use spectral aligning and group averaging. This allowed obtaining the SNR of the signal at ~7 ppm sufficient for the robust analysis. The use of relatively long TE = 80 ms in this study significantly reduced the signal of macromolecules resonating at ~7 ppm, resulting in further improvement of signal processing accuracy.
Acknowledgements
No acknowledgement found.References
1. Rafael Romeu-Mejia, Christopher C Giza , Joshua T Goldman. Concussion Pathophysiology and Injury Biomechanics. Curr Rev Musculoskelet Med 2019 Jun;12(2):105-116.
2. Peter B. Barker Alberto Bizzi Nicola De Stefano Rao P. Gullapalli Doris D. M. Lin. Clinical MR Spectroscopy Techniques and Applications. CAMBRIDGE UNIVERSITY PRESS. ISBN-13 978-0-521-86898-3
3. Douglas L. Rothman, Kevin L. Behar, James W. Prichard, Ognen A. C. Petroff. Homocarnosine and the Measurement of Neuronal pH in Patients with Epilepsy. MRM 32924-929 (1997)
4. Simpson R, Devenyi GA, Jezzard P, Hennessy TJ, Near J. Advanced processing and simulation of MRS data using the FID appliance (FID‐A)—An open source, MATLAB‐based toolkit. Magnetic resonance in medicine. 2017 Jan 1;77(1):23-33.
5. Richard A E Edden, Nicolaas A J Puts, Ashley D Harris, Peter B Barker, C John Evans. Gannet: A batch-processing tool for the quantitative analysis of gamma-aminobutyric acid–edited MR spectroscopy spectra.PMID: 25548816 PMCID: PMC4280680 DOI: 10.1002/jmri.24478
6. M. Cheder. The regulation and modulation of pH in the nervous system. Progress in Neurobiology 34, 401-427 (1990)
Figures