2224
Macromolecule suppressed GABA levels show no relationship with age in children and adolescents1Department of Radiology, University of Calgary, Calgary, AB, Canada, 2Hotchkiss Brain Institute, University of Calgary, Calgary, AB, Canada, 3Alberta Children's Hospital Research Institute, University of Calgary, Calgary, AB, Canada
Synopsis
Studies have shown that GABA+ increases with age during development, however roughly 50% of this signal reflects macromolecules. It is often assumed that macromolecule levels are stable, but there has been no attempt to directly validate this in youth. Here, we use a sequence specifically designed to suppress the macromolecule signal that contaminates the measured GABA+ signal when using MEGA-PRESS. We show no relationship between macromolecule-suppressed GABA and age in youth aged 7-14 years. We suggest increases in macromolecule levels may drive previously shown relationships between age and GABA+ levels, highlighting the importance of controlling for macromolecules in MRS analyses.
Introduction
γ-Aminobutyric Acid (GABA) is the primary inhibitory neurotransmitter in the human brain and can be measured using proton magnetic resonance spectroscopy (MRS). Due to its relatively low abundance in the brain and the overlap of more abundant metabolite signals on the spectrum, GABA levels at 3T are typically measured using the MEscher-GArwood editing sequence, MEGA-PRESS.1 However, typically this GABA data is contaminated (~50%) by signal from macromolecules which are co-edited with GABA. Therefore, this measurement is often referred to as GABA+. The acquisition can be modified to limit this contamination, an approach known as macromolecule-suppressed MEGA-PRESS.Prior work has shown GABA+ increases during development,2,3 followed by a decline late in life.4,5 However, it is unknown how macromolecules influence these GABA-age relationships. Indeed, one cross-sectional study found GABA+ increases with age in subjects aged 20-50 years but macromolecule-suppressed GABA did not show the same age relationship,6 suggesting macromolecule changes drive the relationship between GABA+ and age in young-middle aged adults. It is therefore likely that macromolecule levels have an effect on age-related changes in children as well.
This study examines the relationship between age and macromolecule-suppressed GABA levels in children aged 7-14 years in three locations in the brain: the thalamus, sensorimotor cortex and occipital cortex.
Methods
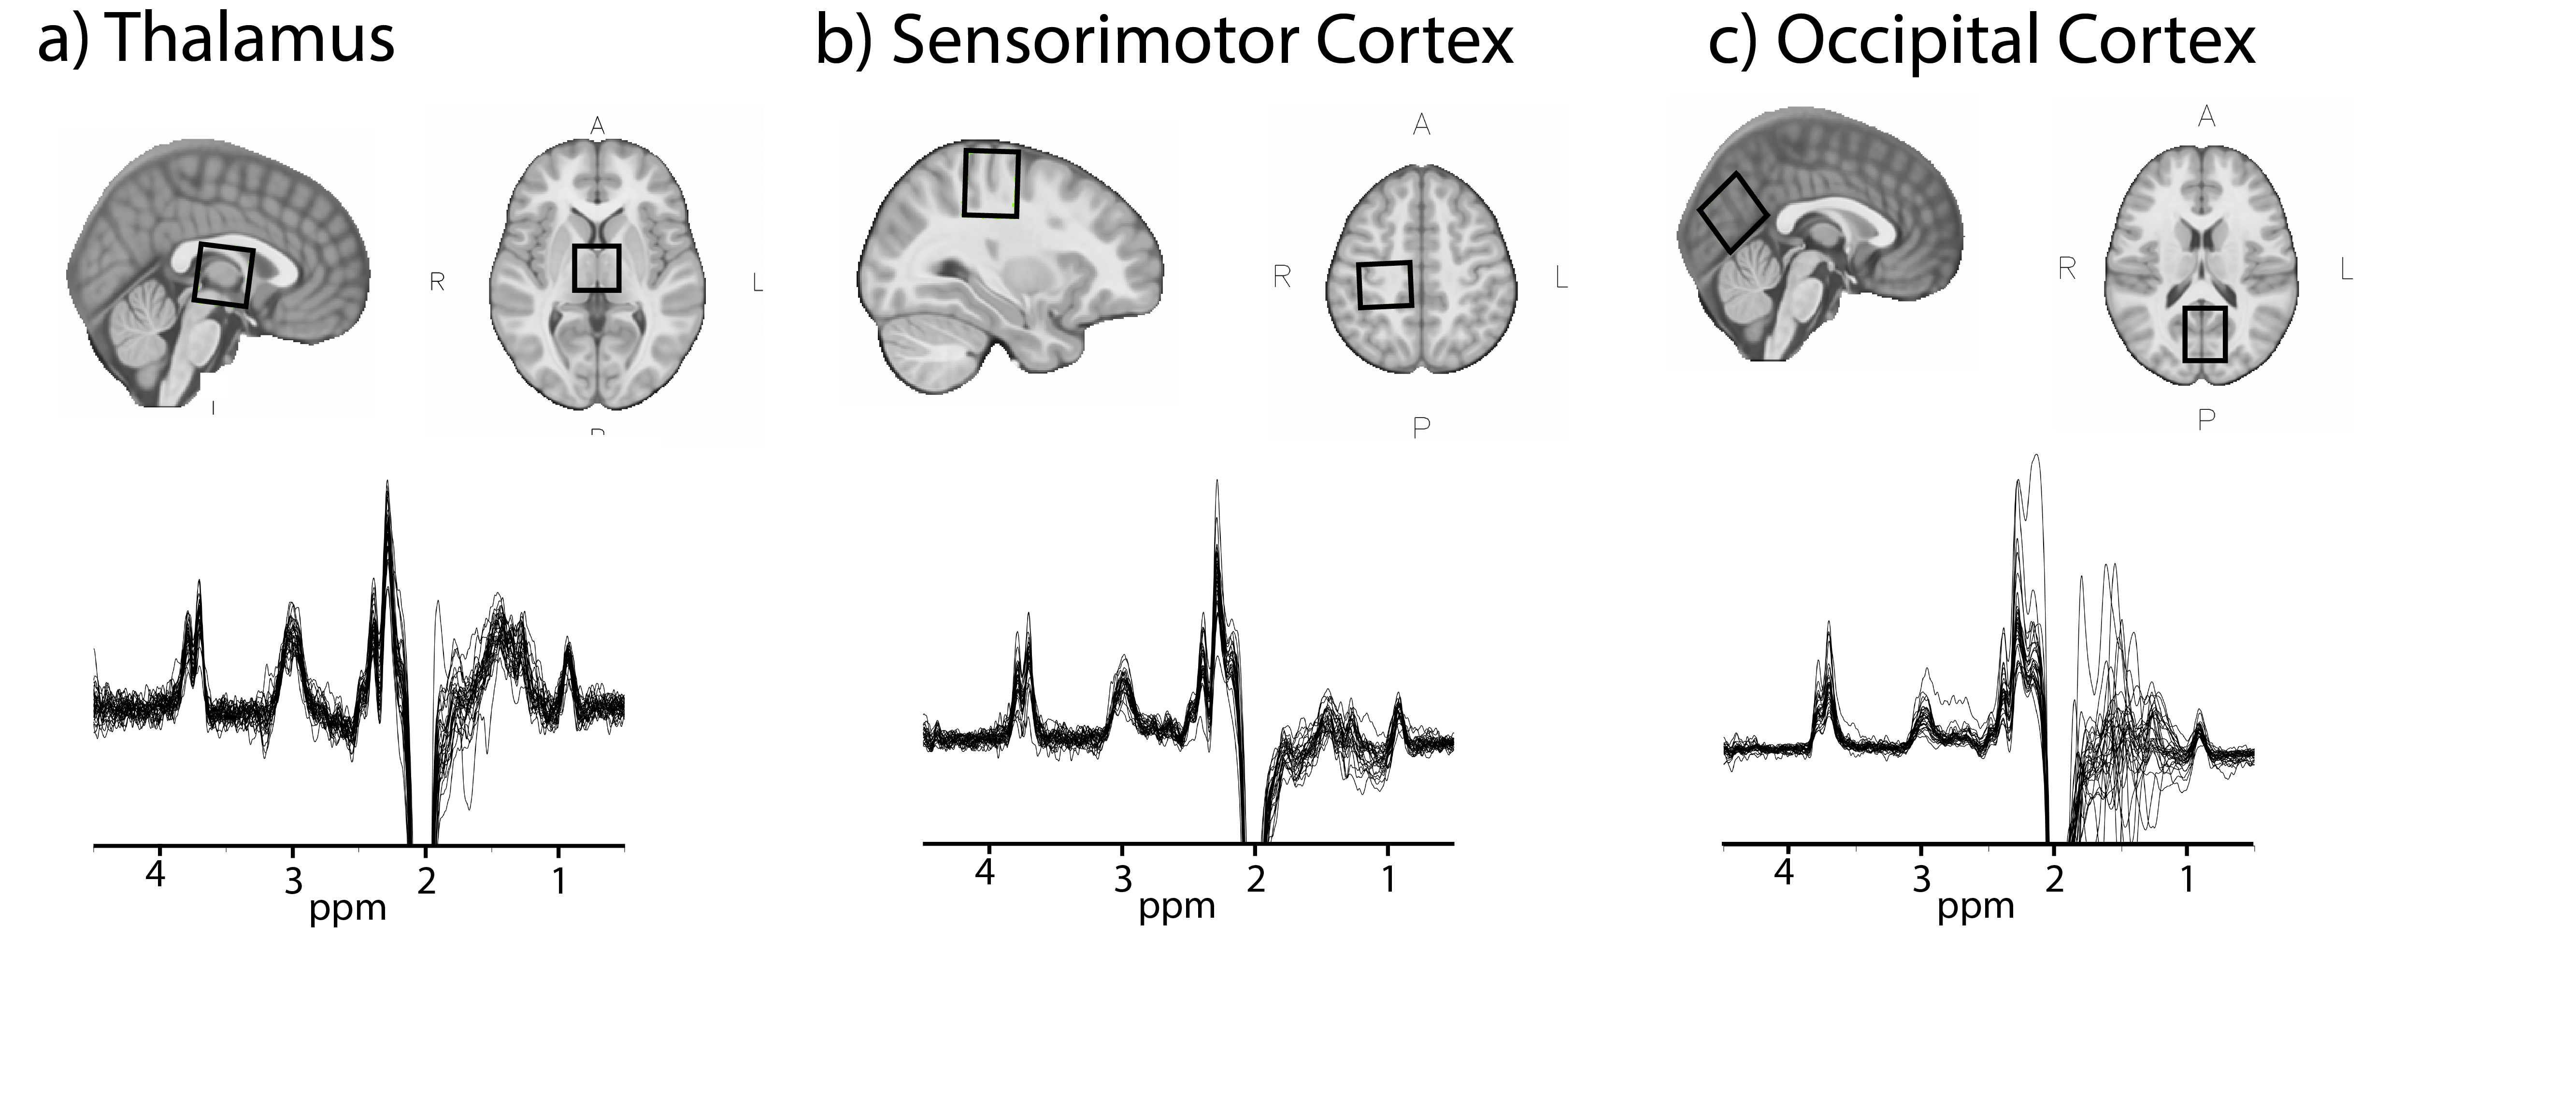
Twenty-nine children (7-14 years) were scanned on a 3T GE MR750w scanner (General Electric Healthcare, USA) with a 32-channel head coil. A T1-weighted image (BRAVO) was acquired for voxel placement and tissue segmentation. MRS voxels (3x3x3cm3) were placed in the thalamus, left sensorimotor and midline occipital cortex (Figure 1). Data were collected using a macromolecule-suppressed MEGA-PRESS acquisition (TR/TE = 1.8s/80ms, 20ms editing pulses at 1.9ppm and 1.5ppm, 256 averages).Data were processed using Gannet3.1,7 including retrospective frequency and phase correction using spectral registration,8 voxel segmentation and tissue specific water relaxation,9 with removal of the macromolecule correction factor (macromolecule = 0.45) as typically applied in Gannet to account for macromolecular contamination.9
We report quantified macromolecule-suppressed GABA in molal units, accounting for tissue specific relaxation and mole fractions of water.10 We also report macromolecule-suppressed GABA including the “α-correction”,9 which assumes the concentration of GABA in grey matter (GM) is twice that of white matter (WM) (α = 0.5). As a confirmatory analysis, we quantify macromolecule-suppressed GABA relative to creatine (macromolecule-suppressed GABA/Cr) to allow comparison to previous studies and ensure results were not due to water signal differences.
Statistical analyses were performed using SPSS (IBM. 2017. IBM SPSS Statistics for Macintosh, Version 25.0. Armonk, NY: IBM). Macromolecule-suppressed GABA (with and without α-correction) vs age (months) and macromolecule-suppressed GABA/Cr vs age were estimated using Pearson’s correlation coefficient.
Additionally, this analysis was repeated for macromolecule-suppressed GABA and macromolecule-suppressed GABA/Cr using partial correlations controlling for the GM ratio in each voxel (calculated as GM/GM+WM). Macromolecule-suppressed GABA with α-correction was not included in this secondary analysis as the GM ratio is already included in the α-correction.
Results
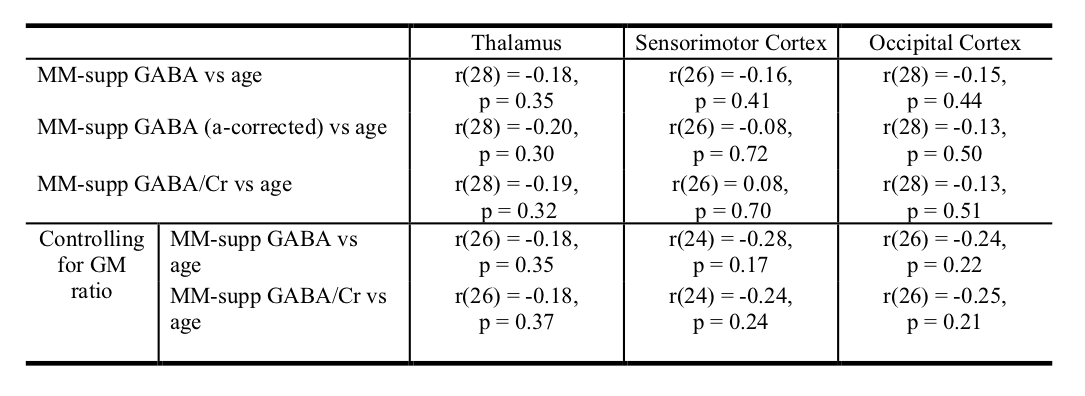
There were no significant correlations between age and macromolecule-suppressed GABA levels in any of the three regions when using any of the GABA quantification methods (with and without α-correction or when referencing to Cr; Figure 2; Table 1).There was a significant correlation between the GM ratio and age in the sensorimotor cortex only (r(27)=-0.44, p=0.02). However, controlling for the GM ratio did not change the relationship between macromolecule-suppressed GABA and age in any region (Table 1).
Discussion
Using macromolecule-suppressed MEGA-PRESS, we show no relationship between macromolecule-suppressed GABA and age in youth aged 7-14 years. We performed additionally analyses; (1) using α-corrected GABA levels, (2) controlling for the GM-tissue fraction using partial correlations, and (3) macromolecule-suppressed GABA referenced to creatine; none of these analyses indicate any relationship between macromolecule-suppressed GABA and age.Our results suggest that the relationship between GABA+ and age seen during development is driven by age-related changes in macromolecules, though this would need to be confirmed using macromolecule specific sequences such as metabolite nulling. Macromolecule signals seen in MRS spectra represent flexible amino acids, and developmental changes in macromolecule levels may reflect changes in metabolite turnover, such as cell proliferation and apoptosis.11
Changes in macromolecule levels have important implications when using MRS, and specifically here using GABA+-edited MRS, to study development in typical and atypical populations. Indeed, though it is often assumed that macromolecule levels remain stable, this has been shown to be inaccurate in several diseases. For example, macromolecule levels have been shown to be elevated in multiple sclerosis12 and after stroke.13 Additionally, the relationship between GABA+ and macromolecule suppressed GABA varies regionally, Harris et al. (2015) showed a trend towards a positive correlation between the two measures in the sensorimotor cortex that was absent in the occipital cortex,14 highlighting the potential impact of macromolecule contamination on GABA associations.
In conclusion, we found no relationship between age and macromolecule-suppressed GABA levels in youth age 7-14 years across three voxels in the brain. Given prior suggestions in the literature that GABA+ increases with age, we suggest increases in macromolecule levels may drive previously shown relationships between age and GABA+ levels. This study highlights the importance of considering macromolecules in MRS analyses.
Acknowledgements
This study was funded by a SickKids CIHR IHDCYH New Investigator Grant and the Natural Sciences and Engineering Research Council of Canada. TB was supported by a Harley N. Hotchkiss- Samuel Weiss Postdoctoral Fellowship, University of Calgary. Additional support provided by the Hotchkiss Brain Institute and the Alberta Children’s Hospital Research Institute, University of Calgary.References
1. Mescher, M., Merkle, H., Kirsch, J., Garwood, M. & Gruetter, R. Simultaneous in vivo spectral editing and water suppression. NMR Biomed. 11, 266–272 (1998).
2. Gaetz, W. et al. GABA estimation in the brains of children on the autism spectrum: Measurement precision and regional cortical variation. Neuroimage 86, 1–9 (2014).
3. Saleh, M. G. et al. Effect of Age on GABA+ and Glutathione in a Pediatric Sample. Am. J. Neuroradiol. 1–6 (2020) doi:10.3174/ajnr.A6543.
4. Gao, F. et al. Edited magnetic resonance spectroscopy detects an age-related decline in brain GABA levels. Neuroimage 78, 75–82 (2013).
5. Porges, E. C. et al. Frontal Gamma-Aminobutyric Acid Concentrations Are Associated With Cognitive Performance in Older Adults. Biol Psychiatry Cogn Neurosci Neuroimaging 2, 38–44 (2017).
6. Aufhaus, E. et al. Absence of changes in GABA concentrations with age and gender in the human anterior cingulate cortex: A MEGA-PRESS study with symmetric editing pulse frequencies for macromolecule suppression. Magn. Reson. Med. 69, 317–320 (2013).
7. Edden, R. A. E., Puts, N. A. J., Harris, A. D., Barker, P. B. & Evans, C. J. Gannet: A Batch-Processing Tool for the Quantitative Analysis of Gamma-Aminobutyric Acid–Edited MR Spectroscopy Spectra. J Magn Reson Imaging40, 1445–1452 (2014).
8. Near, J. et al. Frequency and phase drift correction of magnetic resonance spectroscopy data by spectral registration in the time domain. Magn. Reson. Med. 50, 44–50 (2014).
9. Harris, A. D., Puts, N. A. J. & Edden, R. A. E. Tissue correction for GABA-edited MRS: Considerations of voxel composition, tissue segmentation, and tissue relaxations. J. Magn. Reson. Imaging 42, 1431–1440 (2015).
10. Near, J. et al. Preprocessing, analysis and quantification in single‐voxel magnetic resonance spectroscopy: experts’ consensus recommendations. NMR Biomed. e4257 (2020) doi:10.1002/nbm.4257.
11. Hakumäki, J. M. & Kauppinen, R. A. 1H NMR visible lipids in the life and death of cells. Trends Biochem. Sci. 25, 357–362 (2000).
12. Mader, I. et al. Proton MR spectroscopy with metabolite-nulling reveals elevated macromolecules in acute multiple sclerosis. Brain 124, 953–961 (2001).
13. Saunders, D. E., Howe, F. A., Van Den Boogaart, A., Griffiths, J. R. & Brown, M. M. Discrimination of metabolite from lipid and macromolecule resonances in cerebral infarction in humans using short echo proton spectroscopy. J. Magn. Reson. Imaging 7, 1116–1121 (1997).
14. Harris, A. D., Puts, N. A. J., Barker, P. B. & Edden, R. A. E. Spectral-editing measurements of GABA in the human brain with and without macromolecule suppression. Magn. Reson. Med. 74, 1523–1529 (2015).
15. Mikkelsen, M., Harris, A. D., Edden, R. A. E. & Puts, N. A. J. Macromolecule-suppressed GABA measurements correlate more strongly with behavior than macromolecule-contaminated GABA+ measurements. Brain Res. 1701, 204–211 (2018).
Figures