2222
Comparison of Semi-LASER and Short-TE STEAM Pulse Sequences for Cerebral Glucose Quantification via Detecting H1-Α-Glucose Peak in 1H MRS at 7 T1Siemens Healthcare K.K., Tokyo, Japan, 2Human Brain Research Center, Kyoto University Graduate School of Medicine, Kyoto, Japan, 3Kyoto University Graduate School of Informatics, Kyoto, Japan, 4Siemens Medical Solutions, Berkeley, CA, United States, 5Siemens Medical Solutions, Boston, MA, United States
Synopsis
Single voxel MRS pulse sequences of semi-LASER and short-TE STEAM were compared for cerebral glucose quantification via detecting H1-α-glucose peak at 5.23 ppm. Young healthy non-fasted subjects were scanned on a whole-body 7T MRI. Spectra were analyzed on LCModel and in-house MATLAB software. Semi-LASER (32-ms TE) detected the H1-α-glucose peak at posterior cingulate cortex (27-mL volume) with higher SNR (9.1 vs 5.1) than short-TE STEAM (5-ms TE) in shorter scan time (11 vs. 12.5 minutes), respectively, and estimated glucose concentration to be 1.26 mM. More robust water suppression techniques are required to stabilize baselines around the peak.
Introduction
Cerebral neurochemicals are effectively detected using 1H MRS at ultra-high field due to high sensitivity and peak separation. However, it has seldom been used to measure cerebral glucose due to its low sensitivity in detecting glucose peaks, which are separated by anomeric configurations, split further by J-coupling, and overlap with peaks from other metabolites and macromolecules.1 H1-α-glucose peaks at 5.23 ppm are free of spectral overlap and has been recorded in the human brain at 4 T.2-3 Recently, 1H downfield MRS has been performed in the human brain at 7 T,4-5 which includes the H1-α-glucose peaks. In the report5 using short-TE STEAM pulse sequence, the spectra were severely contaminated by extracranial lipid signals due to chemical shift displacement (CSD). Semi-localized by adiabatic selective refocusing (semi-LASER) pulse sequence has been proposed for effective signal detection and CSD reduction.6 The current study compared those pulse sequences for cerebral glucose quantification.Methods
This study was approved by an institutional review board, and written informed consent was obtained from subjects. The 11 healthy non-fasted subjects (aged 20-23 years) were scanned on a whole-body 7T scanner (MAGNETOM 7T-prototype, Siemens Healthcare, Erlangen, Germany). A single-channel transmit, and 32-channel receive head coil (Nova Medical, MA, USA) was used. An MRS voxel was positioned at the posterior cingulate cortex (27 mL) in the mid-sagittal plane on T1-weighted images. B0 shimming was achieved using FASTESTMAP (Siemens prototype sequence) (7). B1 amplitude was adjusted for the MRS voxels.MR spectra were acquired using Siemens prototype sequences of semi-LASER (TR/TE = 6500/32 ms, signal average = 96, scan time = 11 min) and short-TE STEAM (TR/TE/TM = 5700/5/45 ms, signal average = 128, scan time = 12.5 min) with VAPOR water suppression8 and outer volume suppression. Identical MRS parameters were RF transmitter offset = 4.2 ppm, spectral width = 6 kHz, data points = 2048. In pilot studies with volunteers, order and polarity of slice gradients were chosen to reduce lipid contamination and the TRs were determined as the shortest values under SAR limitation. Water spectra in the MRS voxels were acquired too.
Spectra were analyzed using LCModel (version 6.3-1L). A semi-LASER basis set was developed in-house. Spectral phase parameters were determined with automatic phase correction for a spectral range of 0.2-4.0 ppm and were applied to that of 0.2-6.0 ppm for further analysis. Eddy current correction9 and water-scaling for quantification10 were performed using the water spectra. Estimated concentrations were corrected with water content in the MRS voxels11-12 and with institutional calibration factors for the sequences tested using a 1 % agar gel phantom containing 5 mM creatine monohydrate. A sum of fitted spectra of creatine and phosphocreatine was served as a reference.
The H1-α-glucose peaks in the baseline-corrected spectra were fitted to a Lorentzian peak with additional linear baseline correction in 5.05-5.45 ppm using in-house software on MATLAB (The MathWorks, Natick, MA, USA). The height, linewidth, and integral of the peaks were measured. SNR was calculated with the noise level as the SD of the signals in 0.2-0.6 ppm. The glucose concentration was calculated using ratios of the peak integrals, of the number of protons producing those peaks, of D-glucose isomers, and the concentration of the reference. Metabolite concentrations are expressed in mM without correction for relaxation times. Statistical analysis was conducted between the sequences, and a P < 0.05 was considered significant.
Results
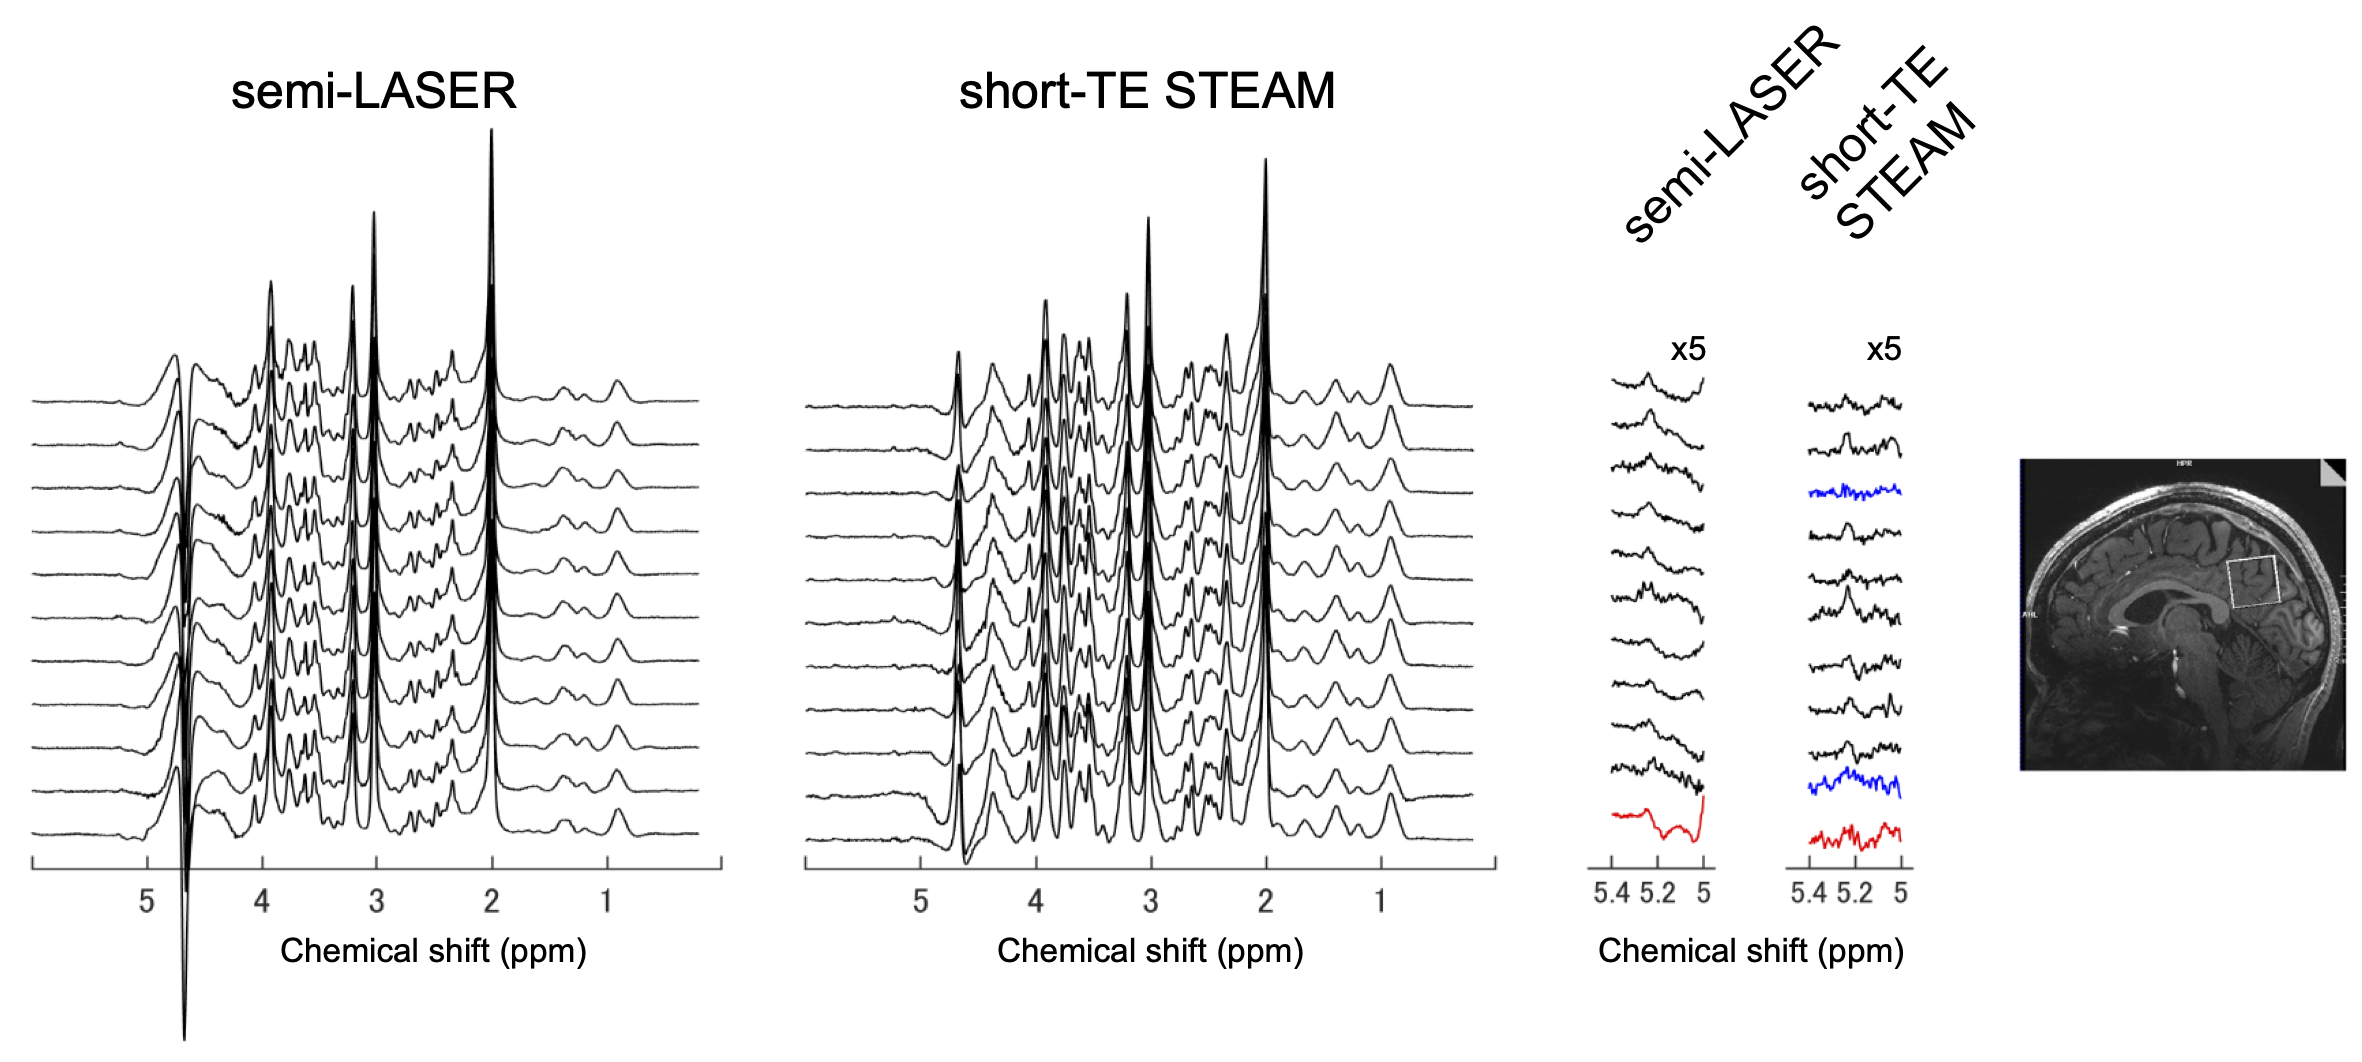
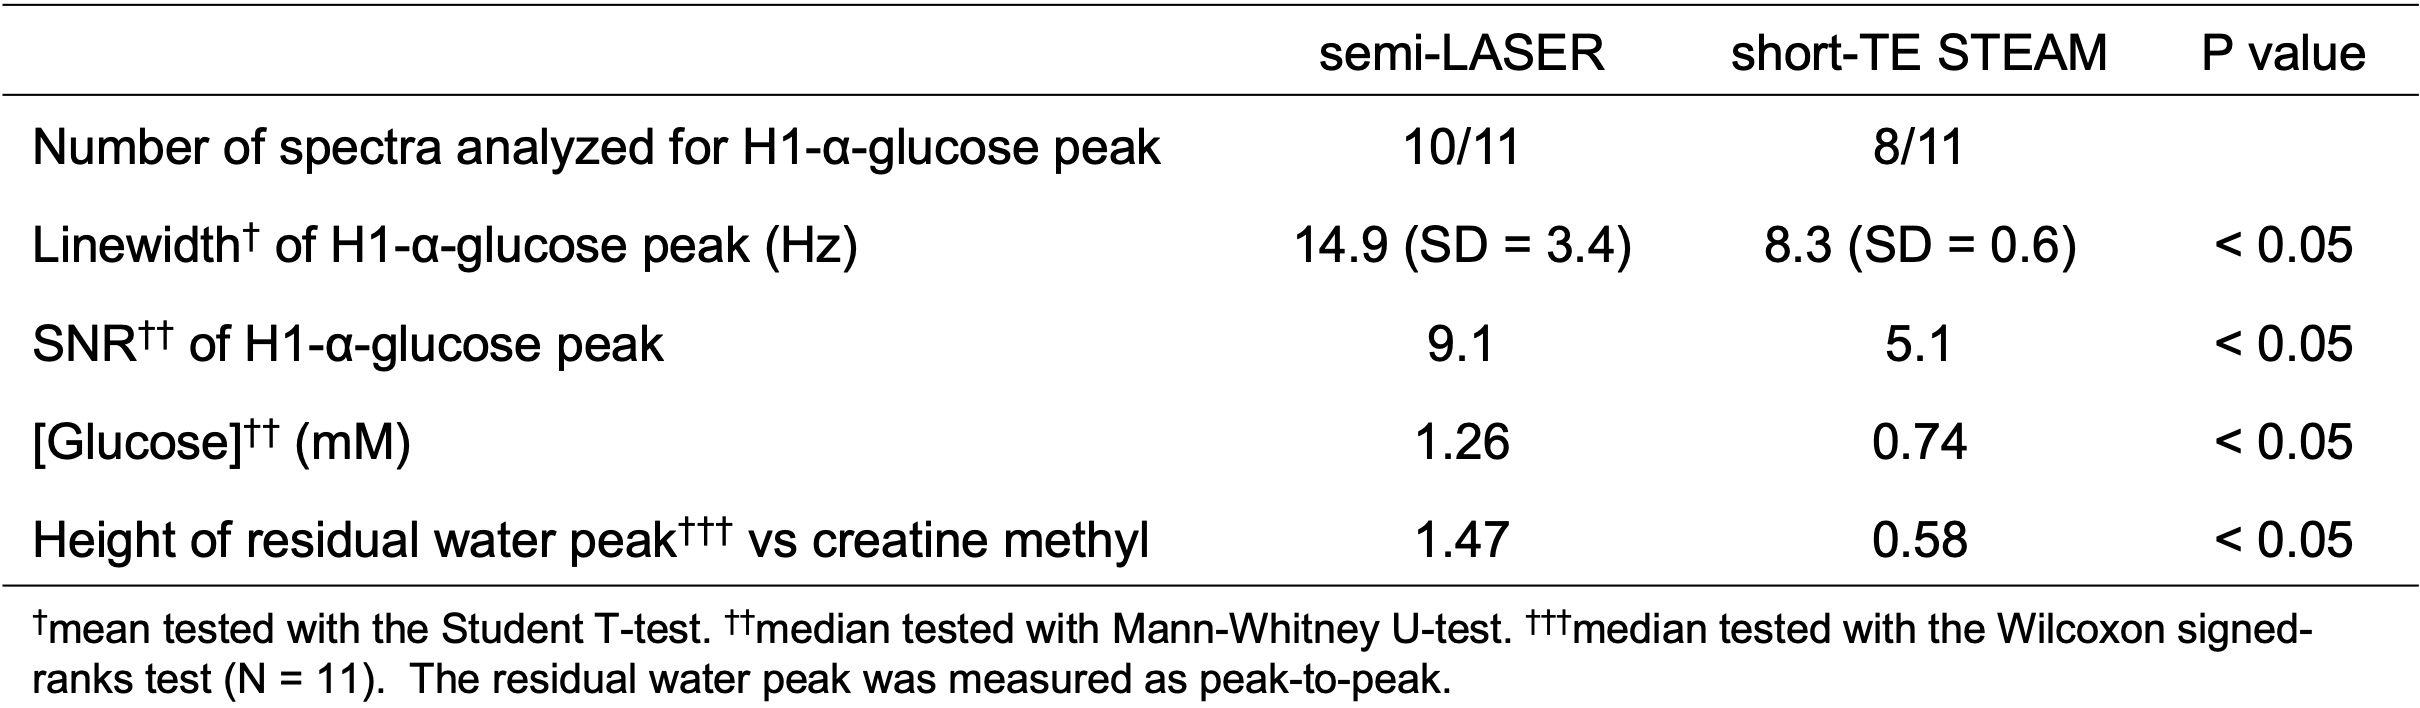
Lipid contamination was not observed in all the spectra except one short-TE STEAM spectrum. The spectra acquired from all the subjects are shown in Figure 1. The H1-α-glucose peak was detected in all the semi-LASER spectra but was not identified in two short-TE STEAM spectra. In a subject, the peak could not be fitted in both spectra due to strong nuisance signals between the peaks of glucose and water. Results from the spectral analysis are shown in Table 1. The linewidths and SNRs of the H1-α-glucose peak were significantly broader and higher in the semi-LASER spectra than those in the short-TE STEAM spectra, respectively. The median glucose concentrations based on semi-LASER and short-TE STEAM were 1.26 and 0.74 mM, respectively.Line shapes of the residual water peak resembled in each sequence. Water peaks were significantly better suppressed in the short-TE STEAM spectra than those in the semi-LASER spectra. Baselines around the H1-α-glucose peak were instable, especially in the semi-LASER spectra.
Discussion
In this study, semi-LASER demonstrated higher sensitivity to detect the H1-α-glucose peak than short-TE STEAM. Even though the SNR of the peak in the short-TE STEAM spectra was in a range of acceptable values (SNR > 5) for estimating a detection limit in analytical chemistry guideline,13 the lower SNR inherent in STEAM sequence might lead to the results of the narrow line width and underestimation of glucose concentration. Another reason for the concentration difference might be CSD. More robust water suppression techniques are required to stabilize baseline around the H1-α-glucose peak for fitting.Conclusion
Semi-LASER has an advantage to detect the H1-α-glucose peak in the human brain over short-TE STEAM, but water suppression technique should be improved for quantification.Acknowledgements
The authors thank Mr. Koji Yasuda (LA Systems) to support LCModel, Dr. Lana G Kaiser (University of California, Berkeley) to provide the semi-LASER basis set, Dr. Tobias Kober (Siemens Healthcare GmbH) to provide the prototype MPRAGE sequence.References
1. Duarte JMN, Gruetter R. Cerebral glucose transport and homeostasis. In: Choi I-Y and Gruetter R. Neural Metabolism in vivo. New York: Springer; 2012. P 655-673.
2. Gruetter R, Garwood M, Ugurbil K, Seaquist ER. Observation of resolved glucose signals in 1H NMR spectra of the human brain at 4T. Magn Reson Med 1996;36:1-6.
3. Gruetter R, Ugurbil K, Seaquist ER. Steady-state cerebral glucose concentrations and transport in the human brain. J Neurochem 1998;70:397-408.
4. Fichtner ND, Henning A, Zoelch N, Boesch C, Kreis R. Elucidation of the downfield spectrum of human brain at 7 T using multiple inversion recovery delays and echo times. Magn Reson Med 2017;78:11-19.
5. Kuribayashi H, Salibi N, Seethamraju RT et al. Detection of metabolite concentration changes in young adult volunteer brains after oral glucose administration using short-TE STEAM 1H MRS sequence at 7T. In: Proc 27th Annual Meeting ISMRM, Montreal; 2018, p. 4238.
6. Scheenen TWJ, Klomp DWJ, Wijnen JP, Heerschap A. Short echo time 1H-MRSI of the human brain at 3T with minimal chemical shift displacement errors using adiabatic refocusing pulses. Magn Reson Med 2008;59:1-6.
7. Gruetter R, Tkac I. Field mapping without reference scan using symmetric echo-planar technique. Magn Reson Med 2000;43:319-323.
8. Tkac I, Starcuk Z, Choi I-Y, Gruetter R. In vivo 1H NMR spectroscopy of rat brain at 1 ms echo time. Magn Reson Med 1999; 41:649-656.
9. Klose U. In vivo proton spectroscopy in presence of eddy currents. Magn Reson Med 1990;14:26–30.
10. Gasparovic C, Song T, Devier D, et al. Use of tissue water as a concentration reference for proton spectroscopic imaging. Magn Reson Med 2006;55:1219–1226.
11. Provencher S. In: LCModel & LCMgui User’s manual: 2019, p. 129.
12. Quadrelli S, Mountford C, Ramadan S. Hitchhiker’s guide to voxel segmentation for partial volume correction of in vivo magnetic resonance spectroscopy. Magn Reson Insights 2016;27:1-8.
13. Analytical detection limit guidance & laboratory guide for determining method detection limits. Wisconsin department of natural resources laboratory certification program. (1996) https://dnr.wi.gov/regulations/labcert/documents/guidance/-LODguide.pdf
Figures